Energy
Cobalt: A Precarious Supply Chain

Cobalt: A Precarious Supply Chain
How does your mobile phone last for 12 hours on just one charge?
It’s the power of cobalt, along with several other energy metals, that keeps your lithium-ion battery running.
The only problem? Getting the metal from the source to your electronics is not an easy feat, and this makes for an extremely precarious supply chain for manufacturers.
Our infographic today comes to us from LiCo Energy Metals, and it focuses on where this important ingredient of green technology originates from, and the supply risks associated with its main sources.
What is Cobalt?
Cobalt is a transition metal found between iron and nickel on the periodic table. It has a high melting point (1493°C) and retains its strength to a high temperature.
Similar to iron or nickel, cobalt is ferromagnetic. It can retain its magnetic properties to 1100°C, a higher temperature than any other material. Ferromagnetism is the strongest type of magneticism: it’s the only one that typically creates forces strong enough to be felt, and is responsible for the magnets encountered in everyday life.
These unique properties make the metal perfect for two specialized high-tech purposes: superalloys and battery cathodes.
Superalloys
High-performance alloys drive 18% of cobalt demand. The metal’s ability to withstand intense temperatures and conditions makes it perfect for use in:
- Turbine blades
- Jet engines
- Gas turbines
- Prosthetics
- Permanent magnets
Lithium-ion Batteries:
Batteries drives 49% of demand – and most of this comes from cobalt’s usage in lithium-ion battery cathodes:
| Type of lithium-ion cathode | Cobalt in cathode | Spec. energy (Wh/kg) |
|---|---|---|
| LFP | 0% | 120 |
| LMO | 0% | 140 |
| NMC | 15% | 200 |
| LCO | 55% | 200 |
| NCA | 10% | 245 |
The three most powerful cathode formulations for li-ion batteries all need cobalt. As a result, the metal is indispensable in many of today’s battery-powered devices.
- Mobile phones (LCO)
- Tesla Model S (NCA)
- Tesla Powerwall (NMC)
- Chevy Volt (NMC/LMO)
The Tesla Powerwall 2 uses approximately 7kg, and a Tesla Model S (90 kWh) uses approximately 22.5kg of the energy metal.
The Cobalt Supply Chain
Cobalt production has gone almost straight up to meet demand, and production has more than doubled since the early 2000s.
But while the metal is desired, getting it is the hard part:
1. No native cobalt has ever been found in nature.
There are four widely-distributed ores that exist, but almost no cobalt is mined from them as a primary source.
2. Most cobalt production is mined as a by-product.
| Mine source | % cobalt production |
|---|---|
| Nickel (by-product) | 60% |
| Copper (by-product) | 38% |
| Cobalt (primary) | 2% |
This means it is hard to expand production when more is needed.
3. Most production occurs in the DRC, a country with elevated supply risks:
| Country | Tonnes | % |
|---|---|---|
| United States | 524 | 0.4% |
| China | 1,417 | 1.2% |
| DRC | 67,975 | 55.4% |
| Rest of World | 52,785 | 43.0% |
| Total | 122,701 | 100.0% |
(Source: CRU, estimated production for 2017, tonnes)
The Future of Cobalt Supply
Companies like Tesla and Panasonic need reliable sources of the metal, and right now there aren’t many failsafes.
The U.S. hasn’t mined cobalt in significant volumes since 1971, and the USGS reports that the United States only has 301 tonnes of the metal stored in stockpiles.
The reality is that the DRC produces about half of all cobalt, and it also holds approximately 47% of all global reserves.
Why is this a concern for end-users?
1. The DRC is one of the poorest, corrupt, and most coercive countries in the planet.
It ranks:
- 151st out of 159 countries in the Human Freedom Index
- 176th out of 188 countries on the Human Development Index
- 178th out of 184 countries in terms of GDP per capita ($455)
- 148th out of 169 countries in the Corruption Perceptions Index
2. The DRC has had more deaths from war since WWII than any other country on the planet.
Recent wars in the DRC:
- First Congo War (1996-1997) – A foreign invasion by Rwanda that overthrew the Mobutu regime.
- Second Congo War (1998-2003) – The bloodiest conflict in world history since WW2 with 5.4 million deaths.
3. Human Rights in Mining
The DRC government estimates that 20% of all cobalt production in the country comes from artisanal miners – independent workers who dig holes and mine ore without sophisticated mines or machinery.
There are at least 100,000 artisanal cobalt miners in the DRC, and UNICEF estimates that up to 40,000 children could be in the trade. Children can be as young as seven years old, and they can work up to 12 hrs with physically demanding work, earning $2 per day.
Meanwhile, Amnesty International alleges that Apple, Samsung, and Sony fail to do basic checks in making sure the metal in their supply chains did not come from child labor.
Most major companies have vowed that any such practices will not be tolerated in their supply chains.
Other Sources
Where will tomorrow’s supply come from, and will the role of the DRC eventually diminish? Will Tesla achieve its goal of a North American supply chain for its key metal inputs?
Mining exploration companies are already looking to regions like Ontario, Idaho, British Columbia, and the Northwest Territories to find tomorrow’s deposits:
Ontario: Ontario is one of the only places in the world where cobalt-primary mines that have existed. This camp is nearby the aptly named town of Cobalt, Ontario, which is located halfway between Sudbury – the world’s “Nickel Capital”, and Val-d’Or, one of the most famous gold camps in the world.
Idaho: Idaho is known as the “Gem State” while also being known for its silver camps in Couer D’Alene – but it has also been a cobalt producer in the past.
BC: The mountains of British Columbia are known for their rich gold, silver, copper, zinc, and met coal deposits. But cobalt often occurs with copper, and some mines in BC have produced cobalt in the past.
Northwest Territories: Cobalt can also be found up north, as the NWT becomes a more interesting mineral destination for companies. 160km from Yellowknife is a gold-cobalt-bismuth-copper deposit being developed.
Energy
Mapped: The Age of Energy Projects in Interconnection Queues, by State
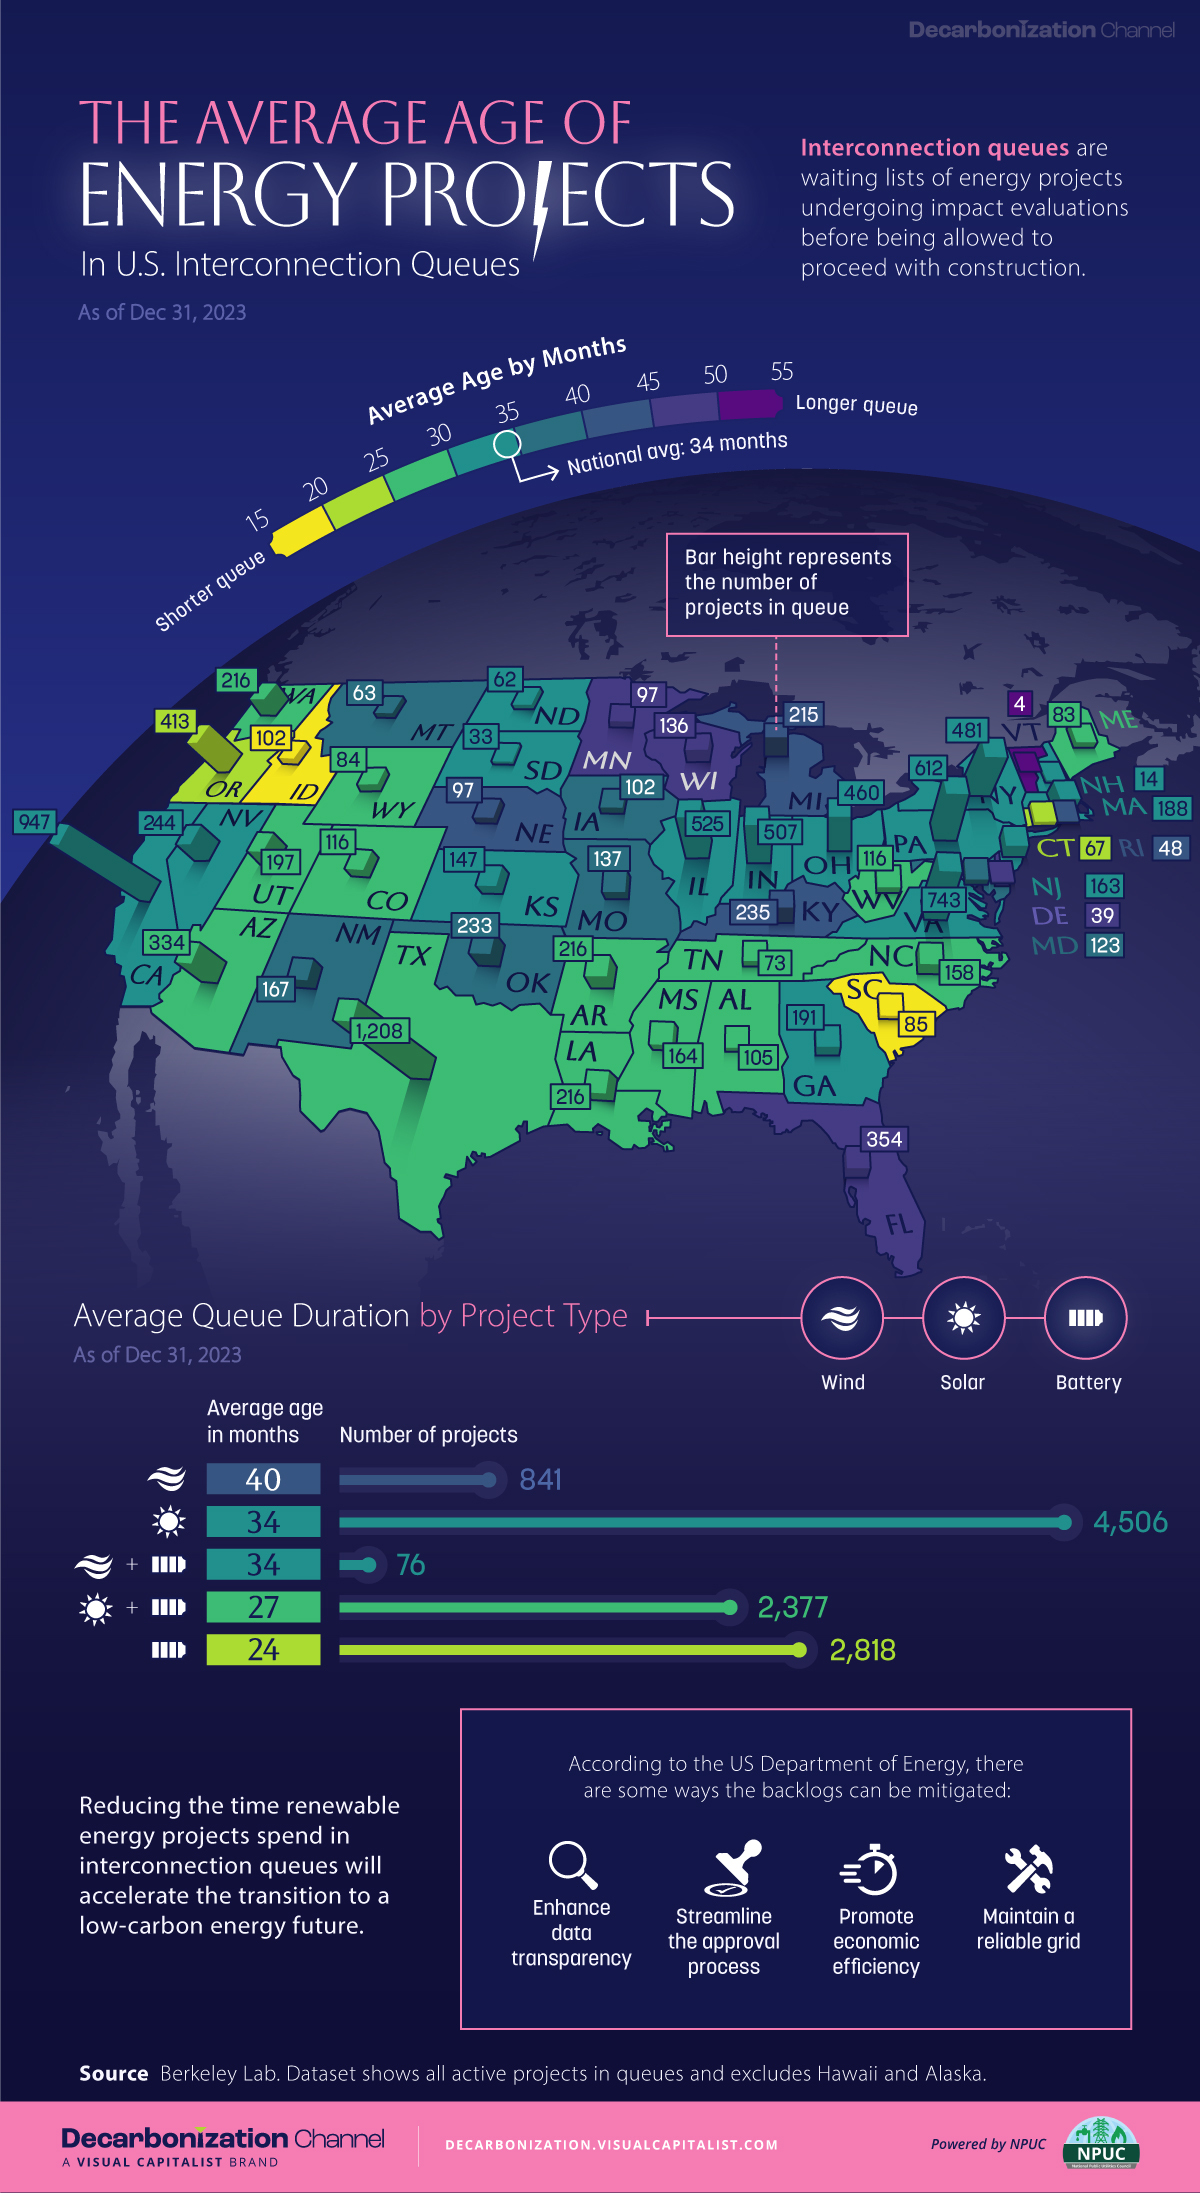
This map shows how many energy projects are in interconnection queues by state and how long these projects have been queued up, on average.

Age of Energy Projects in Interconnection Queues, by State
This was originally posted on our Voronoi app. Download the app for free on iOS or Android and discover incredible data-driven charts from a variety of trusted sources.
By the end of 2023, more than 11,000 energy projects were in interconnection queues in the United States, waiting for a green-light from regional grid operators to proceed with construction.
This map, created in partnership with the National Public Utilities Council, maps out the average age of active energy projects in interconnection queues by state, using data from Berkeley Lab.
Interconnection Queues, Explained
Interconnection queues are lists of energy projects that have made interconnection requests to their regional grid operators. Once submitted, these requests formally initiate the impact study process that each project goes through before grid connection, forming waiting lists for approval known as interconnection queues.
In recent years, both the number and generation capacity of queued projects have surged in the United States, along with the length of time spent in queue.
According to Berkeley Lab, the amount of generation capacity entering queues each year has risen by more than 550% from 2015 to 2023, with average queue duration rising from 3 years to 5 years the same period.
As a result of the growing backlog, a large proportion of projects ultimately withdraw from queues, leading to only 19% of applications reaching commercial operations.
The Backlog: Number of Projects and Average Wait Times
Of the 11,000 active projects in U.S. queues at the end of 2023, Texas, California, and Virginia had the most in queue; 1,208, 947, and 743, respectively.
When looking at the average ages of these projects, all three states hovered around the national average of 34 months (2.83 years), with Texas sporting 28 months, California 33, and Virginia 34.
Vermont, Minnesota, Wisconsin, and Florida, on the other hand, had the highest average queue durations; 54, 49, 47, and 46 months, respectively.
Average Queue Duration by Project Type
At the end of 2023, more than 95% of the generation capacity in active interconnection queues was for emission-free resources. The table below provides a breakdown.
| Project Type | Average Queue Duration (As of 12/31/2023) | Number of Projects in Queue |
|---|---|---|
| Wind | 40 months | 841 |
| Solar | 34 months | 4,506 |
| Wind+Battery | 34 months | 76 |
| Solar+Battery | 27 months | 2,377 |
| Battery | 24 months | 2,818 |
Wind projects had the highest wait times at the end of 2023 with an average age of 40 months (3.33 years). Solar projects, on the other hand, made up more than 40% of projects in queue.
Overall, reducing the time that these renewable energy projects spend in queues can accelerate the transition to a low-carbon energy future.
According to the U.S. Department of Energy, enhancing data transparency, streamlining approval processes, promoting economic efficiency, and maintaining a reliable grid are some of the ways this growing backlog can be mitigated.
-

 Culture7 days ago
The World’s Top Media Franchises by All-Time Revenue
-

 Science2 weeks ago
Visualizing the Average Lifespans of Mammals
-

 Brands2 weeks ago
How Tech Logos Have Evolved Over Time
-

 Energy2 weeks ago
Ranked: The Top 10 EV Battery Manufacturers in 2023
-

 Countries2 weeks ago
Countries With the Largest Happiness Gains Since 2010
-

 Economy2 weeks ago
VC+: Get Our Key Takeaways From the IMF’s World Economic Outlook
-

 Demographics2 weeks ago
The Countries That Have Become Sadder Since 2010
-

 Money1 week ago
Charted: Who Has Savings in This Economy?


