
Analysts’ Viewpoint on Market Scenario
Extensive usage of lithium batteries in automotive, electronics, and medical equipment is primarily driving the demand for minerals that are used to manufacture lithium batteries globally. Battery manufacturers are focusing on the development of lithium battery minerals that offer more power, have higher energy density, and a longer lifespan while being safer and less expensive. Producers of minerals are likely to expand their market intelligence capabilities in order to monitor supply-side developments. Supply-side tracking should at least include the available and committed portions of existing and upcoming production capacities, trends in mineral prices, the environmental, social, and governance (ESG) performance of suppliers, and policy and regulatory developments in resource-rich countries. However, stringent government regulations and mining policies could restrain the demand for minerals in lithium batteries in the near future. Therefore, mining companies are expected to significantly reduce their environmental footprint in order to align themselves with the demand of governments, investors, and stakeholders.
Minerals utilized in the manufacture of batteries are known as battery minerals. Battery minerals include lithium, cobalt, manganese, graphite, nickel, alumina, tin, magnesium, and rare earth minerals, depending on the nature of the battery. Lithium, cobalt, nickel, manganese, and graphite are more precisely referred to as ‘battery minerals’. Another often-used term that does not include nonmetallic material graphite is ‘battery metals’. Demand for lithium mining has been rising for the last few years due to the battery industry's increased focus on environmental and fuel efficiency issues.
The global minerals market for lithium batteries is estimated to advance at a considerable pace during the forecast period, owing to the favorable properties of minerals used in lithium batteries, specifically for applications in automotive and construction industries.
Request a sample to get extensive insights into the Minerals Market for Lithium Batteries
Demand for electric vehicles (EVs) is rising in order to decrease transportation-related pollutants and reliance on imported fuel. Global purchase of electric vehicles (EVs) surged in 2021. Governments of several countries announced incentives that made electric vehicles (EVs) affordable.
Majority of electric vehicles use the lithium batteries that are based on battery minerals such as lithium, cobalt, graphite, manganese, nickel. Technological developments and a change in battery design contributed to the phenomenal growth in lithium mining between 2020 and 2022. Rechargeable batteries help comply with emission regulations. Governments of numerous countries are pushing EVs by offering incentives and enacting net zero emission regulations. Demand for electric vehicles has been increasing for the last few years, and China currently dominates the global electric vehicles industry. China sold 3.3 million more vehicles than the rest of the world combined in 2021.
Rapid transition to electric vehicles (EVs) is estimated to rapidly propel the demand for minerals used to produce batteries. Apart from the minerals needed to produce modern lithium batteries, more attention is focused on the cost of the materials used for EV battery cathode production.
Consumers are turning toward smart homes as a result of convenience and rising disposable money. Consumers may now operate household appliances with basic voice commands for connectivity, voice control, and speech recognition.
Numerous initiatives are being undertaken to integrate modern technologies such as 5G, IoT, AI, and machine learning in electronics equipment. According to IBEF, in 2020, the global consumer electronics market was valued at US$ 426.1 Bn.
Battery minerals are the raw materials used in the production of batteries such as lithium, nickel, cobalt, manganese, and graphite. These battery minerals are increasingly being used in lithium batteries for electric vehicles, consumer electronics, and other applications.
Companies are investing in resources and the development of efficient and new battery technologies that are likely to fuel the demand for innovative electronics globally. Increased reliance on portable power chargers and mobile phones is also expected to boost the minerals market for lithium batteries during the forecast period.
Request a custom report on Minerals Market for Lithium Batteries
In terms of mineral, the market segmentation comprises lithium, cobalt, nickel, manganese, graphite, others (aluminium, iron, etc.). The graphite mineral segment accounted for the largest revenue share of 29.0% in 2020. Graphite can be utilized as an anode material for lithium batteries in both natural and synthetic forms. Around 70% of all graphite comes from China, and there are few viable alternatives for batteries.
Asia Pacific was expected to dominate the global minerals market for lithium batteries in 2021. It share stood at 54.7% in 2021. It is expected to grow at a CAGR of 15.5% and reach 63.9% share by 2031. China has banned the sale of scooters powered by conventional fossil fuels in order to curb emissions, which has driven the sales of e-scooters.
Additionally, Asia Pacific has risen as a global manufacturing hub and has led to a rise in usage of tools and devices powered by lithium-ion batteries. Furthermore, Asia Pacific registered record sales of laptops, smartphones, and other consumer electronics, as the region is home to around 60% of the global population.
The electric vehicles market in India and China is growing at a rapid pace, which is a key factor that is positively influencing the demand for minerals for lithium batteries. The global lithium mining business is dominated by Australia due to a high amount of lithium reserves, coupled with massive mining projects in the country. Rise in awareness about utilizing environment-friendly electric vehicles is also estimated to boost the minerals industry in the country. Chile holds the second-largest lithium mining industry share due to the increase in brine mining activities in the region.
The global market for minerals for lithium batteries is highly fragmented, with a small number of large-scale vendors controlling majority of the share. Most companies are investing considerably in comprehensive research and development activities, primarily to create environmentally-friendly products. Expansion of product portfolios and mergers and acquisitions are notable strategies adopted by key players. Prominent market players include Glencore, BHP, Rio Tinto, Vale, Anglo American Plc, Zijin Mining Group Co., Ltd., MMG Australia Limited, Albemarle Corporation, SQM SA, Ganfeng Lithium Co.,Ltd., Pilbara Minerals, Ma’aden, Tianqi Lithium, ALLKEM LIMITED.
Key players have been profiled in the market research report based on parameters such as company overview, product portfolio, business strategies, financial overview, business segments, and recent developments.
|
Attribute |
Detail |
|
Market Size Value in 2021 |
US$ 14.3 Bn |
|
Market Forecast Value in 2031 |
US$ 58.4Bn |
|
Growth Rate (CAGR) |
15.2% |
|
Forecast Period |
2022–2031 |
|
Historical Data Available for |
2020 |
|
Quantitative Units |
US$ Bn for Value and Tons for Volume |
|
Market Analysis |
It includes cross-segment analysis at the global as well as regional level. Furthermore, the qualitative analysis includes drivers, restraints, opportunities, key trends, Porter’s Five Forces analysis, value chain analysis, and key trend analysis. |
|
Competition Landscape |
|
|
Format |
Electronic (PDF) + Excel |
|
Market Segmentation |
|
|
Regions Covered |
|
|
Countries Covered |
|
|
Companies Profiled |
|
|
Customization Scope |
Available upon request |
|
Pricing |
Available upon request |
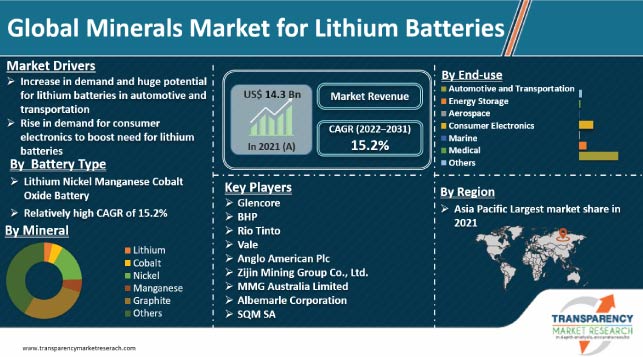
The global market stood at US$ 14.3 Bn in 2021
The market is expected to advance at a CAGR of 15.2% from 2022 to 2031
Increase in demand and huge potential for lithium battery in automotive and transportation and rise in demand for consumer electronics
The graphite mineral segment accounted for major value share of 29.0% in 2021
Asia Pacific is a more attractive region for vendors in the global market
Glencore, BHP, Rio Tinto, Vale, Anglo American Plc, Zijin Mining Group Co., Ltd., MMG Australia Limited, Albemarle Corporation, SQM SA, Ganfeng Lithium Co.,Ltd. , Pilbara Minerals, Ma’aden, Tianqi Lithium, ALLKEM LIMITED.
1. Executive Summary
1.1. Global Market Outlook
1.2. Demand Side Trends
1.3. Key Facts and Figures
1.4. Trends Impacting Market
1.5. TMR’s Growth Opportunity Wheel
2. Market Overview
2.1. Market Segmentation
2.2. Key Developments
2.3. Market Definitions
2.4. Key Market Trends
2.5. Market Dynamics
2.5.1. Drivers
2.5.2. Restraints
2.5.3. Opportunities
2.6. Global Minerals Market for Lithium Batteries Analysis and Forecast, 2022-2031
2.6.1. Global Minerals Market for Lithium Batteries Volume (Tons)
2.6.2. Global Minerals Market for Lithium Batteries Revenue (US$ Bn)
2.7. Porter’s Five Forces Analysis
2.8. Regulatory Landscape
2.9. Value Chain Analysis
2.9.1. List of Mineral Providers
2.9.2. List of Manufacturers
2.9.3. List of Dealers/Distributors
2.9.4. List of Potential Customers
2.10. Production Overview
2.11. Product Specification Analysis
2.12. Cost Structure Analysis
3. COVID-19 Impact Analysis
3.1. Impact on the Supply Chain of the Minerals Market for Lithium Batteries
3.2. Impact on the Demand of Minerals Market for Lithium Batteries– Pre & Post Crisis
4. Impact of Current Geopolitical Scenario on Market
5. Production Output Analysis (Tons), 2021
5.1. North America
5.2. Europe
5.3. Asia Pacific
5.4. Latin America
5.5. Middle East and Africa
6. Price Trend Analysis and Forecast (US$/Ton), 2022-2031
6.1. Price Comparison Analysis by Mineral
6.2. Price Comparison Analysis by Region
7. Global Minerals Market for Lithium Batteries Analysis and Forecast, by Mineral, 2022–2031
7.1. Introduction and Definitions
7.2. Global Minerals Market for Lithium Batteries Volume (Tons) and Value (US$ Bn) Forecast, by Mineral, 2022–2031
7.2.1. Lithium
7.2.2. Cobalt
7.2.3. Nickel
7.2.4. Manganese
7.2.5. Graphite
7.2.6. Others (Aluminium, Iron, etc.)
7.3. Global Minerals Market for Lithium Batteries Attractiveness, by Mineral
8. Global Minerals Market for Lithium Batteries Analysis and Forecast, by Battery Type, 2022–2031
8.1. Introduction and Definitions
8.2. Global Minerals Market for Lithium Batteries Volume (Tons) and Value (US$ Bn) Forecast, by Battery Type, 2022–2031
8.2.1. Lithium Iron Phosphate Battery
8.2.2. Lithium Cobalt Oxide Battery
8.2.3. Lithium Manganese Oxide Battery
8.2.4. Lithium Nickel Manganese Cobalt Oxide Battery
8.2.5. Lithium Nickel Cobalt
8.2.6. Aluminium Oxide Battery
8.2.7. Others
8.3. Global Minerals Market for Lithium Batteries Attractiveness, by Battery Type
9. Global Minerals Market for Lithium Batteries Analysis and Forecast, End-use, 2022–2031
9.1. Introduction and Definitions
9.2. Global Minerals Market for Lithium Batteries Volume (Tons) and Value (US$ Bn) Forecast, by End-use, 2022–2031
9.3. Automotive and Transportation
9.3.1. Energy Storage
9.3.2. Aerospace
9.3.3. Consumer Electronics
9.3.4. Marine
9.3.5. Medical
9.3.6. Others
9.4. Global Minerals Market for Lithium Batteries Attractiveness, by End-use
10. Global Minerals Market for Lithium Batteries Analysis and Forecast, by Region, 2022–2031
10.1. Key Findings
10.2. Global Minerals Market for Lithium Batteries Volume (Tons) and Value (US$ Bn) Forecast, by Region, 2022–2031
10.2.1. North America
10.2.2. Europe
10.2.3. Asia Pacific
10.2.4. Latin America
10.2.5. Middle East & Africa
10.3. Global Minerals Market for Lithium Batteries Attractiveness, by Region
11. North America Minerals Market for Lithium Batteries Analysis and Forecast, 2022–2031
11.1. Key Findings
11.2. North America Minerals Market for Lithium Batteries Volume (Tons) and Value (US$ Bn) Forecast, by Mineral, 2022–2031
11.3. North America Minerals Market for Lithium Batteries Volume (Tons) and Value (US$ Bn) Forecast, by Battery Type, 2022–2031
11.4. North America Minerals Market for Lithium Batteries Volume (Tons) and Value (US$ Bn) Forecast, by End-use, 2022–2031
11.5. North America Minerals Market for Lithium Batteries Volume (Tons) and Value (US$ Bn) Forecast, by Country, 2022–2031
11.5.1. U.S. Minerals Market for Lithium Batteries Volume (Tons) and Value (US$ Bn) Forecast, by Mineral, 2022–2031
11.5.2. U.S. Minerals Market for Lithium Batteries Volume (Tons) and Value (US$ Bn) Forecast, by Battery Type, 2022–2031
11.5.3. U.S. Minerals Market for Lithium Batteries Volume (Tons) and Value (US$ Bn) Forecast, by End-use, 2022–2031
11.5.4. Canada Minerals Market for Lithium Batteries Volume (Tons) and Value (US$ Bn) Forecast, by Mineral, 2022–2031
11.5.5. Canada Minerals Market for Lithium Batteries Volume (Tons) and Value (US$ Bn) Forecast, by Battery Type, 2022–2031
11.5.6. Canada Minerals Market for Lithium Batteries Volume (Tons) and Value (US$ Bn) Forecast, by End-use, 2022–2031
11.6. North America Minerals Market for Lithium Batteries Attractiveness Analysis
12. Europe Minerals Market for Lithium Batteries Analysis and Forecast, 2022–2031
12.1. Key Findings
12.2. Europe Minerals Market for Lithium Batteries Volume (Tons) and Value (US$ Bn) Forecast, by Mineral, 2022–2031
12.3. Europe Minerals Market for Lithium Batteries Volume (Tons) and Value (US$ Bn) Forecast, by Battery Type, 2022–2031
12.4. Europe Minerals Market for Lithium Batteries Volume (Tons) and Value (US$ Bn) Forecast, by End-use, 2022–2031
12.5. Europe Minerals Market for Lithium Batteries Volume (Tons) and Value (US$ Bn) Forecast, by Country and Sub-region, 2022-2031
12.5.1. Germany Minerals Market for Lithium Batteries Volume (Tons) and Value (US$ Bn) Forecast, by Mineral, 2022–2031
12.5.2. Germany Minerals Market for Lithium Batteries Volume (Tons) and Value (US$ Bn) Forecast, by Battery Type, 2022–2031
12.5.3. Germany Minerals Market for Lithium Batteries Volume (Tons) and Value (US$ Bn) Forecast, by End-use, 2022–2031
12.5.4. France Minerals Market for Lithium Batteries Volume (Tons) and Value (US$ Bn) Forecast, by Mineral, 2022–2031
12.5.5. France Minerals Market for Lithium Batteries Volume (Tons) and Value (US$ Bn) Forecast, by Battery Type, 2022–2031
12.5.6. France Minerals Market for Lithium Batteries Volume (Tons) and Value (US$ Bn) Forecast, by End-use, 2022–2031
12.5.7. U.K. Minerals Market for Lithium Batteries Volume (Tons) and Value (US$ Bn) Forecast, by Mineral, 2022–2031
12.5.8. U.K. Minerals Market for Lithium Batteries Volume (Tons) and Value (US$ Bn) Forecast, by Battery Type, 2022–2031
12.5.9. U.K. Minerals Market for Lithium Batteries Volume (Tons) and Value (US$ Bn) Forecast, by End-use, 2022–2031
12.5.10. Italy Minerals Market for Lithium Batteries Volume (Tons) and Value (US$ Bn) Forecast, by Mineral, 2022–2031
12.5.11. Italy. Minerals Market for Lithium Batteries Volume (Tons) and Value (US$ Bn) Forecast, by Battery Type, 2022–2031
12.5.12. Italy Minerals Market for Lithium Batteries Volume (Tons) and Value (US$ Bn) Forecast, by End-use, 2022–2031
12.5.13. Russia & CIS Minerals Market for Lithium Batteries Volume (Tons) and Value (US$ Bn) Forecast, by Mineral, 2022–2031
12.5.14. Russia & CIS Minerals Market for Lithium Batteries Volume (Tons) and Value (US$ Bn) Forecast, by Battery Type, 2022–2031
12.5.15. Russia & CIS Minerals Market for Lithium Batteries Volume (Tons) and Value (US$ Bn) Forecast, by End-use, 2022–2031
12.5.16. Rest of Europe Minerals Market for Lithium Batteries Volume (Tons) and Value (US$ Bn) Forecast, by Mineral, 2022–2031
12.5.17. Rest of Europe Minerals Market for Lithium Batteries Volume (Tons) and Value (US$ Bn) Forecast, by Battery Type, 2022–2031
12.5.18. Rest of Europe Minerals Market for Lithium Batteries Volume (Tons) and Value (US$ Bn) Forecast, by End-use, 2022–2031
12.6. Europe Minerals Market for Lithium Batteries Attractiveness Analysis
13. Asia Pacific Minerals Market for Lithium Batteries Analysis and Forecast, 2022–2031
13.1. Key Findings
13.2. Asia Pacific Minerals Market for Lithium Batteries Volume (Tons) and Value (US$ Bn) Forecast, by Mineral
13.3. Asia Pacific Minerals Market for Lithium Batteries Volume (Tons) and Value (US$ Bn) Forecast, by Battery Type, 2022–2031
13.4. Asia Pacific Minerals Market for Lithium Batteries Volume (Tons) and Value (US$ Bn) Forecast, by End-use, 2022–2031
13.5. Asia Pacific Minerals Market for Lithium Batteries Volume (Tons) and Value (US$ Bn) Forecast, by Country and Sub-region, 2022-2031
13.5.1. China Minerals Market for Lithium Batteries Volume (Tons) and Value (US$ Bn) Forecast, by Mineral, 2022–2031
13.5.2. China Minerals Market for Lithium Batteries Volume (Tons) and Value (US$ Bn) Forecast, by Battery Type, 2022–2031
13.5.3. China Minerals Market for Lithium Batteries Volume (Tons) and Value (US$ Bn) Forecast, by End-use, 2022–2031
13.5.4. Japan Minerals Market for Lithium Batteries Volume (Tons) and Value (US$ Bn) Forecast, by Mineral, 2022–2031
13.5.5. Japan Minerals Market for Lithium Batteries Volume (Tons) and Value (US$ Bn) Forecast, by Battery Type, 2022–2031
13.5.6. Japan Minerals Market for Lithium Batteries Volume (Tons) and Value (US$ Bn) Forecast, by End-use, 2022–2031
13.5.7. India Minerals Market for Lithium Batteries Volume (Tons) and Value (US$ Bn) Forecast, by Mineral, 2022–2031
13.5.8. India Minerals Market for Lithium Batteries Volume (Tons) and Value (US$ Bn) Forecast, by Battery Type, 2022–2031
13.5.9. India Minerals Market for Lithium Batteries Volume (Tons) and Value (US$ Bn) Forecast, by End-use, 2022–2031
13.5.10. ASEAN Minerals Market for Lithium Batteries Volume (Tons) and Value (US$ Bn) Forecast, by Mineral, 2022–2031
13.5.11. ASEAN Minerals Market for Lithium Batteries Volume (Tons) and Value (US$ Bn) Forecast, by Battery Type, 2022–2031
13.5.12. ASEAN Minerals Market for Lithium Batteries Volume (Tons) and Value (US$ Bn) Forecast, by End-use, 2022–2031
13.5.13. Rest of Asia Pacific Minerals Market for Lithium Batteries Volume (Tons) and Value (US$ Bn) Forecast, by Mineral, 2022–2031
13.5.14. Rest of Asia Pacific Minerals Market for Lithium Batteries Volume (Tons) and Value (US$ Bn) Forecast, by Battery Type, 2022–2031
13.5.15. Rest of Asia Pacific Minerals Market for Lithium Batteries Volume (Tons) and Value (US$ Bn) Forecast, by End-use, 2022–2031
13.6. Asia Pacific Minerals Market for Lithium Batteries Attractiveness Analysis
14. Latin America Minerals Market for Lithium Batteries Analysis and Forecast, 2022–2031
14.1. Key Findings
14.2. Latin America Minerals Market for Lithium Batteries Volume (Tons) and Value (US$ Bn) Forecast, by Mineral, 2022–2031
14.3. Latin America Minerals Market for Lithium Batteries Volume (Tons) and Value (US$ Bn) Forecast, by Battery Type, 2022–2031
14.4. Latin America Minerals Market for Lithium Batteries Volume (Tons) and Value (US$ Bn) Forecast, by End-use, 2022–2031
14.5. Latin America Minerals Market for Lithium Batteries Volume (Tons) and Value (US$ Bn) Forecast, by Country and Sub-region, 2022-2031
14.5.1. Brazil Minerals Market for Lithium Batteries Volume (Tons) and Value (US$ Bn) Forecast, by Mineral, 2022–2031
14.5.2. Brazil Minerals Market for Lithium Batteries Volume (Tons) and Value (US$ Bn) Forecast, by Battery Type, 2022–2031
14.5.3. Brazil Minerals Market for Lithium Batteries Volume (Tons) and Value (US$ Bn) Forecast, by End-use, 2022–2031
14.5.4. Mexico Minerals Market for Lithium Batteries Volume (Tons) and Value (US$ Bn) Forecast, by Mineral, 2022–2031
14.5.5. Mexico Minerals Market for Lithium Batteries Volume (Tons) and Value (US$ Bn) Forecast, by Battery Type, 2022–2031
14.5.6. Mexico Minerals Market for Lithium Batteries Volume (Tons) and Value (US$ Bn) Forecast, by End-use, 2022–2031
14.5.7. Rest of Latin America Minerals Market for Lithium Batteries Volume (Tons) and Value (US$ Bn) Forecast, by Mineral, 2022–2031
14.5.8. Rest of Latin America Minerals Market for Lithium Batteries Volume (Tons) and Value (US$ Bn) Forecast, by Battery Type, 2022–2031
14.5.9. Rest of Latin America Minerals Market for Lithium Batteries Volume (Tons) and Value (US$ Bn) Forecast, by End-use, 2022–2031
14.6. Latin America Minerals Market for Lithium Batteries Attractiveness Analysis
15. Middle East & Africa Minerals Market for Lithium Batteries Analysis and Forecast, 2022–2031
15.1. Key Findings
15.2. Middle East & Africa Minerals Market for Lithium Batteries Volume (Tons) and Value (US$ Bn) Forecast, by Mineral, 2022–2031
15.3. Middle East & Africa Minerals Market for Lithium Batteries Volume (Tons) and Value (US$ Bn) Forecast, by Battery Type, 2022–2031
15.4. Middle East & Africa Minerals Market for Lithium Batteries Volume (Tons) and Value (US$ Bn) Forecast, by End-use, 2022–2031
15.5. Middle East & Africa Minerals Market for Lithium Batteries Volume (Tons) and Value (US$ Bn) Forecast, by Country and Sub-region, 2022-2031
15.5.1. GCC Minerals Market for Lithium Batteries Volume (Tons) and Value (US$ Bn) Forecast, by Mineral, 2022–2031
15.5.2. GCC Minerals Market for Lithium Batteries Volume (Tons) and Value (US$ Bn) Forecast, by Battery Type, 2022–2031
15.5.3. GCC Minerals Market for Lithium Batteries Volume (Tons) and Value (US$ Bn) Forecast, by End-use, 2022–2031
15.5.4. South Africa Minerals Market for Lithium Batteries Volume (Tons) and Value (US$ Bn) Forecast, by Mineral, 2022–2031
15.5.5. South Africa Minerals Market for Lithium Batteries Volume (Tons) and Value (US$ Bn) Forecast, by Battery Type, 2022–2031
15.5.6. South Africa Minerals Market for Lithium Batteries Volume (Tons) and Value (US$ Bn) Forecast, by End-use, 2022–2031
15.5.7. Rest of Middle East & Africa Minerals Market for Lithium Batteries Volume (Tons) and Value (US$ Bn) Forecast, by Mineral, 2022–2031
15.5.8. Rest of Middle East & Africa Minerals Market for Lithium Batteries Volume (Tons) and Value (US$ Bn) Forecast, by Battery Type, 2022–2031
15.5.9. Rest of Middle East & Africa Minerals Market for Lithium Batteries Volume (Tons) and Value (US$ Bn) Forecast, by End-use, 2022–2031
15.6. Middle East & Africa Minerals Market for Lithium Batteries Attractiveness Analysis
16. Competition Landscape
16.1. Market Players - Competition Matrix (by Tier and Size of Companies)
16.2. Market Share Analysis, 2021
16.3. Market Footprint Analysis
16.3.1. By Mineral
16.3.2. By Battery Type
16.3.3. By End-use
16.4. Company Profiles
16.4.1. Glencore
16.4.1.1. Company Revenue
16.4.1.2. Business Overview
16.4.1.3. Mineral Segments
16.4.1.4. Geographic Footprint
16.4.1.5. Production Capacity/Plant Details, etc. (*As Applicable)
16.4.1.6. Strategic Partnership, Capacity Expansion, New Mineral Innovation etc.
16.4.2. BHP
16.4.2.1. Company Revenue
16.4.2.2. Business Overview
16.4.2.3. Mineral Segments
16.4.2.4. Geographic Footprint
16.4.2.5. Production Capacity/Plant Details, etc. (*As Applicable)
16.4.2.6. Strategic Partnership, Capacity Expansion, New Mineral Innovation etc.
16.4.3. Rio Tinto
16.4.3.1. Company Revenue
16.4.3.2. Business Overview
16.4.3.3. Mineral Segments
16.4.3.4. Geographic Footprint
16.4.3.5. Production Capacity/Plant Details, etc. (*As Applicable)
16.4.3.6. Strategic Partnership, Capacity Expansion, New Mineral Innovation etc.
16.4.4. Vale
16.4.4.1. Company Revenue
16.4.4.2. Business Overview
16.4.4.3. Mineral Segments
16.4.4.4. Geographic Footprint
16.4.4.5. Production Capacity/Plant Details, etc. (*As Applicable)
16.4.4.6. Strategic Partnership, Capacity Expansion, New Mineral Innovation etc.
16.4.5. Anglo American Plc
16.4.5.1. Company Revenue
16.4.5.2. Business Overview
16.4.5.3. Mineral Segments
16.4.5.4. Geographic Footprint
16.4.5.5. Production Capacity/Plant Details, etc. (*As Applicable)
16.4.5.6. Strategic Partnership, Capacity Expansion, New Mineral Innovation etc.
16.4.6. Zijin Mining Group Co., Ltd.
16.4.6.1. Company Revenue
16.4.6.2. Business Overview
16.4.6.3. Mineral Segments
16.4.6.4. Geographic Footprint
16.4.6.5. Production Capacity/Plant Details, etc. (*As Applicable)
16.4.6.6. Strategic Partnership, Capacity Expansion, New Mineral Innovation etc.
16.4.7. MMG Australia Limited
16.4.7.1. Company Revenue
16.4.7.2. Business Overview
16.4.7.3. Mineral Segments
16.4.7.4. Geographic Footprint
16.4.7.5. Production Capacity/Plant Details, etc. (*As Applicable)
16.4.7.6. Strategic Partnership, Capacity Expansion, New Mineral Innovation etc.
16.4.8. Albemarle Corporation
16.4.8.1. Company Revenue
16.4.8.2. Business Overview
16.4.8.3. Mineral Segments
16.4.8.4. Geographic Footprint
16.4.8.5. Production Capacity/Plant Details, etc. (*As Applicable)
16.4.8.6. Strategic Partnership, Capacity Expansion, New Mineral Innovation etc.
16.4.9. SQM SA
16.4.9.1. Company Revenue
16.4.9.2. Business Overview
16.4.9.3. Mineral Segments
16.4.9.4. Geographic Footprint
16.4.9.5. Production Capacity/Plant Details, etc. (*As Applicable)
16.4.9.6. Strategic Partnership, Capacity Expansion, New Mineral Innovation etc.
16.4.10. Ganfeng Lithium Co.,Ltd.
16.4.10.1. Company Revenue
16.4.10.2. Business Overview
16.4.10.3. Mineral Segments
16.4.10.4. Geographic Footprint
16.4.10.5. Production Capacity/Plant Details, etc. (*As Applicable)
16.4.10.6. Strategic Partnership, Capacity Expansion, New Mineral Innovation etc.
16.4.11. Pilbara Minerals
16.4.11.1. Company Revenue
16.4.11.2. Business Overview
16.4.11.3. Mineral Segments
16.4.11.4. Geographic Footprint
16.4.11.5. Production Capacity/Plant Details, etc. (*As Applicable)
16.4.11.6. Strategic Partnership, Capacity Expansion, New Mineral Innovation etc.
16.4.12. Ma’aden
16.4.12.1. Company Revenue
16.4.12.2. Business Overview
16.4.12.3. Mineral Segments
16.4.12.4. Geographic Footprint
16.4.12.5. Production Capacity/Plant Details, etc. (*As Applicable)
16.4.12.6. Strategic Partnership, Capacity Expansion, New Mineral Innovation etc.
16.4.13. Tianqi Lithium
16.4.13.1. Company Revenue
16.4.13.2. Business Overview
16.4.13.3. Mineral Segments
16.4.13.4. Geographic Footprint
16.4.13.5. Production Capacity/Plant Details, etc. (*As Applicable)
16.4.13.6. Strategic Partnership, Capacity Expansion, New Mineral Innovation etc.
16.4.14. ALLKEM LIMITED
16.4.14.1. Company Revenue
16.4.14.2. Business Overview
16.4.14.3. Mineral Segments
16.4.14.4. Geographic Footprint
16.4.14.5. Production Capacity/Plant Details, etc. (*As Applicable)
16.4.14.6. Strategic Partnership, Capacity Expansion, New Mineral Innovation etc.
17. Primary Research: Key Insights
18. Appendix
List of Tables
Table 1: Global Minerals Market for Lithium Batteries Volume (Tons) Forecast, by Mineral, 2022–2031
Table 2: Global Minerals Market for Lithium Batteries Value (US$ Bn) Forecast, by Mineral, 2022–2031
Table 3: Global Minerals Market for Lithium Batteries Volume (Tons) Forecast, by Battery Type, 2022–2031
Table 4: Global Minerals Market for Lithium Batteries Value (US$ Bn) Forecast, by Battery Type, 2022–2031
Table 5: Global Minerals Market for Lithium Batteries Volume (Tons) Forecast, by End-use, 2022–2031
Table 6: Global Minerals Market for Lithium Batteries Value (US$ Bn) Forecast, by End-use, 2022–2031
Table 7: Global Minerals Market for Lithium Batteries Volume (Tons) Forecast, by Region, 2022–2031
Table 8: Global Minerals Market for Lithium Batteries Value (US$ Bn) Forecast, by Region, 2022–2031
Table 9: North America Minerals Market for Lithium Batteries Volume (Tons) Forecast, by Mineral, 2022–2031
Table 10: North America Minerals Market for Lithium Batteries Value (US$ Bn) Forecast, by Mineral, 2022–2031
Table 11: North America Minerals Market for Lithium Batteries Volume (Tons) Forecast, by Battery Type, 2022–2031
Table 12: North America Minerals Market for Lithium Batteries Value (US$ Bn) Forecast, by Battery Type, 2022–2031
Table 13: North America Minerals Market for Lithium Batteries Volume (Tons) Forecast, by End-use, 2022–2031
Table 14: North America Minerals Market for Lithium Batteries Value (US$ Bn) Forecast, by End-use, 2022–2031
Table 15: North America Minerals Market for Lithium Batteries Volume (Tons) Forecast, by Country, 2022–2031
Table 16: North America Minerals Market for Lithium Batteries Value (US$ Bn) Forecast, by Country, 2022–2031
Table 17: U.S. Minerals Market for Lithium Batteries Volume (Tons) Forecast, by Mineral, 2022–2031
Table 18: U.S. Minerals Market for Lithium Batteries Value (US$ Bn) Forecast, by Mineral, 2022–2031
Table 19: U.S. Minerals Market for Lithium Batteries Volume (Tons) Forecast, by Battery Type, 2022–2031
Table 20: U.S. Minerals Market for Lithium Batteries Value (US$ Bn) Forecast, by Battery Type, 2022–2031
Table 21: U.S. Minerals Market for Lithium Batteries Volume (Tons) Forecast, by End-use, 2022–2031
Table 22: U.S. Minerals Market for Lithium Batteries Value (US$ Bn) Forecast, by End-use, 2022–2031
Table 23: Canada Minerals Market for Lithium Batteries Volume (Tons) Forecast, by Mineral, 2022–2031
Table 24: Canada Minerals Market for Lithium Batteries Value (US$ Bn) Forecast, by Mineral, 2022–2031
Table 25: Canada Minerals Market for Lithium Batteries Volume (Tons) Forecast, by Battery Type, 2022–2031
Table 26: Canada Minerals Market for Lithium Batteries Value (US$ Bn) Forecast, by Battery Type, 2022–2031
Table 27: Canada Minerals Market for Lithium Batteries Volume (Tons) Forecast, by End-use, 2022–2031
Table 28: Canada Minerals Market for Lithium Batteries Value (US$ Bn) Forecast, by End-use, 2022–2031
Table 29: Europe Minerals Market for Lithium Batteries Volume (Tons) Forecast, by Mineral, 2022–2031
Table 30: Europe Minerals Market for Lithium Batteries Value (US$ Bn) Forecast, by Mineral, 2022–2031
Table 31: Europe Minerals Market for Lithium Batteries Volume (Tons) Forecast, by Battery Type, 2022–2031
Table 32: Europe Minerals Market for Lithium Batteries Value (US$ Bn) Forecast, by Battery Type, 2022–2031
Table 33: Europe Minerals Market for Lithium Batteries Volume (Tons) Forecast, by End-use, 2022–2031
Table 34: Europe Minerals Market for Lithium Batteries Value (US$ Bn) Forecast, by End-use, 2022–2031
Table 35: Europe Minerals Market for Lithium Batteries Volume (Tons) Forecast, by Country and Sub-region, 2022–2031
Table 36: Europe Minerals Market for Lithium Batteries Value (US$ Bn) Forecast, by Country and Sub-region, 2022–2031
Table 37: Germany Minerals Market for Lithium Batteries Volume (Tons) Forecast, by Mineral, 2022–2031
Table 38: Germany Minerals Market for Lithium Batteries Value (US$ Bn) Forecast, by Mineral, 2022–2031
Table 39: Germany Minerals Market for Lithium Batteries Volume (Tons) Forecast, by Battery Type, 2022–2031
Table 40: Germany Minerals Market for Lithium Batteries Value (US$ Bn) Forecast, by Battery Type, 2022–2031
Table 41: Germany Minerals Market for Lithium Batteries Volume (Tons) Forecast, by End-use, 2022–2031
Table 42: Germany Minerals Market for Lithium Batteries Value (US$ Bn) Forecast, by End-use, 2022–2031
Table 43: France Minerals Market for Lithium Batteries Volume (Tons) Forecast, by Mineral, 2022–2031
Table 44: France Minerals Market for Lithium Batteries Value (US$ Bn) Forecast, by Mineral, 2022–2031
Table 45: France Minerals Market for Lithium Batteries Volume (Tons) Forecast, by Battery Type, 2022–2031
Table 46: France Minerals Market for Lithium Batteries Value (US$ Bn) Forecast, by Battery Type, 2022–2031
Table 47: France Minerals Market for Lithium Batteries Volume (Tons) Forecast, by End-use, 2022–2031
Table 48: France Minerals Market for Lithium Batteries Value (US$ Bn) Forecast, by End-use, 2022–2031
Table 49: U.K. Minerals Market for Lithium Batteries Volume (Tons) Forecast, by Mineral, 2022–2031
Table 50: U.K. Minerals Market for Lithium Batteries Value (US$ Bn) Forecast, by Mineral, 2022–2031
Table 51: U.K. Minerals Market for Lithium Batteries Volume (Tons) Forecast, by Battery Type, 2022–2031
Table 52: U.K. Minerals Market for Lithium Batteries Value (US$ Bn) Forecast, by Battery Type, 2022–2031
Table 53: U.K. Minerals Market for Lithium Batteries Volume (Tons) Forecast, by End-use, 2022–2031
Table 54: U.K. Minerals Market for Lithium Batteries Value (US$ Bn) Forecast, by End-use, 2022–2031
Table 55: Italy Minerals Market for Lithium Batteries Volume (Tons) Forecast, by Mineral, 2022–2031
Table 56: Italy Minerals Market for Lithium Batteries Value (US$ Bn) Forecast, by Mineral, 2022–2031
Table 57: Italy Minerals Market for Lithium Batteries Volume (Tons) Forecast, by Battery Type, 2022–2031
Table 58: Italy Minerals Market for Lithium Batteries Value (US$ Bn) Forecast, by Battery Type, 2022–2031
Table 59: Italy Minerals Market for Lithium Batteries Volume (Tons) Forecast, by End-use, 2022–2031
Table 60: Italy Minerals Market for Lithium Batteries Value (US$ Bn) Forecast, by End-use, 2022–2031
Table 61: Spain Minerals Market for Lithium Batteries Volume (Tons) Forecast, by Mineral, 2022–2031
Table 62: Spain Minerals Market for Lithium Batteries Value (US$ Bn) Forecast, by Mineral, 2022–2031
Table 63: Spain Minerals Market for Lithium Batteries Volume (Tons) Forecast, by Battery Type, 2022–2031
Table 64: Spain Minerals Market for Lithium Batteries Value (US$ Bn) Forecast, by Battery Type, 2022–2031
Table 65: Spain Minerals Market for Lithium Batteries Volume (Tons) Forecast, by End-use, 2022–2031
Table 66: Spain Minerals Market for Lithium Batteries Value (US$ Bn) Forecast, by End-use, 2022–2031
Table 67: Russia & CIS Minerals Market for Lithium Batteries Volume (Tons) Forecast, by Mineral, 2022–2031
Table 68: Russia & CIS Minerals Market for Lithium Batteries Value (US$ Bn) Forecast, by Mineral, 2022–2031
Table 69: Russia & CIS Minerals Market for Lithium Batteries Volume (Tons) Forecast, by Battery Type, 2022–2031
Table 70: Russia & CIS Minerals Market for Lithium Batteries Value (US$ Bn) Forecast, by Battery Type, 2022–2031
Table 71: Russia & CIS Minerals Market for Lithium Batteries Volume (Tons) Forecast, by End-use, 2022–2031
Table 72: Russia & CIS Minerals Market for Lithium Batteries Value (US$ Bn) Forecast, by End-use, 2022–2031
Table 73: Rest of Europe Minerals Market for Lithium Batteries Volume (Tons) Forecast, by Mineral, 2022–2031
Table 74: Rest of Europe Minerals Market for Lithium Batteries Value (US$ Bn) Forecast, by Mineral, 2022–2031
Table 75: Rest of Europe Minerals Market for Lithium Batteries Volume (Tons) Forecast, by Battery Type, 2022–2031
Table 76: Rest of Europe Minerals Market for Lithium Batteries Value (US$ Bn) Forecast, by Battery Type, 2022–2031
Table 77: Rest of Europe Minerals Market for Lithium Batteries Volume (Tons) Forecast, by End-use, 2022–2031
Table 78: Rest of Europe Minerals Market for Lithium Batteries Value (US$ Bn) Forecast, by End-use, 2022–2031
Table 79: Asia Pacific Minerals Market for Lithium Batteries Volume (Tons) Forecast, by Mineral, 2022–2031
Table 80: Asia Pacific Minerals Market for Lithium Batteries Value (US$ Bn) Forecast, by Mineral, 2022–2031
Table 81: Asia Pacific Minerals Market for Lithium Batteries Volume (Tons) Forecast, by Battery Type, 2022–2031
Table 82: Asia Pacific Minerals Market for Lithium Batteries Value (US$ Bn) Forecast, by Battery Type, 2022–2031
Table 83: Asia Pacific Minerals Market for Lithium Batteries Volume (Tons) Forecast, by End-use, 2022–2031
Table 84: Asia Pacific Minerals Market for Lithium Batteries Value (US$ Bn) Forecast, by End-use, 2022–2031
Table 85: Asia Pacific Minerals Market for Lithium Batteries Volume (Tons) Forecast, by Country and Sub-region, 2022–2031
Table 86: Asia Pacific Minerals Market for Lithium Batteries Value (US$ Bn) Forecast, by Country and Sub-region, 2022–2031
Table 87: China Minerals Market for Lithium Batteries Volume (Tons) Forecast, by Mineral, 2022–2031
Table 88: China Minerals Market for Lithium Batteries Value (US$ Bn) Forecast, by Mineral 2022–2031
Table 89: China Minerals Market for Lithium Batteries Volume (Tons) Forecast, by Battery Type, 2022–2031
Table 90: China Minerals Market for Lithium Batteries Value (US$ Bn) Forecast, by Battery Type, 2022–2031
Table 91: China Minerals Market for Lithium Batteries Volume (Tons) Forecast, by End-use, 2022–2031
Table 92: China Minerals Market for Lithium Batteries Value (US$ Bn) Forecast, by End-use, 2022–2031
Table 93: Japan Minerals Market for Lithium Batteries Volume (Tons) Forecast, by Mineral, 2022–2031
Table 94: Japan Minerals Market for Lithium Batteries Value (US$ Bn) Forecast, by Mineral, 2022–2031
Table 95: Japan Minerals Market for Lithium Batteries Volume (Tons) Forecast, by Battery Type, 2022–2031
Table 96: Japan Minerals Market for Lithium Batteries Value (US$ Bn) Forecast, by Battery Type, 2022–2031
Table 97: Japan Minerals Market for Lithium Batteries Volume (Tons) Forecast, by End-use, 2022–2031
Table 98: Japan Minerals Market for Lithium Batteries Value (US$ Bn) Forecast, by End-use, 2022–2031
Table 99: India Minerals Market for Lithium Batteries Volume (Tons) Forecast, by Mineral, 2022–2031
Table 100: India Minerals Market for Lithium Batteries Value (US$ Bn) Forecast, by Mineral, 2022–2031
Table 101: India Minerals Market for Lithium Batteries Volume (Tons) Forecast, by Battery Type, 2022–2031
Table 102: India Minerals Market for Lithium Batteries Value (US$ Bn) Forecast, by Battery Type, 2022–2031
Table 103: India Minerals Market for Lithium Batteries Volume (Tons) Forecast, by End-use, 2022–2031
Table 104: India Minerals Market for Lithium Batteries Value (US$ Bn) Forecast, by End-use, 2022–2031
Table 105: India Minerals Market for Lithium Batteries Volume (Tons) Forecast, by End-use, 2022–2031
Table 106: India Minerals Market for Lithium Batteries Value (US$ Bn) Forecast, by End-use 2022–2031
Table 107: ASEAN Minerals Market for Lithium Batteries Volume (Tons) Forecast, by Mineral, 2022–2031
Table 108: ASEAN Minerals Market for Lithium Batteries Value (US$ Bn) Forecast, by Mineral, 2022–2031
Table 109: ASEAN Minerals Market for Lithium Batteries Volume (Tons) Forecast, by Battery Type, 2022–2031
Table 110: ASEAN Minerals Market for Lithium Batteries Value (US$ Bn) Forecast, by Battery Type, 2022–2031
Table 111: ASEAN Minerals Market for Lithium Batteries Volume (Tons) Forecast, by End-use, 2022–2031
Table 112: ASEAN Minerals Market for Lithium Batteries Value (US$ Bn) Forecast, by End-use, 2022–2031
Table 113: Rest of Asia Pacific Minerals Market for Lithium Batteries Volume (Tons) Forecast, by Mineral, 2022–2031
Table 114: Rest of Asia Pacific Minerals Market for Lithium Batteries Value (US$ Bn) Forecast, by Mineral, 2022–2031
Table 115: Rest of Asia Pacific Minerals Market for Lithium Batteries Volume (Tons) Forecast, by Battery Type, 2022–2031
Table 116: Rest of Asia Pacific Minerals Market for Lithium Batteries Value (US$ Bn) Forecast, by Battery Type, 2022–2031
Table 117: Rest of Asia Pacific Minerals Market for Lithium Batteries Volume (Tons) Forecast, by End-use, 2022–2031
Table 118: Rest of Asia Pacific Minerals Market for Lithium Batteries Value (US$ Bn) Forecast, by End-use, 2022–2031
Table 119: Latin America Minerals Market for Lithium Batteries Volume (Tons) Forecast, by Mineral, 2022–2031
Table 120: Latin America Minerals Market for Lithium Batteries Value (US$ Bn) Forecast, by Mineral, 2022–2031
Table 121: Latin America Minerals Market for Lithium Batteries Volume (Tons) Forecast, by Battery Type, 2022–2031
Table 122: Latin America Minerals Market for Lithium Batteries Value (US$ Bn) Forecast, by Battery Type, 2022–2031
Table 123: Latin America Minerals Market for Lithium Batteries Volume (Tons) Forecast, by End-use, 2022–2031
Table 124: Latin America Minerals Market for Lithium Batteries Value (US$ Bn) Forecast, by End-use, 2022–2031
Table 125: Latin America Minerals Market for Lithium Batteries Volume (Tons) Forecast, by Country and Sub-region, 2022–2031
Table 126: Latin America Minerals Market for Lithium Batteries Value (US$ Bn) Forecast, by Country and Sub-region, 2022–2031
Table 127: Brazil Minerals Market for Lithium Batteries Volume (Tons) Forecast, by Mineral, 2022–2031
Table 128: Brazil Minerals Market for Lithium Batteries Value (US$ Bn) Forecast, by Mineral, 2022–2031
Table 129: Brazil Minerals Market for Lithium Batteries Volume (Tons) Forecast, by Battery Type, 2022–2031
Table 130: Brazil Minerals Market for Lithium Batteries Value (US$ Bn) Forecast, by Battery Type, 2022–2031
Table 131: Brazil Minerals Market for Lithium Batteries Volume (Tons) Forecast, by End-use, 2022–2031
Table 132: Brazil Minerals Market for Lithium Batteries Value (US$ Bn) Forecast, by End-use, 2022–2031
Table 133: Mexico Minerals Market for Lithium Batteries Volume (Tons) Forecast, by Mineral, 2022–2031
Table 134: Mexico Minerals Market for Lithium Batteries Value (US$ Bn) Forecast, by Mineral, 2022–2031
Table 135: Mexico Minerals Market for Lithium Batteries Volume (Tons) Forecast, by Battery Type, 2022–2031
Table 136: Mexico Minerals Market for Lithium Batteries Value (US$ Bn) Forecast, by Battery Type, 2022–2031
Table 137: Mexico Minerals Market for Lithium Batteries Volume (Tons) Forecast, by End-use, 2022–2031
Table 138: Mexico Minerals Market for Lithium Batteries Value (US$ Bn) Forecast, by End-use, 2022–2031
Table 139: Rest of Latin America Minerals Market for Lithium Batteries Volume (Tons) Forecast, by Mineral, 2022–2031
Table 140: Rest of Latin America Minerals Market for Lithium Batteries Value (US$ Bn) Forecast, by Mineral, 2022–2031
Table 141: Rest of Latin America Minerals Market for Lithium Batteries Volume (Tons) Forecast, by Battery Type, 2022–2031
Table 142: Rest of Latin America Minerals Market for Lithium Batteries Value (US$ Bn) Forecast, by Battery Type, 2022–2031
Table 143: Rest of Latin America Minerals Market for Lithium Batteries Volume (Tons) Forecast, by End-use, 2022–2031
Table 144: Rest of Latin America Minerals Market for Lithium Batteries Value (US$ Bn) Forecast, by End-use, 2022–2031
Table 145: Middle East & Africa Minerals Market for Lithium Batteries Volume (Tons) Forecast, by Mineral, 2022–2031
Table 146: Middle East & Africa Minerals Market for Lithium Batteries Value (US$ Bn) Forecast, by Mineral, 2022–2031
Table 147: Middle East & Africa Minerals Market for Lithium Batteries Volume (Tons) Forecast, by Battery Type, 2022–2031
Table 148: Middle East & Africa Minerals Market for Lithium Batteries Value (US$ Bn) Forecast, by Battery Type, 2022–2031
Table 149: Middle East & Africa Minerals Market for Lithium Batteries Volume (Tons) Forecast, by End-use, 2022–2031
Table 150: Middle East & Africa Minerals Market for Lithium Batteries Value (US$ Bn) Forecast, by End-use, 2022–2031
Table 151: Middle East & Africa Minerals Market for Lithium Batteries Volume (Tons) Forecast, by Country and Sub-region, 2022–2031
Table 152: Middle East & Africa Minerals Market for Lithium Batteries Value (US$ Bn) Forecast, by Country and Sub-region, 2022–2031
Table 153: GCC Minerals Market for Lithium Batteries Volume (Tons) Forecast, by Mineral, 2022–2031
Table 154: GCC Minerals Market for Lithium Batteries Value (US$ Bn) Forecast, by Mineral, 2022–2031
Table 155: GCC Minerals Market for Lithium Batteries Volume (Tons) Forecast, by Battery Type, 2022–2031
Table 156: GCC Minerals Market for Lithium Batteries Value (US$ Bn) Forecast, by Battery Type, 2022–2031
Table 157: GCC Minerals Market for Lithium Batteries Volume (Tons) Forecast, by End-use, 2022–2031
Table 158: GCC Minerals Market for Lithium Batteries Value (US$ Bn) Forecast, by End-use, 2022–2031
Table 159: South Africa Minerals Market for Lithium Batteries Volume (Tons) Forecast, by Mineral, 2022–2031
Table 160: South Africa Minerals Market for Lithium Batteries Value (US$ Bn) Forecast, by Mineral, 2022–2031
Table 161: South Africa Minerals Market for Lithium Batteries Volume (Tons) Forecast, by Battery Type, 2022–2031
Table 162: South Africa Minerals Market for Lithium Batteries Value (US$ Bn) Forecast, by Battery Type, 2022–2031
Table 163: South Africa Minerals Market for Lithium Batteries Volume (Tons) Forecast, by End-use, 2022–2031
Table 164: South Africa Minerals Market for Lithium Batteries Value (US$ Bn) Forecast, by End-use, 2022–2031
Table 165: Rest of Middle East & Africa Minerals Market for Lithium Batteries Volume (Tons) Forecast, by Mineral, 2022–2031
Table 166: Rest of Middle East & Africa Minerals Market for Lithium Batteries Value (US$ Bn) Forecast, by Mineral, 2022–2031
Table 167: Rest of Middle East & Africa Minerals Market for Lithium Batteries Volume (Tons) Forecast, by Battery Type, 2022–2031
Table 168: Rest of Middle East & Africa Minerals Market for Lithium Batteries Value (US$ Bn) Forecast, by Battery Type, 2022–2031
Table 169: Rest of Middle East & Africa Minerals Market for Lithium Batteries Volume (Tons) Forecast, by End-use, 2022–2031
Table 170: Rest of Middle East & Africa Minerals Market for Lithium Batteries Value (US$ Bn) Forecast, by End-use, 2022–2031
List of Figures
Figure 1: Global Minerals Market for Lithium Batteries Volume Share Analysis, by Mineral, 2021, 2025, and 2031
Figure 2: Global Minerals Market for Lithium Batteries Attractiveness, by Mineral
Figure 3: Global Minerals Market for Lithium Batteries Volume Share Analysis, by Battery Type, 2021, 2025, and 2031
Figure 4: Global Minerals Market for Lithium Batteries Attractiveness, by Battery Type
Figure 5: Global Minerals Market for Lithium Batteries Volume Share Analysis, by End-use, 2021, 2025, and 2031
Figure 6: Global Minerals Market for Lithium Batteries Attractiveness, by End-use
Figure 7: Global Minerals Market for Lithium Batteries Volume Share Analysis, by Region, 2021, 2025, and 2031
Figure 8: Global Minerals Market for Lithium Batteries Attractiveness, by Region
Figure 9: North America Minerals Market for Lithium Batteries Volume Share Analysis, by Mineral, 2021, 2025, and 2031
Figure 10: North America Minerals Market for Lithium Batteries Attractiveness, by Mineral
Figure 11: North America Minerals Market for Lithium Batteries Attractiveness, by Mineral
Figure 12: North America Minerals Market for Lithium Batteries Volume Share Analysis, by Battery Type, 2021, 2025, and 2031
Figure 13: North America Minerals Market for Lithium Batteries Attractiveness, by Battery Type
Figure 14: North America Minerals Market for Lithium Batteries Volume Share Analysis, by End-use, 2021, 2025, and 2031
Figure 15: North America Minerals Market for Lithium Batteries Attractiveness, by End-use
Figure 16: North America Minerals Market for Lithium Batteries Attractiveness, by Country and Sub-region
Figure 17: Europe Minerals Market for Lithium Batteries Volume Share Analysis, by Mineral, 2021, 2025, and 2031
Figure 18: Europe Minerals Market for Lithium Batteries Attractiveness, by Mineral
Figure 19: Europe Minerals Market for Lithium Batteries Volume Share Analysis, by Battery Type, 2021, 2025, and 2031
Figure 20: Europe Minerals Market for Lithium Batteries Attractiveness, by Battery Type
Figure 21: Europe Minerals Market for Lithium Batteries Volume Share Analysis, by End-use, 2021, 2025, and 2031
Figure 22: Europe Minerals Market for Lithium Batteries Attractiveness, by End-use
Figure 23: Europe Minerals Market for Lithium Batteries Volume Share Analysis, by Country and Sub-region, 2021, 2025, and 2031
Figure 24: Europe Minerals Market for Lithium Batteries Attractiveness, by Country and Sub-region
Figure 25: Asia Pacific Minerals Market for Lithium Batteries Volume Share Analysis, by Mineral, 2021, 2025, and 2031
Figure 26: Asia Pacific Minerals Market for Lithium Batteries Attractiveness, by Mineral
Figure 27: Asia Pacific Minerals Market for Lithium Batteries Volume Share Analysis, by Battery Type, 2021, 2025, and 2031
Figure 28: Asia Pacific Minerals Market for Lithium Batteries Attractiveness, by Battery Type
Figure 29: Asia Pacific Minerals Market for Lithium Batteries Volume Share Analysis, by End-use, 2021, 2025, and 2031
Figure 30: Asia Pacific Minerals Market for Lithium Batteries Attractiveness, by End-use
Figure 31: Asia Pacific Minerals Market for Lithium Batteries Volume Share Analysis, by Country and Sub-region, 2021, 2025, and 2031
Figure 32: Asia Pacific Minerals Market for Lithium Batteries Attractiveness, by Country and Sub-region
Figure 33: Latin America Minerals Market for Lithium Batteries Volume Share Analysis, by Mineral, 2021, 2025, and 2031
Figure 34: Latin America Minerals Market for Lithium Batteries Attractiveness, by Mineral
Figure 35: Latin America Minerals Market for Lithium Batteries Volume Share Analysis, by Battery Type, 2021, 2025, and 2031
Figure 36: Latin America Minerals Market for Lithium Batteries Attractiveness, by Battery Type
Figure 37: Latin America Minerals Market for Lithium Batteries Volume Share Analysis, by End-use, 2021, 2025, and 2031
Figure 38: Latin America Minerals Market for Lithium Batteries Attractiveness, by End-use
Figure 39: Latin America Minerals Market for Lithium Batteries Volume Share Analysis, by Country and Sub-region, 2021, 2025, and 2031
Figure 40: Latin America Minerals Market for Lithium Batteries Attractiveness, by Country and Sub-region
Figure 41: Middle East & Africa Minerals Market for Lithium Batteries Volume Share Analysis, by Mineral, 2021, 2025, and 2031
Figure 42: Middle East & Africa Minerals Market for Lithium Batteries Attractiveness, by Mineral
Figure 43: Middle East & Africa Minerals Market for Lithium Batteries Volume Share Analysis, by Battery Type, 2021, 2025, and 2031
Figure 44: Middle East & Africa Minerals Market for Lithium Batteries Attractiveness, by Battery Type
Figure 45: Middle East & Africa Minerals Market for Lithium Batteries Volume Share Analysis, by End-use, 2021, 2025, and 2031
Figure 46: Middle East & Africa Minerals Market for Lithium Batteries Attractiveness, by End-use
Figure 47: Middle East & Africa Minerals Market for Lithium Batteries Volume Share Analysis, by Country and Sub-region, 2021, 2025, and 2031
Figure 48: Middle East & Africa Minerals Market for Lithium Batteries Attractiveness, by Country and Sub-region
Copyright © Transparency Market Research, Inc. All Rights reserved
Trust Online


Minerals Market for Lithium Batteries