
The data might not have been your first thought when states started legalizing recreational cannabis, but the legal market has drastically increased the amount of marijuana statistics out there. On top of the more academic surveys, it’s much easier to find out about how people use cannabis, what they prefer, why they do it and more.
RELATED: CBD Statistics and Facts
Marijuana Statistics
Here we’ve collected up-to-date marijuana statistics on everything from demographics, sales and projections through to the preferences and attitudes of people who use cannabis.
How Many Americans Smoke Marijuana?
The most basic statistics you can find about marijuana relate to how many people smoke it or use it, and while there is data going back much further than this, the past decade of data offers a comprehensive look at how many people are using cannabis both within the past year and within the past month.
There has been a consistent increase in the use of cannabis both in the past month and in the past year from 2012 to 2021.
- In 2012, 11.6% of US adults had used cannabis in the past year, while 7.1% had done so in the previous month.
- By 2021, this had increased to 16.9% of US adults using cannabis in the past year and 11.7% in the previous month, increasing by around 46% and 65% respectively.
This likely reflects the increasing acceptance of cannabis in society, with more and more people both having legal access and being less likely to harbor negative viewpoints about the plant.
What Are the Most Common Reasons for Using Cannabis?
With increasing numbers of people using cannabis, it’s natural to wonder what people give as their motivation for doing so. The top three reasons, given by over half of all respondents, are relaxation (67%), stress relief (62%) and to ease anxiety (54%), with smaller numbers reporting using weed to help with sleep quality (46%), pain (45%) and falling asleep (44%). Less common reasons include smoking for social reasons (34%), overall wellness (23%), for a medical condition (22%) and to enhance creativity (21%).
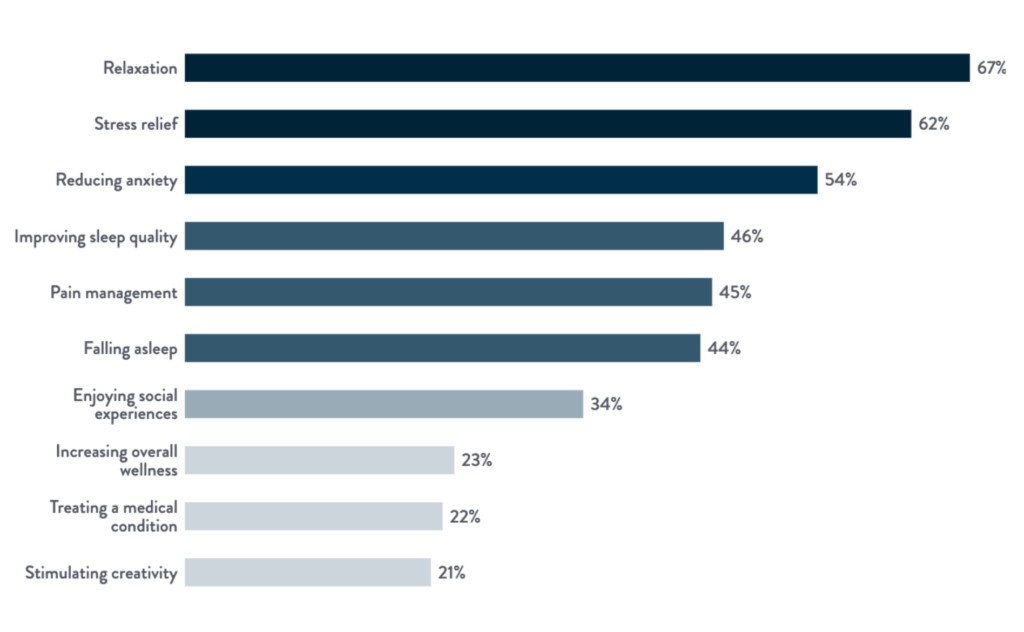
This won’t come as much of a surprise to people familiar with the effects of cannabis, but it’s interesting to note that relaxation-related reasons are clustered towards the top, likely because even people using for specific medical purposes will get these as a side benefit.
How Many High Schoolers Use Cannabis?
While the industry is focused on adult consumers who could legally buy their products, an understandable concern is the level of youth use of cannabis. The Monitoring the Future survey has been tracking youth drug use since the mid-70s, and their most recent data on marijuana gives a comprehensive look at the number of 8th, 10th and 12th graders who use cannabis. Both the past year and past month use statistics to paint an interesting picture of what’s happened between 2011 and 2020 (the most recent survey at the time of writing).
| School Grade | Cannabis Use |
|---|---|
| 8th graders | 11.4% |
| 10th graders | 28% |
| 12th graders | 35.2% |
Throughout the surveys – and across basically every substance covered – use rates increase with age. So the 12th graders use cannabis more than the 10th graders and they use it more than the 8th graders. For instance, in 2020, 11.4% of 8th graders, 28% of 10th graders and 35.2% of 12th graders had used cannabis in the past year, and 6.5%, 16.6% and 21.1% had used it over the past month, respectively. However, in every age group, there has been a decline in use between 2011 and 2020. For example, past year use among 8th graders declined from 12.5% to 11.4% over the time period, and past month use among 12th graders decreased from 22.6% to 21.1%.
Demographics of Cannabis Users
Although we have a detailed post on the demographics of cannabis users, which is also worth checking out if you want a little more data on the topic and a source that looks at the numbers in a different way, it’s worth taking a brief look at demographics here too for a broader understanding of who uses cannabis.
Do Men or Women Use Cannabis More?
Based on New Frontier’s survey of 4,601 cannabis consumers in September 2020, there is a roughly even split of cannabis use by gender, with 51% male and 49% female consumers. Traditionally, there was a gender imbalance in which men used more cannabis than women overall, and in some other data this does appear to persist. For example, in a study of consumers in Washington, taken from in-store loyalty programs and conducted in 2019, men were over-represented in every generation group, making up from 60% of sales (for Baby Boomers) up to 67% (for Millennials).
Overall, it seems that the New Frontier survey skews towards women more than most other surveys, with the 2019 National Survey on Drug Use and Health (NSDUH), for example, showing that 21.2% of men aged 18 or over had used cannabis in the last year compared to 15% of women. There are similar differences in the NSDUH when looking at past month or lifetime use. Of course, this result is outdated now, and in any case the gender imbalance is decreasing with time.
How Do Cannabis Users Breakdown by Age?
The age breakdown for cannabis users (based on the New Frontier data) shows a clear peak between 25 and 44, with less use in other age brackets. Specifically, around 4% of users are 18 to 20, 7% are 21 to 24, 26% are between 25 and 34 and 22% are between 35 and 44. For older people, 16% are 45 to 54, 16% are 55 to 64 and the remaining 10% are 65 or older.
| Age | Cannabis Use |
|---|---|
| 18-20 | 4% |
| 21-24 | 7% |
| 25-34 | 26% |
| 35-44 | 22% |
| 45-54 | 16% |
| 55-64 | 16% |
| 65 or older | 10% |
Overall this is somewhat expected, with younger adults using cannabis more frequently than older adults, but the youngest adults (with less spending power) are perhaps less represented than you would assume based on age alone. This result agrees with Headset’s data too, in which Millennials and Gen Xers are the biggest consumers.
How Do Cannabis Users Breakdown by Race?
The racial breakdown of cannabis users based on the New Frontier data roughly corresponds to the racial breakdown of the US (based on Census Bureau estimates), with some over and under-representations but no major surprises.
Firstly, 72% of cannabis consumers are white, while in the overall population white (not including dual heritage, Hispanic or Latino) people make up 60.1% of the population. Black Americans account for 11% of cannabis users, while making up 13.4% of the population overall. Hispanic or Latino people make up 11% of cannabis users but 18.5% of the US population. Asian people make up 3% of cannabis users and 5.9% of the population. Other races, including natives of America, Alaska, Hawaii and Pacific Islands, account for 3% of cannabis users and 1.5% of the population.
| Race | Cannabis Use |
|---|---|
| White | 72% |
| Black American | 11% |
| Hispanic or Latino | 11% |
| Asian | 3% |
| Other races | 3% |
Although the New Frontier data doesn’t address this point, Headset’s analysis also shows that people of two or more races are the most likely to use cannabis, with 30.5% of people in this group using pot, compared to 20.4% for American or Alaskan Natives, 20% for Black or African Americans and 18.9% for non-Hispanic white people, for instance. Note that this is the amount of people from within the racial group who use cannabis, not the amount of people who use cannabis falling into these racial groups (which is the case with the New Frontier data).
What is the Relationship Status of Cannabis Users?
The New Frontier data also includes detailed information on the relationship statuses of the people who use cannabis. People who are married or in a relationship account for 58% of cannabis users, single people make up 29%, 10% are divorced and 3% are widowed.
| Relationship Status | Cannabis Use |
|---|---|
| Married or in a relationship | 58% |
| Single | 29% |
| Divorced | 10% |
| Widowed | 3% |
What is the Income Level of Cannabis Users?
Cannabis users tend to cluster around lower income levels, with people making between $25k and $50k per year accounting for a quarter of all users. People earning under $25k account for 19%, and those earning between $50k and $75k are another 19%. Around 12% earn from $75k to $100k and another 12% earn from $100k to $150k. Higher earners are much rarer, with 7% earning between $150k and $200k and 5% earning more than this.
| Income Level | Cannabis Use |
|---|---|
| Under $25k | 19% |
| $25k-$50k | 25% |
| $50k-$75k | 19% |
| $75k-$100k | 12% |
| $100k-$150k | 12% |
| $150k-$200k | 7% |
| Above $200k | 5% |
What is the Education Level of Cannabis Users?
People who’ve completed some college account for the majority of cannabis users, at 36% of users. The next most represented group is people with a bachelor’s degree, who make up 28% of users. Those with graduate degrees account for 18% of cannabis users, and finally those who finished education with high school are the remaining 16%.
| Education Level | Cannabis Use |
|---|---|
| High school diploma | 16% |
| Some college | 36% |
| Bachelor’s degree | 28% |
| Graduate degree | 18% |
This is another area where the results likely challenge some assumptions: for instance, people with advanced degrees are more likely to use weed than those who stopped at high school.
Who Do Cannabis Users Support Politically?
Although you may assume that cannabis users would be heavily skewed to the left, in fact less than 50% identify as liberal. Overall there are 22% who say they’re moderately liberal, 21% who are strongly liberal, 19% who are moderately conservative and 10% who are strongly conservative. A huge 23% are independents, and 5% are non-political. This really underlines the wide popularity of cannabis as a substance – we’re far past the days of weed being a left-wing vice.
| Political Party | Cannabis Use |
|---|---|
| Moderately liberal | 22% |
| Strongly liberal | 21% |
| Moderately conservative | 19% |
| Strongly conservative | 10% |
| Independent | 23% |
| Non-political | 5% |
Cannabis Consumer Habits and the Industry
If you’re running a dispensary or other cannabis-related business, there are many statistics on cannabis use that offer valuable insights into how consumers behave and the future for the industry as a whole.
Where Do People Buy Weed?
With the changing landscape for cannabis, the days of most purchases being made on some shady street corner are definitively on their way out. But how do people buy weed in 2021, and how has this changed over the last few years? New Frontier’s 2021 Cannabis Consumer Evolution report lists the sources that people had used in both 2018 and 2021 that makes this shift clear.
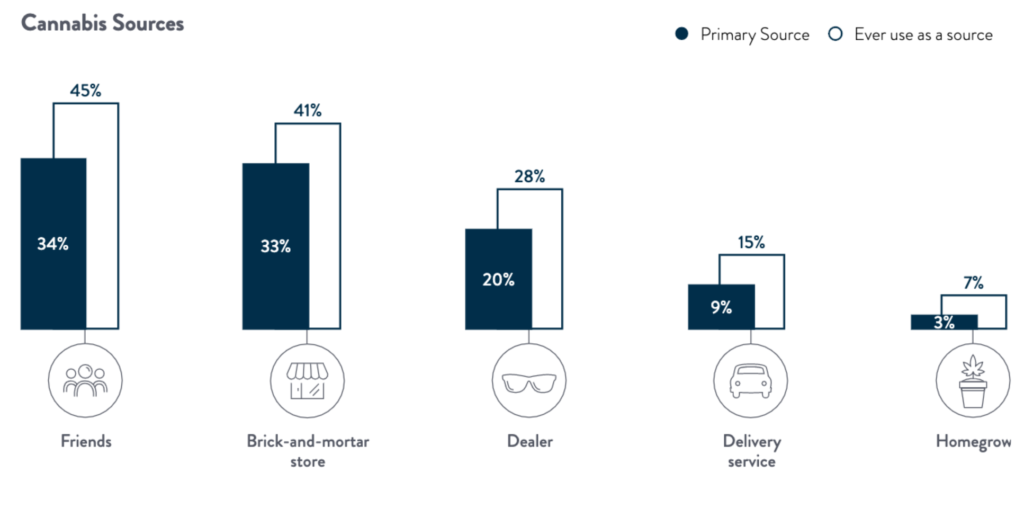
From 2018 to 2021, the number of cannabis consumers across the US that got weed from friends decreased from 51 to 45%, the number using dealers declined from 36 to 28% and the number growing at home decreased from 9 to 7%. These shifts have been accompanied by increases in the number of consumers sourcing from official channels, including a rise from 27 to 41% for people using brick-and-mortar dispensaries and an increase from 8 to 15% for people using home delivery services.
| Source | 2018 | 2021 | Change |
|---|---|---|---|
| Friends | 51% | 45% | Down 11% |
| Dealer | 36% | 28% | Down 22% |
| Homegrow | 9% | 7% | Down 22% |
| Retail | 27% | 41% | Up 51% |
| Delivery | 8% | 15% | Up 87% |
Cannabis Source by State Market Type
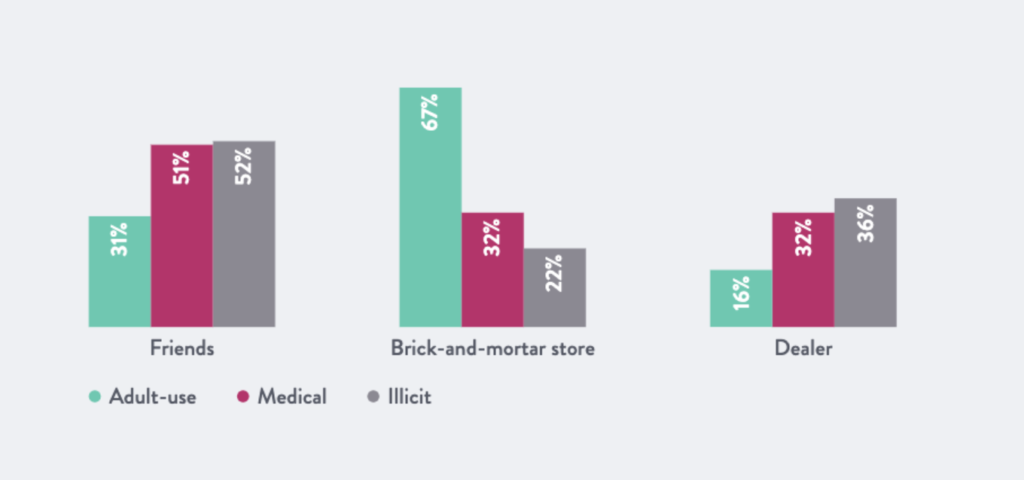
This clearly shows the impact of legalization, and the breakdown in terms of the laws of the individuals’ home states underlines the key point. For tokers in legal states, 67% use dispensaries, making it the most popular source by far (with just 16% using dealers), whereas in states with a completely illicit supply, 52% get weed from friends and 36% use a dealer.
| Source | Adult-use | Medical | Illicit |
|---|---|---|---|
| Friends | 31% | 51% | 52% |
| Dealer | 16% | 32% | 36% |
| Retail | 67% | 32% | 22% |
What Types of Cannabis Do People Use?
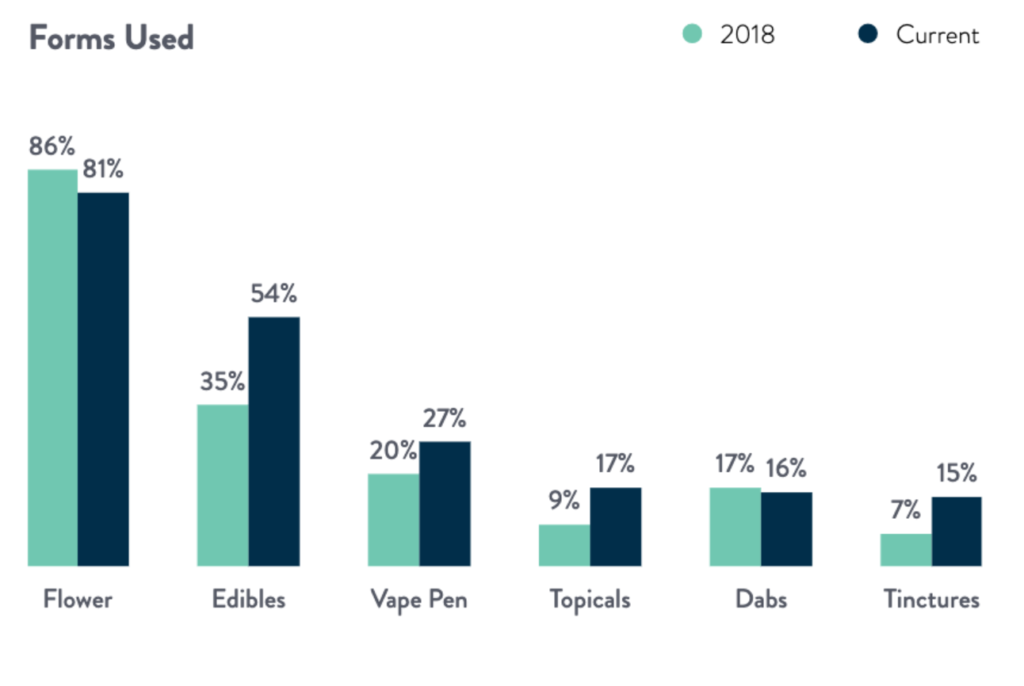
Another aspect of weed that has opened up with the increasing liberalization of cannabis law is the availability of alternative forms to simple flower. The shift in use of non-flower types of weed in the previous three years has moved in a direction you may expect as different options become more easily accessible.
Flower is still the dominant form of cannabis used, with 81% of weed users opting for it in 2021 (down from 86% in 2018), followed by edibles, which saw a huge increase from 35 to 54% of users between 2018 and 2021. Vape pens are also increasing in popularity, rising from 20 to 27% of users, along with topicals, which went from 9 to 17% of users, and tinctures, which went from 7 to 15% of users. Dabs have remained pretty consistent, at 17% in 2018 and 16% in 2021.
Forms of cannabis other than flower are generally more common in legal states and for younger consumers.
How Often Do People Consume Cannabis?
Despite increasing understanding of cannabis and its use, many people still hold onto the idea that people who use pot are useless stoners who sit around all day smoking and lazing on the couch. But the data on how often cannabis users consume throws up a huge roadblock for these assumptions, showing that relatively few consumers (including those who use for medical reasons) use weed more than once per day, and this has been trending downwards.
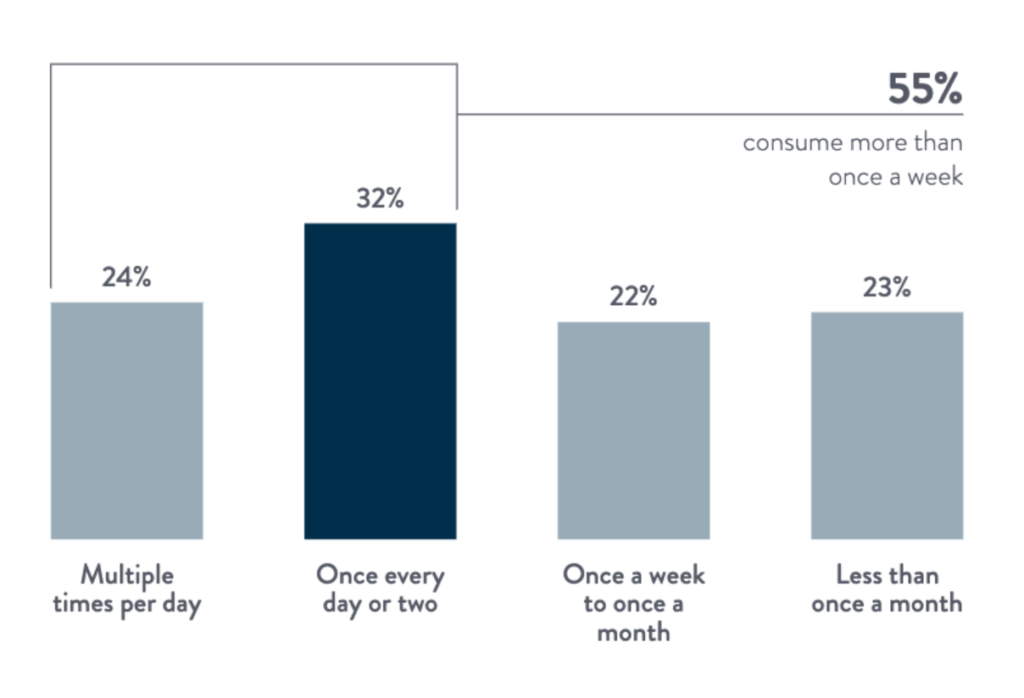
From 2018 to 2021, the number of cannabis consumers who use weed more than once per day has decreased from 30 to 24%. The number using once every day or two has stayed relatively consistent at 33 and 32%, while occasional use (from once a week to once a month) has risen from 18 to 22% of consumers. Finally, the number using cannabis less than once a month has increased from 20 to 23%. So overall, 76% of users consume just once per day or less. And of course even in the other cases, the “lazy stoner” stereotype is – like most stereotypes – a gross oversimplification at very best.
How Often Do Cannabis Consumers Make Purchases?
Although cannabis users generally partake between once a day and once a week, that doesn’t mean that’s how often they need to pick up some bud, and if you’re running a store this is the information you really need. Only 18% of cannabis consumers make a purchase more than once a week, with 29% buying every one to two weeks. The most common frequency is buying weed once every month or two, and 22% of consumers only buy a couple of times per year.
| Purchase Frequency | Cannabis Use |
|---|---|
| More than once a week | 18% |
| A couple times a month – once a week | 29% |
| Every month or two | 31% |
| A couple times a year or less | 22% |
This is quite an even distribution, but it’s clear that broadly, consumers choose to make fewer purchases in larger amounts than smaller purchases more frequently.
How Much Do Cannabis Consumers Spend Per Visit?
When a customer walks into a dispensary or goes to buy cannabis from any type of seller, how much do they typically spend?
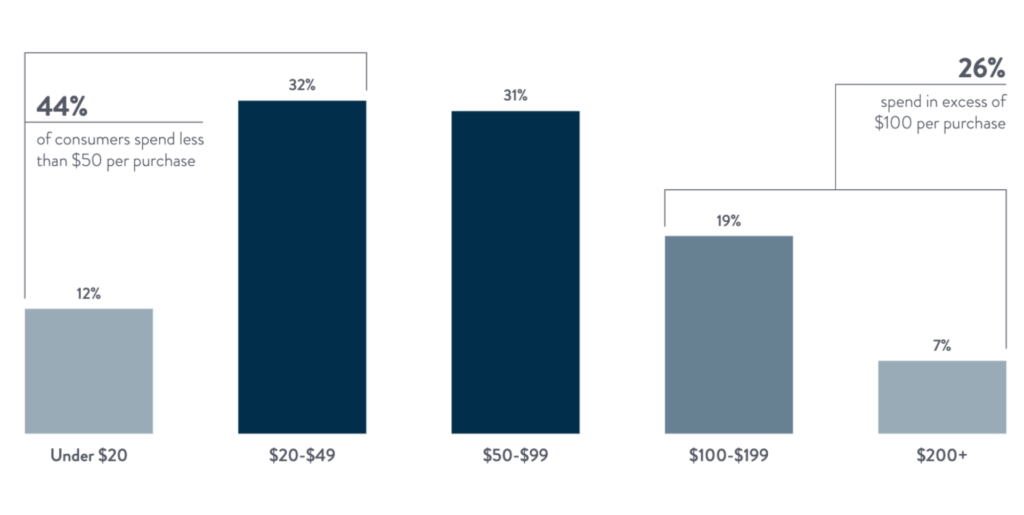
New Frontier’s data shows that most consumers (32%) spend between $20 and $49 per visit, with another 31% spending $50 to $99 each time. Huge purchases are rarer, with 19% spending between $100 and $199 per visit, and 7% spending $200 or more each time. On the lower end, 12% have an average spend of less than $20.
Which Days of the Week Are Best for Weed Sales?
Based on data from across the US, Friday is the biggest day for pot purchases, accounting for around 18.9% of stores’ income. Thursday and Saturday are the next most popular days, both accounting for around 15.2% of the earnings for a store. Sunday has the lowest sales, making up for 10.5% of sales, and this increases through the week up to Thursday when the pattern repeats.
| Day of the Week | Cannabis Use |
|---|---|
| Monday | 12.6% |
| Tuesday | 13.2% |
| Wednesday | 14.3% |
| Thursday | 15.2% |
| Friday | 18.9% |
| Saturday | 15.2% |
| Sunday | 10.5% |
How Loyal Are Customers for Cannabis Businesses?
Of the consumers who buy from brick-and-mortar dispensaries or use delivery services, the data generally shows that they are loyal to their preferred sellers. In fact, 54% always purchase from the same business, and another 32% usually do so. The remaining 14% change businesses regularly, but the overall picture is clear: if you offer good service and a good product, most of your customers will keep coming back.
- Always purchase from the same business: 54%
- Usually purchase from the same business: 32%
- Purchase from different businesses: 14%
Which Types of Cannabis Make Up the Most Legal Sales?
Although the picture (expectedly) mirrors the types of cannabis most consumers use, there is more detailed data based on purchases made from legal suppliers for each category, running from 2018 to 2021 (first quarter) in the New Frontier Data.
| Product Category | Legal Sales |
|---|---|
| Flower | 43% |
| Vapes | 27% |
| Edibles | 11% |
| Extracts | 10% |
| Prerolls | 6% |
| Tinctures | 2% |
| Topicals | 1% |
Flower is the largest category, consistently at around 43% of sales. The next most popular is vaping products, making up between 25 and 29% of sales through the included period. Extracts and edibles both hover around 10% of sales, and other categories account for between 3 and 5% of sales. Overall, the majority of the money still comes from flower, but vapes in particular are an important area for cannabis stores.
Which States Sell the Most Cannabis?
With increasing numbers of legal states, cannabis sales are growing nationwide, with some states standing out from the crowd in terms of volume. New Frontier has arranged the sales data into a top 10 in terms of revenue for 2020, with California leading the pack with a massive $4.98 billion in sales, Colorado following with $2.16 billion and then Washington with $1.34 billion. The remaining states all have around $1 billion, with Oklahoma at the bottom of the pack with $0.78 billion in sales.
| State | Legal Cannabis Sales |
|---|---|
| California | $4.98 billion |
| Colorado | $2.16 billion |
| Washington | $1.34 billion |
| Arizona | $1.14 billion |
| Florida | $1.1 billion |
| Illinois | $1.05 billion |
| Michigan | $1.03 billion |
| Massachusetts | $1 billion |
| Oregon | $920 million |
| Oklahoma | $780 million |
What Are the Projections for the Industry in the Future?
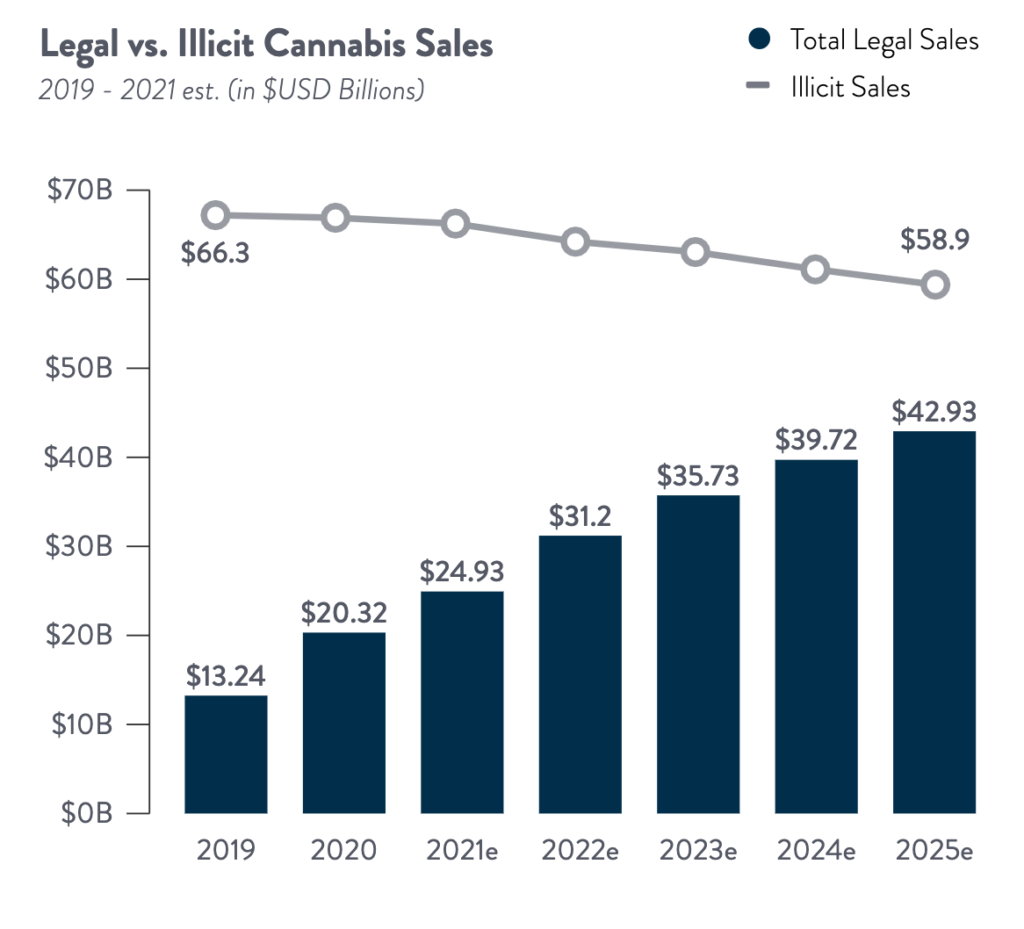
The cannabis industry has been booming, and all projections indicate that it will continue to grow in the future as well. Based on New Frontier data, and estimates from 2021 onwards, the industry looks set to reach revenue of $42.9 billion by 2025. The change from 2019 to 2020 was substantial, with $13.2 billion in 2019 rising to $20.3 billion. The increase from 2020 to 2022 is expected to be rapid, reaching $24.9 billion in 2021 and $31.2 billion in 2022, with the increase expected to slow a little afterwards.
The majority of this growth comes from recreational sales, but the medical market will continue to increase as well. In 2019, the medical market was at $5.9 billion and the recreational market was at $7.4 billion, while by 2025 it’s projected to be $15.5 billion medical and $27.4 billion for recreational. The compound annual growth rates are 11% for legal medical sales and 20% for legal adult use sales, working out to 16% overall for legal sales.
Alongside this, the illicit market is set to shrink from $66.3 billion in 2019 to $58.9 billion in 2025, but it will remain substantially larger than the legal market.
Projected Growth by Product Category
While overall growth for the industry provides a picture of the overall spend on cannabis products over the coming years, the changing behavior of cannabis consumers isn’t fully captured by this alone. Breaking down the projected growth by product type – flower, vapes, edibles, prerolls, concentrates, tinctures, beverages, topicals and capsules – gives a clearer picture of how things are going to evolve. Headset’s market projections allow us to do just this up to the end of 2022.
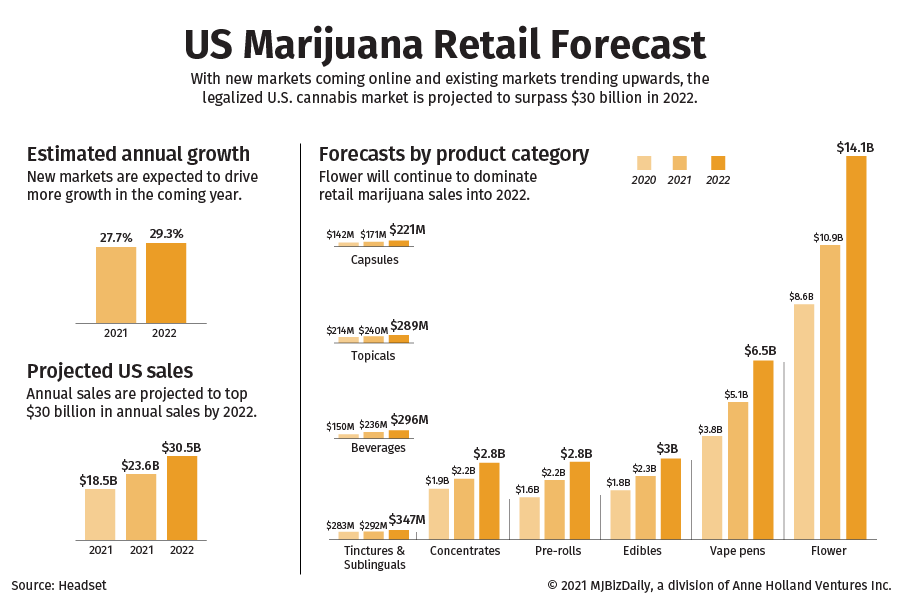
Flower is set to remain the dominant form of cannabis in terms of raw sales, rising from $8.6 billion in 2020 to $14.1 billion by 2022. Vape pens are set to grow substantially too, rising from $3.8 to $6.5 billion from 2020 to 2022, and edibles are projected to go from $1.8 to $3 billion in sales over the same period. Both prerolls and concentrates will reach $2.8 billion in sales by 2022, with prerolls growing slightly more compared to 2022. The other categories have less sales overall, but beverages will increase substantially, from $150 million in sales in 2020 to $296 million in 2022.
Global Projected Growth of Legal and Illicit Market
In North America, the legal cannabis market is substantially bigger than in the rest of the world, but to get a global picture we can still compare the legal and illicit markets around the world.
For the legal market, North America is projected to grow from $22.9 billion in 2020 to a huge $49 billion in 2025, but the rest of the world’s figures are better measured in millions (sticking to USD for easy comparison). Europe is the next-largest market, projected to rise from $351.2 million in 2020 to $863.1 million in 2025, followed by Asia, with a value of $158.9 million in 2020, set to rise to $327.5 million in 2025. The Caribbean also has a large legal market (especially considering its relative size), at $158.2 million in 2020 projected to grow to $326.6 million by 2025. Huge growth is projected in Oceania, where the market stood at $89.6 million in 2020 but is projected to reach $456.8 million in 2025. Finally, the Latin American legal market was valued at $7.3 million in 2020 and is set to rise to $44.8 million in 2025. There is no legal market in Africa.
| Legal Cannabis Market | 2020 | 2025 (Projected) |
|---|---|---|
| North America | $22.9 billion | $49 billion |
| Europe | $351.2 million | $863.1 million |
| Asia | $158.9 million | $327.5 million |
| Caribbean | $158.2 million | $326.6 million |
| Oceania | $89.6 million | $456.8 million |
| Latin America | $7.3 million | $44.8 million |
The illicit markets are a better indicator for most other regions, though. In North America this was still substantial, at $69.8 billion in 2020 and projected to shrink to $59.5 billion by 2025. Everywhere else, the illicit market will increase. The next-biggest is Asia, valued at $185.9 billion in 2020 and rising to $220.6 billion in 2025, followed by Europe, projected to go from $79.1 to $97.6 billion over the same period. Africa had illicit sales totaling $33.1 billion in 2020 and is set to rise to $39.4 by 2025, with Latin America rising from $12.8 to $15.5 billion in the same time. The smaller markets are Oceania, at $9.2 billion in 2020 and projected to reach $11 billion by 2025, and the Caribbean, going from $1.4 to $1.6 billion by 2025.
| Illicit Cannabis Market | 2020 | 2025 (Projected) |
|---|---|---|
| North America | $69.8 billion | $59.5 billion |
| Asian | $185.9 billion | $220.6 billion |
| Europe | $79.1 billion | $97.6 billion |
| Africa | $33.1 billion | $39.4 billion |
| Latin America | $12.8 billion | $15.5 billion |
| Oceania | $9.2 billion | $11 billion |
| Caribbean | $1.4 billion | $1.6 billion |
Really, the most striking thing about these figures is how the illicit market is only projected to shrink in North America, where legalized adult use of cannabis is funneling that same money into legitimate businesses and governments, rather than street-corner dealers.
Viewpoints and Attitudes Towards Cannabis
While behavior is more practically useful for businesses trying to understand cannabis consumers, more social issues like laws and general viewpoints are crucial for the development of the industry and understanding how things are going to progress more broadly. As well as people’s views on legalization, reasons for using cannabis and attitudes in comparison to things like alcohol gives an important insight into the evolving views on weed.
What Do Americans Think About Marijuana Legalization?
Legalization has been a big issue long before states started to make the change from 2012 onwards, and there have been tons of surveys asking people’s views on the issue. In 2010, 52% of Americans were against it, but around 2012 to 2013, there was a shift, and since then, more people have been supportive of legalization than against it. By November 2019, 67% supported legalization and 32% opposed it.
Traditionally, Democrats have been more in favor of legalization than Republicans, but the 2019 survey when broken down by party affiliation shows that 55% of Republicans are pro-legalization, with 44% against it. Democrats are stronger on the issue – 76% in favor and just 20% against – but the fact that supporters of both major parties are in favor shows how far things have come in a relatively short space of time.
Do People Think It’s Immoral to Smoke Cannabis?
Although there is an unavoidable overlap between things people see as immoral and things they think should be illegal, the issues are slightly different and it helps put the level of support for cannabis use into context. There are many issues we can compare based on data from New Frontier, including many controversial topics such as abortion or the death penalty, but also more everyday and broadly accepted ones like using birth control or drinking alcohol.
Overall, 70% of those surveyed said that smoking weed was morally acceptable, with 28% saying it was morally wrong and the remaining 2% either being undecided or saying it wasn’t a moral issue. In comparison, for example, 86% say that drinking alcohol is morally acceptable, 72% say unmarried sex is acceptable, 66% say gay or lesbian relationships are acceptable, 44% say abortion is acceptable and 18% say suicide is acceptable. Broadly speaking, people don’t see cannabis as immoral, but it isn’t exactly accepted in the same way as alcohol.
Do People Think Cannabis is Dangerous?
Despite some disagreement on the legal and moral issues surrounding cannabis, people generally don’t see it as especially dangerous, particularly in comparison to things like cigarettes or alcohol. The data (from a Politico/Harvard P.H. Chan School of Public Health survey) shows that 81% say that cigarettes are very harmful, 51% say alcohol is, 47% say e-cigarettes are and just 26% say the same about cannabis. There isn’t much variation based on political viewpoint, either, with the only major difference being that Republicans are less likely than Democrats to say alcohol is very harmful, although 46% still say that it is.
Do Cannabis Users Prefer Cannabis or Alcohol?
One other question that comes up in a legal state is whether people will be less likely or less inclined to drink alcohol. While the data suggests that most cannabis users also drink alcohol fairly regularly, there is a general preference for cannabis among people who use it. Overall, 30% of cannabis users said they prefer alcohol, 26% like both equally and 44% prefer cannabis.
This overall pattern persists if you break the responses down by age (18 to 34, 35 to 54 or 55 and older), although the older group are more likely to say they like both equally and the youngest group has a stronger preference for cannabis than other groups, with 50% saying they prefer it to alcohol.
Conclusion – What Can We Learn About Cannabis From Statistics?
This post has collected a lot of data surrounding cannabis, but there is a danger of missing the forest for the trees. While you can nit-pick and comb through specific pieces of data for express purposes, the overall picture from the data is a consistent one.
After decades of Reefer Madness style propaganda, the US is undergoing a dramatic change in attitudes towards the most popular, previously-illicit drug out there. Legalization was once a talking-point for only the more extreme liberal voices in politics, but now it’s so normalized that even a majority of Republicans support it. Using drugs at all was once seen as immoral, but now people are increasingly recognizing the similarity between casual drinking and casual marijuana use. And using something like CBD as medicine was once seen as the domain of alternative medicine peddlers, but as we look at the data with increasingly open minds, people begin to see the promise in the cannabinoid.
So yes, we can marvel at the promise of the industry and develop complex pictures of the “average” cannabis user, but the most important thing to take from the abundance of data is that cannabis use is becoming more “average” than ever. Weed has hit the mainstream, and it isn’t going anywhere.
References
- Headset (2020) The Demographics of Cannabis Consumers, Available at: https://www.headset.io/industry-reports/cannabis-demographic-analysis-trends
- Headset (2021) Cannabis Market Projections for US & Canada: April 2021, Available at: https://www.headset.io/industry-reports/cannabis-market-projections-for-us-canada-april-2021
- Hasse, J., (2021) US Hemp CBD Market To Hit $5.3B In Sales In 2021, Driven By Drinks, Gummies And Charlotte’s Web. Available at: https://markets.businessinsider.com/news/stocks/us-hemp-cbd-market-to-hit-5-3b-in-sales-in-2021-driven-by-drinks-gummies-and-charlotte-s-web-1030468542
- Johnston, L. D., Miech, R. A., O’Malley, P. M., Bachman, J. G., Schulenberg, J. E., & Patrick, M. E. (2021) Monitoring the Future National Survey Results on Drug Use, 1975-2020: Overview, Key Findings on Adolescent Drug Use. Available at: http://monitoringthefuture.org/pubs.html
- New Frontier Data (2021) The Global Cannabis Report: Growth and Trends Through 2025
- New Frontier Data (2021) Cannabis in the U.S.: 2021 Mid-Year Market Update
- New Frontier Data (2021) 2021 U.S. Cannabis Consumer Evolution: Archetypes, Preferences and Behaviors, Available at: https://newfrontierdata.com/product/the-2021-cannabis-consumer-evolution/
- New Frontier Data (2020) The U.S. Cannabis Report: 2020-2021 Industry Outlook
- New Frontier Data (2020) U.S. CBD Consumer Report: Archetypes and Preferencess
- Politico/Harvard T.H. Chan School of Public Health (2019) Americans’ Views on Data Privacy & E-Cigarettes, Results at: https://www.marijuanamoment.net/americans-view-marijuana-as-far-less-harmful-than-alcohol-and-tobacco-survey-finds/
- Substance Abuse and Mental Health Services Administration. (2020). Key Substance Use and Mental Health Indicators in the United States: Results from the 2019 National Survey on Drug Use and Health, Available at: https://www.samhsa.gov/data/
- The United States Census Bureau (2021) Quick Facts https://www.census.gov/quickfacts/fact/table/US/PST045219