Colibrí Google Analytics Tableau Dashboards
Colibrí Google Analytics Tableau Dashboards and data pipes. Colibri is 44 Tableau Dashboards. The largest Google Analytics Dashboard on Tableau Public. Built by our senior tableau consultant and free for all.


Research Google Analytics data faster!
Colibrí Google Analytics Tableau Dashboards is an end to end solution available to everyone. Explore the Google Analytics Dashboards on Tableau Public. Study your end users behavior with 44 Tableau Dashboards using the Tableau . Use Colibrí to research your end user website patterns to help you better understand your Google Analytics Properties.
DATA PIPELINE
Contact us and we will send you two free KNIME workflows you can use to start pulling data from one or many Google Analytics Properties. Or our team can assist your team with setting up the data process on your local computer, on a server, or server-less. Let us know how we can help you setup your data engineering environment.


Authenticate
Colibrí Google Analytics Tableau Dashboards uses the google analytics api on Google Cloud Platform.
- google cloud user
- google analytics api
- service account email
- p12 certificate
Measures
timeOnPage – Time (in seconds) users spent on a particular page, calculated by the subtracting the initial view time for particular page from the initial view time for a subsequent page. This metric does not apply to exit pages of property.
uniquePageviews – Unique Pageviews is the number of sessions during which the specified page was viewed at least once. A unique pageview is counted for each page URL + page title combination.
sessionDuration – Total duration (in seconds) of users’ sessions.
sessions – The total number of sessions.
pageDownloadTime – The total time (in milliseconds) to download this page among all samples.
redirectionTime – The total time (in milliseconds) all samples spent in redirects before fetching this page. If there are no redirects, this is 0.
timeOnScreen – The time spent viewing the current screen.
pageLoadTime – Total time (in milliseconds), from pageview initiation (e.g., a click on a page link) to page load completion in the browser, the pages in the sample set take to load.
users – The total number of users for the requested time period.
Dimensions
date – A date of the session formatted as YYYYMMDD.
city – Users’ city, derived from their IP addresses or Geographical IDs.
country – Users’ country, derived from their IP addresses or Geographical IDs.
source – The source of referrals. If users arrived without a referrer, its value is (direct).
fullReferrer – The full referring URL including the hostname and path.
userType – A boolean, either New Visitors or Returning Visitors, indicating if the users are new or returning.
language – The language, in ISO-639 code format (e.g., en-gb for British english), provided by the HTTP Request for the browser.
website – A list of websites, view multiple websites or 1 google analytics tracked website.
(future colibrí google analytics tableau dashboards will have more dimension options via the google analytics api)
WIREFRAME
We use figma to help us document, design, and collaborate with teams when building tableau dashboards. To learn more about the wireframe we used to help us build Colibrí Google Analytics Tableau Dashboard, download the files.
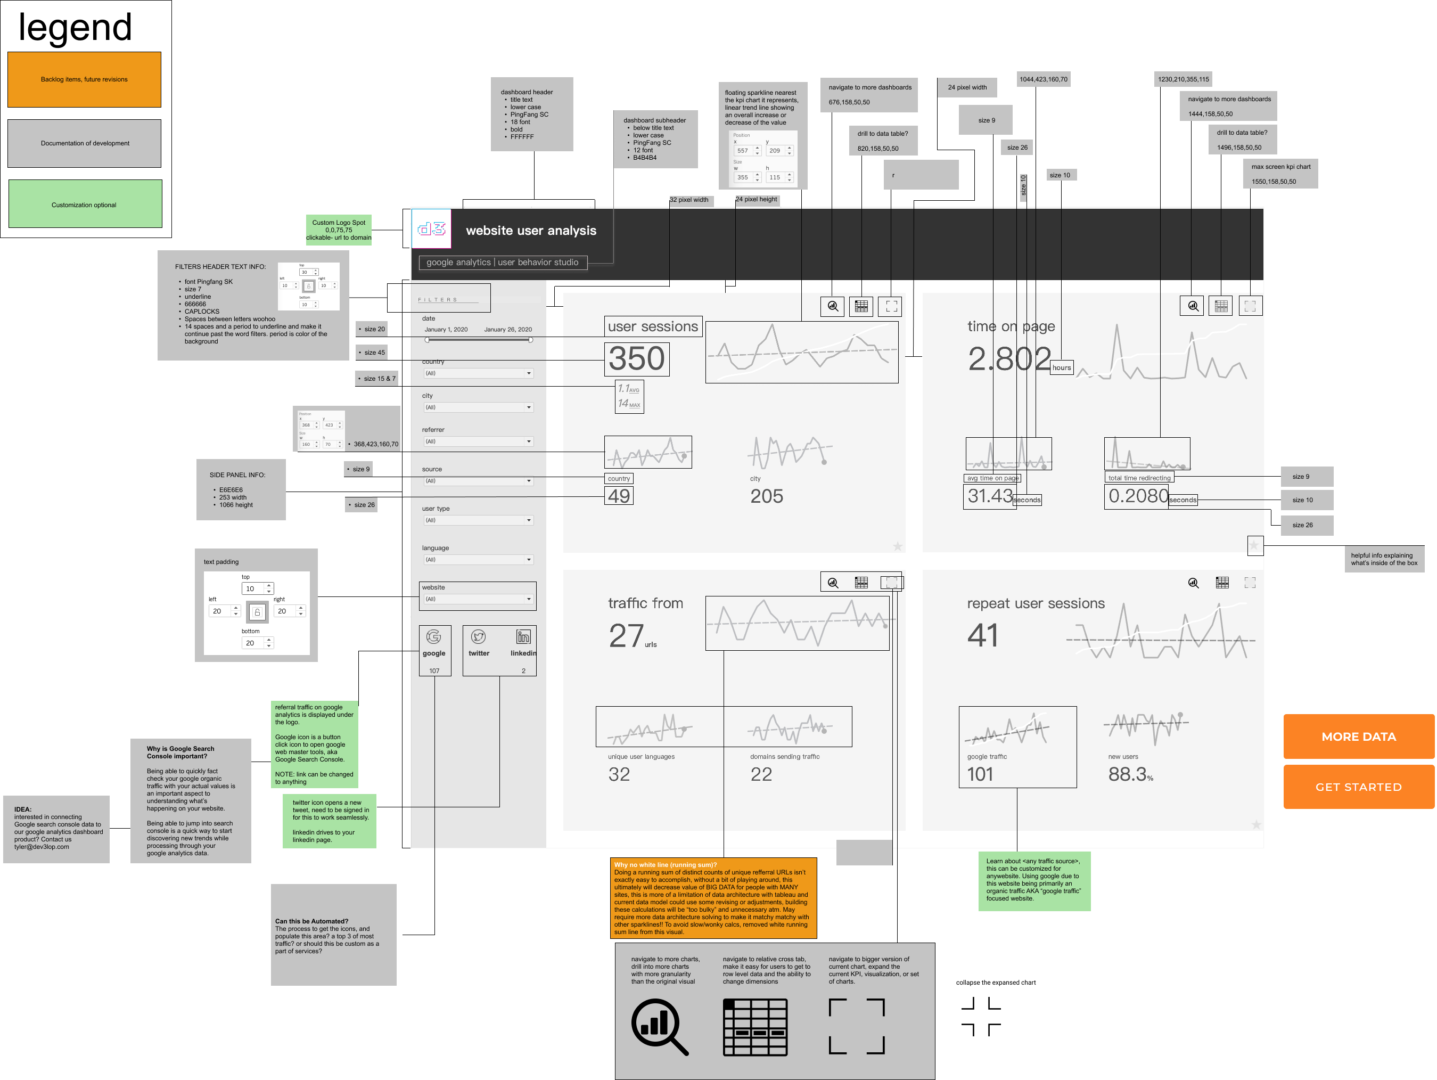
Filters
Parameters
Pre-built parameters utilized to improve UX and optimization.
Navigation
Seamlessly navigate with buttons like a modern app. Modern UX.
Backend
- Google Analytics API
- KNIME
Frontend
- Tableau Desktop 1600 x 1200
- 44 dashboard
- 1 table
- 17 columns
- and much more.
No expenses
50,000 – 30 days = 49,970
Colibrí?
Nightly Refresh?
Use Canopys Task Scheduler to start your ETL; extract from a source, transform, and load to Tableau.
In progress
- Add 1 new column.
- Serverless app.
44 Tableau Dashboards
Learn more about our Google Analytics Tableau Dashboards by clicking the following links:
KPIs
- total user sessions
- unique count of countries visiting
- unique count of cities visiting
- user time on page
- average user time on page
- total time redirecting
- unique count of URLs visiting
- unique languages visiting
- unique count of domains visiting
- returning user sessions
- returning organic traffic
- percent of users returning
- social media scorecard
- time on page by city trend
- time on page by city actuals
- time on page by country trend
- time on page by country actuals
- map view of time on page
- popular referral traffic
Download Colibri Google Analytics Tableau Dashboard to learn more.

Tyler from Dev3lop provided strong technical expertise during our time working with Lever, a recruiting software company. He was a pivotal team member by showcasing his expert-level SQL, Tableau, and analytical thought-leadership. His easy-going attitude made it very enjoyable to work along. The resulting dashboard project was a game-changer for our organization. I highly recommend Tyler and Dev3lop!