
Analysts’ Viewpoint on Shared Mobility Market Scenario
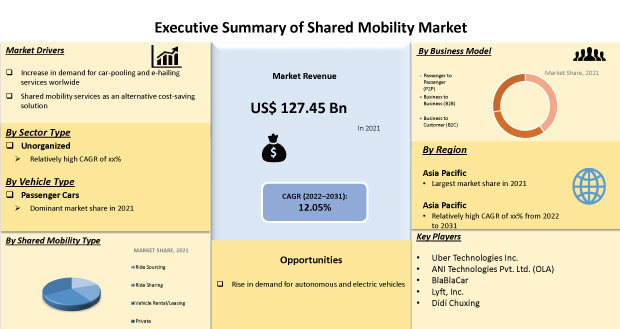
Shared mobility is a transportation service wherein a vehicle is shared among users, based on distance, time, and money. These vehicles are either shared simultaneously or individually. Rise in preference for car-pooling and e-hailing across the globe is driving the global shared mobility market. Expanding economies including China and India are witnessing a surge in their population, which in turn has fueled the demand for ride sourcing, ride sharing, and vehicle rental or leasing. Increase in preference for shared mobility, in order to reduce vehicle ownership, and rise in congestion in public transport are expected to fuel the market. Moreover, surge in production of electric vehicles and significant investments in R&D in autonomous vehicles are also expected to propel the global shared mobility market during the forecast period.
Shared mobility services include micro mobility such as scooter and bike sharing; public transport; automobile-based transport such as car sharing and rides on demand; and commute-based ridesharing such as carpooling and vanpooling. In shared mobility, vehicle owners and fleet operators provide a vehicle on rental basis to various consumers and corporate companies. Increase in adoption of smartphones has provided several options for mobility and further optimized routes for travelers. Use of various technologies in the transportation sector, such as telematics and V2X (Vehicle-to-Everything), is expected to further boost preference for shared mobility over private vehicles.
Rapid urbanization and rise in awareness about effective planning and settlement of urban areas are expected to fuel the demand for shared mobility. Additionally, concerns related to pollution, depletion of energy reserves, and growing economic, environmental, and energy crisis are further boosting the requirement for sustainable, alternative, and shared mobility solutions, such as car-pooling and e-hailing.
Request a sample to get extensive insights into the Shared Mobility Market
Car-pooling and e-hailing services provide a platform, in order to book a transport service such as cars, bikes, scooters, or buses, with the help of mobile applications. Vehicles booked from these platforms are private vehicles that are used to offer public transport services for passengers and fleet operators. Moreover, the car-pooling and e-hailing aggregator provides access to drivers and customers, which guides them with passenger pick-up and drop locations, payment options, and travel routes, among others.
Shared mobility trends have also prompted some automotive OEMs to develop in-house services for car and ride-sharing and further provide their own vehicles for car-sharing fleets at lower prices. However, the COVID-19 pandemic hampered the car-sharing business, as the public is not preferring car-sharing in order to avoid the spread of the Coronavirus. On the other hand, preference for car-pooling and e-hailing has increased, which in turn drives the demand for mobility services and contributes to the growth of the shared mobility market size.
Shared mobility services offer numerous transportation, social, and environmental related benefits, which reduce vehicle ownership, vehicle use, and vehicle driven per miles/kilometers. Shared mobility has also extended the public transit area, potentially bridging the gaps between transportation networks and further addressing the issue related to transit access. Shared mobility solutions are cost-saving and more convenient, as they reduce operational cost and also create accessible transport connections for passengers.
Incorporation of shared electric mobility and autonomous vehicles is anticipated to decline the cost of shared mobility vehicles. Furthermore, electric vehicles reduce fuel expenses and costs, which further declines the overall cost of shared mobility, such as the cost of ride-sourcing and ride-sharing. Therefore, an increase in adoption of alternative fuel vehicles is likely to boost on-demand vehicle services globally.
The future of shared mobility is in the hands of autonomous vehicles, as they eliminate the cost of the driver and other vehicle expenses. Several investors are also focusing on the e-hailing business due to a rise in the demand for autonomous shared vehicles, including shuttles and robo-taxis. Such investors are waiting for OEMs to commercialize autonomous vehicle driving technology, as it requires lower operating costs as compared to other driver-based services. However, rising trend of autonomous shared mobility is expected to propel the shared mobility market.
In terms of shared mobility type, the shared mobility market has been classified into ride sourcing, ride sharing, vehicle rental/leasing, and private. The private segment held the highest share of the global shared mobility market in 2021, owing to a rise in usage of private vehicles in car-pooling and e-hailing. Increase in vehicle ownership, rapid urbanization, and rise in congestion are fuelling the adoption of private vehicles for car-pooling and e-hailing. Moreover, vehicle rental or leasing services are used extensively by several companies, as they are willing to offer transportation services for their employees. Furthermore, outings with friends, long family tours, and increased tourism activities across the globe are driving the vehicle rental/leasing demand. Lack of connectivity and increased crowd in public transportation are fueling the demand for ride sharing and ride sourcing services.
In terms of sector type, the global shared mobility market has been bifurcated into unorganized and organized sector types. The unorganized sector segment held a major share of the global market in 2021, due to more number of non-internet based and local taxi fleet operators and service providers. Lack of awareness among passengers and the absence of car-pooling service companies across several countries are driving the unorganized services segment. On the other hand, increase in demand for car-pooling and e-hailing across the world is boosting the organized sector and consequently, driving the shared mobility market.
Regional analysis of the shared mobility market is based on automotive manufacturers, venture-backed startups for car-pooling and e-hailing, car and bike rental companies, and city-sponsored programs to reduce traffic congestions. The shared mobility market in Asia Pacific region expanded at a notable growth rate, in terms of revenue, in 2021. Ride sharing and ride sourcing services are popular across China, India, and ASEAN countries, which boost the market in the region. Service providers in Asia Pacific, including OLA, UBER, Grab SG and DIDI Chuxing, hold a major share of the shared mobility market. Moreover, rising urban population, increasing working-class consumers, and heavy crowded public transports are some of the key factors that boost the demand for shared mobility solutions. Furthermore, rise in number of daily commuters across the region and decrease in number of vehicles per thousand people are also key factors driving the shared mobility market.
Implementation of vehicle emission norms, tax benefits, and subsidies offered by governments and surge in fuel prices across Asia Pacific have increased the adoption of electric vehicles in the region. Thus, rise in adoption of EVs is expected to propel the shared mobility market.
The global shared mobility market is split with several number of manufacturers controlling major market share, with key companies holding the potential to boost the pace of expansion by adopting newer and advanced technologies and by making consistent changes in their shared mobility services. However, mergers and acquisitions and the development of services portfolio are major strategies that are adopted by key players.
Business models of shared mobility companies are changing consistently. Some startups in car and bike sharing have folded, while others became multimodal services providers, and changes have been rapid in public-private partnerships and service offerings. Key players operating in the global shared mobility market include Uber Technologies Inc., BlaBlaCar, ANI Technologies Pvt. Ltd. (OLA), Wingz, Inc., Lyft, Inc., Grab SG, Taxify OÜ, Avis Budget Group, Inc., Europcar, Curb Mobility, Careem, The Hertz Corporation, Enterprise Holdings, Inc., and Beijing Xiaoju Technology Co, Ltd. (Didi Chuxing).
Request a custom report on Shared Mobility Market
In June 2022, Uber Technologies Inc. announced the launch of UberX Share, which offers shared rides across the cities of New York, San Francisco, Chicago, Los Angeles, Portland, Phoenix, Pittsburgh, San Diego, and Indianapolis, in the U.S. The company plans to expand UberX Share, which enables riders to share a ride, get savings, stay on schedule, and make a sustainable choice.
In June 2022, IFC, a private sector arm of the World Bank Group, signed an agreement with BlaBlaCar to invest around US$ 15 Mn, in order to support shared mobility platform growth across Brazil and further boost the access to environmental-friendly, convenient, and affordable travel.
Each of these players has been profiled in the shared mobility market report based on parameters such as company overview, financial overview, business strategies, product portfolio, business segments, and recent developments.
|
Attribute |
Detail |
|
Market Size Value in 2021 |
US$ 127.45 Bn |
|
Market Forecast Value in 2031 |
US$ 397.61 Bn |
|
Growth Rate (CAGR) |
12.05% |
|
Forecast Period |
2022–2031 |
|
Historical Data Available for |
2017–2021 |
|
Quantitative Units |
US$ Bn for Value and Thousand Units for Volume |
|
Market Analysis |
It includes cross segment analysis at global as well as regional level. Furthermore, qualitative analysis includes drivers, restraints, opportunities, key trends, Porter’s Five Forces analysis, value chain analysis, and key trend analysis. |
|
Competition Landscape |
|
|
Format |
Electronic (PDF) + Excel |
|
Market Segmentation |
|
|
Regions Covered |
|
|
Countries Covered |
|
|
Companies Profiled |
|
|
Customization Scope |
Available upon request |
|
Pricing |
Available upon request |
The global shared mobility market was valued at US$ 127.45 Bn in 2021
The global shared mobility market is expected to advance at a CAGR of 12.05% by 2031
The global shared mobility market is expected to reach US$ 397.61 Bn in 2031
Increase in production of electric vehicles and rise in development of autonomous vehicles
The private segment accounts for 43.8% share of the global shared mobility market
Asia Pacific is the most lucrative region of the global shared mobility market
Uber Technologies Inc., ANI Technologies Pvt. Ltd. (OLA), BlaBlaCar, Lyft, Inc., Wingz, Inc., Grab SG, Taxify OÜ, Avis Budget Group, Inc., Europcar, Curb Mobility, Careem, The Hertz Corporation, Enterprise Holdings, Inc., and Beijing Xiaoju Technology Co, Ltd. (Didi Chuxing)
1. Preface
1.1. About TMR
1.2. Market Coverage / Taxonomy
1.3. Assumptions and Research Methodology
2. Executive Summary
2.1. Global Market Outlook
2.1.1. Market Size, Units, US$ Bn, 2017‒2031
2.2. Demand & Supply Side Trends
2.3. TMR Analysis and Recommendations
2.4. Competitive Dashboard Analysis
3. Market Overview
3.1. Macro-Economic Factors
3.2. Market Dynamics
3.2.1. Drivers
3.2.2. Restraints
3.2.3. Opportunity
3.3. Market Factor Analysis
3.3.1. Porter’s Five Force Analysis
3.3.2. SWOT Analysis
3.4. Regulatory Scenario
3.5. Key Trend Analysis
3.6. Value Chain Analysis
3.7. Cost Structure Analysis
3.8. Profit Margin Analysis
4. COVID-19 Impact Analysis – Shared Mobility Market
5. Global Shared Mobility Market, by Sector Type
5.1. Market Snapshot
5.1.1. Introduction, Definition, and Key Findings
5.1.2. Market Growth & Y-o-Y Projections
5.1.3. Base Point Share Analysis
5.2. Global Shared Mobility Market Value (US$ Bn) & Volume (Thousand Units) Analysis & Forecast, by Sector Type, 2017‒2031
5.2.1. Unorganized
5.2.2. Organized
6. Global Shared Mobility Market, by Shared Mobility Type
6.1. Market Snapshot
6.1.1. Introduction, Definition, and Key Findings
6.1.2. Market Growth & Y-o-Y Projections
6.1.3. Base Point Share Analysis
6.2. Global Shared Mobility Market Value (US$ Bn) & Volume (Thousand Units) Analysis & Forecast, by Shared Mobility Type, 2017‒2031
6.2.1. Ride Sourcing
6.2.2. Ride Sharing
6.2.3. Vehicle Rental/Leasing
6.2.4. Private
7. Global Shared Mobility Market, by Business Model
7.1. Market Snapshot
7.1.1. Introduction, Definition, and Key Findings
7.1.2. Market Growth & Y-o-Y Projections
7.1.3. Base Point Share Analysis
7.2. Global Shared Mobility Market Value (US$ Bn) & Volume (Thousand Units) Analysis & Forecast, by Business Model, 2017‒2031
7.2.1. Passenger to Passenger (P2P)
7.2.2. Business to Business (B2B)
7.2.3. Business to Customer (B2C)
8. Global Shared Mobility Market, by Vehicle Type
8.1. Market Snapshot
8.1.1. Introduction, Definition, and Key Findings
8.1.2. Market Growth & Y-o-Y Projections
8.1.3. Base Point Share Analysis
8.2. Global Shared Mobility Market Value (US$ Bn) & Volume (Thousand Units) Analysis & Forecast, by Vehicle Type, 2017‒2031
8.2.1. Passenger Cars
8.2.2. Light Commercial Vehicles
8.2.3. Buses & Coaches
8.2.4. Micro Mobility
9. Global Shared Mobility Market, by Propulsion
9.1. Market Snapshot
9.1.1. Introduction, Definition, and Key Findings
9.1.2. Market Growth & Y-o-Y Projections
9.1.3. Base Point Share Analysis
9.2. Global Shared Mobility Market Value (US$ Bn) & Volume (Thousand Units) Analysis & Forecast, by Propulsion, 2017‒2031
9.2.1. IC Engine Vehicles
9.2.1.1. Gasoline/Petrol
9.2.1.2. Diesel
9.2.2. Electric Vehicles
9.2.2.1. Battery Electric Vehicles (BEV)
9.2.2.2. Plug-in Hybrid Electric Vehicles (PHEV)
10. Global Shared Mobility Market, by Region
10.1. Market Snapshot
10.1.1. Introduction, Definition, and Key Findings
10.1.2. Market Growth & Y-o-Y Projections
10.1.3. Base Point Share Analysis
10.2. Global Shared Mobility Market Value (US$ Bn) & Volume (Thousand Units) Analysis & Forecast, 2017‒2031, by Region
10.2.1. North America
10.2.2. Europe
10.2.3. Asia Pacific
10.2.4. Middle East & Africa
10.2.5. South America
11. North America Shared Mobility Market
11.1. Market Snapshot
11.2. Shared Mobility Market Value (US$ Bn) & Volume (Thousand Units) Analysis & Forecast, by Sector Type, 2017‒2031
11.2.1. Unorganized
11.2.2. Organized
11.3. Shared Mobility Market Value (US$ Bn) & Volume (Thousand Units) Analysis & Forecast, by Shared Mobility Type, 2017‒2031
11.3.1. Ride Sourcing
11.3.2. Ride Sharing
11.3.3. Vehicle Rental/Leasing
11.3.4. Private
11.4. Shared Mobility Market Value (US$ Bn) & Volume (Thousand Units) Analysis & Forecast, by Business Model, 2017‒2031
11.4.1. Passenger to Passenger (P2P)
11.4.2. Business to Business (B2B)
11.4.3. Business to Customer (B2C)
11.5. Shared Mobility Market Value (US$ Bn) & Volume (Thousand Units) Analysis & Forecast, by Vehicle Type, 2017‒2031
11.5.1. Passenger Cars
11.5.2. Light Commercial Vehicles
11.5.3. Buses & Coaches
11.5.4. Micro mobility
11.6. Shared Mobility Market Value (US$ Bn) & Volume (Thousand Units) Analysis & Forecast, by Propulsion, 2017‒2031
11.6.1. IC Engine Vehicles
11.6.1.1. Gasoline/Petrol
11.6.1.2. Diesel
11.6.2. Electric Vehicles
11.6.2.1. Battery Electric Vehicles (BEV)
11.6.2.2. Plug-in Hybrid Electric Vehicles (PHEV)
11.7. Key Country Analysis – North America Shared Mobility Market Value (US$ Bn) & Volume (Thousand Units) Analysis & Forecast, 2017‒2031
11.7.1. U. S.
11.7.2. Canada
11.7.3. Mexico
12. Europe Shared Mobility Market
12.1. Market Snapshot
12.2. Shared Mobility Market Value (US$ Bn) & Volume (Thousand Units) Analysis & Forecast, by Sector Type, 2017‒2031
12.2.1. Unorganized
12.2.2. Organized
12.3. Shared Mobility Market Value (US$ Bn) & Volume (Thousand Units) Analysis & Forecast, by Shared Mobility Type, 2017‒2031
12.3.1. Ride Sourcing
12.3.2. Ride Sharing
12.3.3. Vehicle Rental/Leasing
12.3.4. Private
12.4. Shared Mobility Market Value (US$ Bn) & Volume (Thousand Units) Analysis & Forecast, by Business Model, 2017‒2031
12.4.1. Passenger to Passenger (P2P)
12.4.2. Business to Business (B2B)
12.4.3. Business to Customer (B2C)
12.5. Shared Mobility Market Value (US$ Bn) & Volume (Thousand Units) Analysis & Forecast, by Vehicle Type, 2017‒2031
12.5.1. Passenger Cars
12.5.2. Light Commercial Vehicles
12.5.3. Buses & Coaches
12.5.4. Micro mobility
12.6. Shared Mobility Market Value (US$ Bn) & Volume (Thousand Units) Analysis & Forecast, by Propulsion, 2017‒2031
12.6.1. IC Engine Vehicles
12.6.1.1. Gasoline/Petrol
12.6.1.2. Diesel
12.6.2. Electric Vehicles
12.6.2.1. Battery Electric Vehicles (BEV)
12.6.2.2. Plug-in Hybrid Electric Vehicles (PHEV)
12.7. Key Country Analysis – Europe Shared Mobility Market Value (US$ Bn) & Volume (Thousand Units) Analysis & Forecast, 2017‒2031
12.7.1. Germany
12.7.2. U. K.
12.7.3. France
12.7.4. Italy
12.7.5. Spain
12.7.6. Nordic Countries
12.7.7. Russia & CIS
12.7.8. Rest of Europe
13. Asia Pacific Shared Mobility Market
13.1. Market Snapshot
13.2. Shared Mobility Market Value (US$ Bn) & Volume (Thousand Units) Analysis & Forecast, by Sector Type, 2017‒2031
13.2.1. Unorganized
13.2.2. Organized
13.3. Shared Mobility Market Value (US$ Bn) & Volume (Thousand Units) Analysis & Forecast, by Shared Mobility Type, 2017‒2031
13.3.1. Ride Sourcing
13.3.2. Ride Sharing
13.3.3. Vehicle Rental/Leasing
13.3.4. Private
13.4. Shared Mobility Market Value (US$ Bn) & Volume (Thousand Units) Analysis & Forecast, by Business Model, 2017‒2031
13.4.1. Passenger to Passenger (P2P)
13.4.2. Business to Business (B2B)
13.4.3. Business to Customer (B2C)
13.5. Shared Mobility Market Value (US$ Bn) & Volume (Thousand Units) Analysis & Forecast, by Vehicle Type, 2017‒2031
13.5.1. Passenger Cars
13.5.2. Light Commercial Vehicles
13.5.3. Buses & Coaches
13.5.4. Micro mobility
13.6. Shared Mobility Market Value (US$ Bn) & Volume (Thousand Units) Analysis & Forecast, by Propulsion, 2017‒2031
13.6.1. IC Engine Vehicles
13.6.1.1. Gasoline/Petrol
13.6.1.2. Diesel
13.6.2. Electric Vehicles
13.6.2.1. Battery Electric Vehicles (BEV)
13.6.2.2. Plug-in Hybrid Electric Vehicles (PHEV)
13.7. Key Country Analysis – Asia Pacific Shared Mobility Market Value (US$ Bn) & Volume (Thousand Units) Analysis & Forecast, 2017‒2031
13.7.1. China
13.7.2. India
13.7.3. Japan
13.7.4. ASEAN Countries
13.7.5. South Korea
13.7.6. ANZ
13.7.7. Rest of Asia Pacific
14. Middle East & Africa Shared Mobility Market
14.1. Market Snapshot
14.2. Shared Mobility Market Value (US$ Bn) & Volume (Thousand Units) Analysis & Forecast, by Sector Type, 2017‒2031
14.2.1. Unorganized
14.2.2. Organized
14.3. Shared Mobility Market Value (US$ Bn) & Volume (Thousand Units) Analysis & Forecast, by Shared Mobility Type, 2017‒2031
14.3.1. Ride Sourcing
14.3.2. Ride Sharing
14.3.3. Vehicle Rental/Leasing
14.3.4. Private
14.4. Shared Mobility Market Value (US$ Bn) & Volume (Thousand Units) Analysis & Forecast, by Business Model, 2017‒2031
14.4.1. Passenger to Passenger (P2P)
14.4.2. Business to Business (B2B)
14.4.3. Business to Customer (B2C)
14.5. Shared Mobility Market Value (US$ Bn) & Volume (Thousand Units) Analysis & Forecast, by Vehicle Type, 2017‒2031
14.5.1. Passenger Cars
14.5.2. Light Commercial Vehicles
14.5.3. Buses & Coaches
14.5.4. Micro mobility
14.6. Shared Mobility Market Value (US$ Bn) & Volume (Thousand Units) Analysis & Forecast, by Propulsion, 2017‒2031
14.6.1. IC Engine Vehicles
14.6.1.1. Gasoline/Petrol
14.6.1.2. Diesel
14.6.2. Electric Vehicles
14.6.2.1. Battery Electric Vehicles (BEV)
14.6.2.2. Plug-in Hybrid Electric Vehicles (PHEV)
14.7. Key Country Analysis – Middle East & Africa Shared Mobility Market Value (US$ Bn) & Volume (Thousand Units) Analysis & Forecast, 2017‒2031
14.7.1. GCC
14.7.2. South Africa
14.7.3. Turkey
14.7.4. Rest of Middle East & Africa
15. South America Shared Mobility Market
15.1. Market Snapshot
15.2. Shared Mobility Market Value (US$ Bn) & Volume (Thousand Units) Analysis & Forecast, by Sector Type, 2017‒2031
15.2.1. Unorganized
15.2.2. Organized
15.3. Shared Mobility Market Value (US$ Bn) & Volume (Thousand Units) Analysis & Forecast, by Shared Mobility Type, 2017‒2031
15.3.1. Ride Sourcing
15.3.2. Ride Sharing
15.3.3. Vehicle Rental/Leasing
15.3.4. Private
15.4. Shared Mobility Market Value (US$ Bn) & Volume (Thousand Units) Analysis & Forecast, by Business Model, 2017‒2031
15.4.1. Passenger to Passenger (P2P)
15.4.2. Business to Business (B2B)
15.4.3. Business to Customer (B2C)
15.5. Shared Mobility Market Value (US$ Bn) & Volume (Thousand Units) Analysis & Forecast, by Vehicle Type, 2017‒2031
15.5.1. Passenger Cars
15.5.2. Light Commercial Vehicles
15.5.3. Buses & Coaches
15.5.4. Micro mobility
15.6. Shared Mobility Market Value (US$ Bn) & Volume (Thousand Units) Analysis & Forecast, by Propulsion, 2017‒2031
15.6.1. IC Engine Vehicles
15.6.1.1. Gasoline/Petrol
15.6.1.2. Diesel
15.6.2. Electric Vehicles
15.6.2.1. Battery Electric Vehicles (BEV)
15.6.2.2. Plug-in Hybrid Electric Vehicles (PHEV)
15.7. Key Country Analysis – South America Shared Mobility Market Value (US$ Bn) & Volume (Thousand Units) Analysis & Forecast, 2017‒2031
15.7.1. Brazil
15.7.2. Argentina
15.7.3. Rest of South America
16. Competitive Landscape
16.1. Company Share Analysis/ Brand Share Analysis, 2020
16.2. Company Analysis for each player (Company Overview, Company Footprints, Production Locations, Product Portfolio, Competitors & Customers, Subsidiaries & Parent Organization, Recent Developments, Financial Analysis, Profitability, Revenue Share, Executive Bios)
16.3. Company Profile/ Key Players – Shared Mobility Market
16.3.1. Uber Technologies Inc.
16.3.1.1. Company Overview
16.3.1.2. Company Footprints
16.3.1.3. Production Locations
16.3.1.4. Product Portfolio
16.3.1.5. Competitors & Customers
16.3.1.6. Subsidiaries & Parent Organization
16.3.1.7. Recent Developments
16.3.1.8. Financial Analysis
16.3.1.9. Profitability
16.3.1.10. Revenue Share
16.3.1.11. Executive Bios
16.3.2. ANI Technologies Pvt. Ltd. (OLA)
16.3.2.1. Company Overview
16.3.2.2. Company Footprints
16.3.2.3. Production Locations
16.3.2.4. Product Portfolio
16.3.2.5. Competitors & Customers
16.3.2.6. Subsidiaries & Parent Organization
16.3.2.7. Recent Developments
16.3.2.8. Financial Analysis
16.3.2.9. Profitability
16.3.2.10. Revenue Share
16.3.2.11. Executive Bios
16.3.3. BlaBlaCar
16.3.3.1. Company Overview
16.3.3.2. Company Footprints
16.3.3.3. Production Locations
16.3.3.4. Product Portfolio
16.3.3.5. Competitors & Customers
16.3.3.6. Subsidiaries & Parent Organization
16.3.3.7. Recent Developments
16.3.3.8. Financial Analysis
16.3.3.9. Profitability
16.3.3.10. Revenue Share
16.3.3.11. Executive Bios
16.3.4. Lyft, Inc.
16.3.4.1. Company Overview
16.3.4.2. Company Footprints
16.3.4.3. Production Locations
16.3.4.4. Product Portfolio
16.3.4.5. Competitors & Customers
16.3.4.6. Subsidiaries & Parent Organization
16.3.4.7. Recent Developments
16.3.4.8. Financial Analysis
16.3.4.9. Profitability
16.3.4.10. Revenue Share
16.3.4.11. Executive Bios
16.3.5. Wingz, Inc.
16.3.5.1. Company Overview
16.3.5.2. Company Footprints
16.3.5.3. Production Locations
16.3.5.4. Product Portfolio
16.3.5.5. Competitors & Customers
16.3.5.6. Subsidiaries & Parent Organization
16.3.5.7. Recent Developments
16.3.5.8. Financial Analysis
16.3.5.9. Profitability
16.3.5.10. Revenue Share
16.3.5.11. Executive Bios
16.3.6. Grab SG
16.3.6.1. Company Overview
16.3.6.2. Company Footprints
16.3.6.3. Production Locations
16.3.6.4. Product Portfolio
16.3.6.5. Competitors & Customers
16.3.6.6. Subsidiaries & Parent Organization
16.3.6.7. Recent Developments
16.3.6.8. Financial Analysis
16.3.6.9. Profitability
16.3.6.10. Revenue Share
16.3.6.11. Executive Bios
16.3.7. Taxify OÜ
16.3.7.1. Company Overview
16.3.7.2. Company Footprints
16.3.7.3. Production Locations
16.3.7.4. Product Portfolio
16.3.7.5. Competitors & Customers
16.3.7.6. Subsidiaries & Parent Organization
16.3.7.7. Recent Developments
16.3.7.8. Financial Analysis
16.3.7.9. Profitability
16.3.7.10. Revenue Share
16.3.7.11. Executive Bios
16.3.8. Avis Budget Group, Inc.
16.3.8.1. Company Overview
16.3.8.2. Company Footprints
16.3.8.3. Production Locations
16.3.8.4. Product Portfolio
16.3.8.5. Competitors & Customers
16.3.8.6. Subsidiaries & Parent Organization
16.3.8.7. Recent Developments
16.3.8.8. Financial Analysis
16.3.8.9. Profitability
16.3.8.10. Revenue Share
16.3.8.11. Executive Bios
16.3.9. Europcar
16.3.9.1. Company Overview
16.3.9.2. Company Footprints
16.3.9.3. Production Locations
16.3.9.4. Product Portfolio
16.3.9.5. Competitors & Customers
16.3.9.6. Subsidiaries & Parent Organization
16.3.9.7. Recent Developments
16.3.9.8. Financial Analysis
16.3.9.9. Profitability
16.3.9.10. Revenue Share
16.3.9.11. Executive Bios
16.3.10. Curb Mobility
16.3.10.1. Company Overview
16.3.10.2. Company Footprints
16.3.10.3. Production Locations
16.3.10.4. Product Portfolio
16.3.10.5. Competitors & Customers
16.3.10.6. Subsidiaries & Parent Organization
16.3.10.7. Recent Developments
16.3.10.8. Financial Analysis
16.3.10.9. Profitability
16.3.10.10. Revenue Share
16.3.10.11. Executive Bios
16.3.11. Careem
16.3.11.1. Company Overview
16.3.11.2. Company Footprints
16.3.11.3. Production Locations
16.3.11.4. Product Portfolio
16.3.11.5. Competitors & Customers
16.3.11.6. Subsidiaries & Parent Organization
16.3.11.7. Recent Developments
16.3.11.8. Financial Analysis
16.3.11.9. Profitability
16.3.11.10. Revenue Share
16.3.11.11. Executive Bios
16.3.12. The Hertz Corporation
16.3.12.1. Company Overview
16.3.12.2. Company Footprints
16.3.12.3. Production Locations
16.3.12.4. Product Portfolio
16.3.12.5. Competitors & Customers
16.3.12.6. Subsidiaries & Parent Organization
16.3.12.7. Recent Developments
16.3.12.8. Financial Analysis
16.3.12.9. Profitability
16.3.12.10. Revenue Share
16.3.12.11. Executive Bios
16.3.13. Enterprise Holdings, Inc.
16.3.13.1. Company Overview
16.3.13.2. Company Footprints
16.3.13.3. Production Locations
16.3.13.4. Product Portfolio
16.3.13.5. Competitors & Customers
16.3.13.6. Subsidiaries & Parent Organization
16.3.13.7. Recent Developments
16.3.13.8. Financial Analysis
16.3.13.9. Profitability
16.3.13.10. Revenue Share
16.3.13.11. Executive Bios
16.3.14. Beijing Xiaoju Technology Co, Ltd. (Didi Chuxing)
16.3.14.1. Company Overview
16.3.14.2. Company Footprints
16.3.14.3. Production Locations
16.3.14.4. Product Portfolio
16.3.14.5. Competitors & Customers
16.3.14.6. Subsidiaries & Parent Organization
16.3.14.7. Recent Developments
16.3.14.8. Financial Analysis
16.3.14.9. Profitability
16.3.14.10. Revenue Share
16.3.14.11. Executive Bios
16.3.15. Other Key Players
17. Key Takeaways
17.1. Market Attractiveness Opportunity
17.2. Manufacturer’s Perspective
List of Tables
Table 1: Global Shared Mobility Market Volume (Thousand Units) Forecast, by Sector Type, 2017‒2031
Table 2: Global Shared Mobility Market Value (US$ Bn) Forecast, by Sector Type, 2017‒2031
Table 3: Global Shared Mobility Market Volume (Thousand Units) Forecast, by Shared Mobility Type, 2017‒2031
Table 4: Global Shared Mobility Market Value (US$ Bn) Forecast, by Shared Mobility Type, 2017‒2031
Table 5: Global Shared Mobility Market Volume (Thousand Units) Forecast, by Business Model, 2017‒2031
Table 6: Global Shared Mobility Market Value (US$ Bn) Forecast, by Business Model, 2017‒2031
Table 7: Global Shared Mobility Market Volume (Thousand Units) Forecast, by Vehicle Type, 2017‒2031
Table 8: Global Shared Mobility Market Value (US$ Bn) Forecast, by Vehicle Type, 2017‒2031
Table 9: Global Shared Mobility Market Volume (Thousand Units) Forecast, by Propulsion, 2017‒2031
Table 10: Global Shared Mobility Market Value (US$ Bn) Forecast, by Propulsion, 2017‒2031
Table 11: Global Shared Mobility Market Volume (Thousand Units) Forecast, by Region, 2017‒2031
Table 12: Global Shared Mobility Market Value (US$ Bn) Forecast, by Region, 2017‒2031
Table 13: North America Shared Mobility Market Volume (Thousand Units) Forecast, by Sector Type, 2017‒2031
Table 14: North America Shared Mobility Market Value (US$ Bn) Forecast, by Sector Type, 2017‒2031
Table 15: North America Shared Mobility Market Volume (Thousand Units) Forecast, by Shared Mobility Type, 2017‒2031
Table 16: North America Shared Mobility Market Value (US$ Bn) Forecast, by Shared Mobility Type, 2017‒2031
Table 17: North America Shared Mobility Market Volume (Thousand Units) Forecast, by Business Model, 2017‒2031
Table 18: North America Shared Mobility Market Value (US$ Bn) Forecast, by Business Model, 2017‒2031
Table 19: North America Shared Mobility Market Volume (Thousand Units) Forecast, by Vehicle Type, 2017‒2031
Table 20: North America Shared Mobility Market Value (US$ Bn) Forecast, by Vehicle Type, 2017‒2031
Table 21: North America Shared Mobility Market Volume (Thousand Units) Forecast, by Propulsion, 2017‒2031
Table 22: North America Shared Mobility Market Value (US$ Bn) Forecast, by Propulsion, 2017‒2031
Table 23: North America Shared Mobility Market Volume (Thousand Units) Forecast, by Country, 2017‒2031
Table 24: North America Shared Mobility Market Value (US$ Bn) Forecast, by Country, 2017‒2031
Table 25: Europe Shared Mobility Market Volume (Thousand Units) Forecast, by Sector Type, 2017‒2031
Table 26: Europe Shared Mobility Market Value (US$ Bn) Forecast, by Sector Type, 2017‒2031
Table 27: Europe Shared Mobility Market Volume (Thousand Units) Forecast, by Shared Mobility Type, 2017‒2031
Table 28: Europe Shared Mobility Market Value (US$ Bn) Forecast, by Shared Mobility Type, 2017‒2031
Table 29: Europe Shared Mobility Market Volume (Thousand Units) Forecast, by Business Model, 2017‒2031
Table 30: Europe Shared Mobility Market Value (US$ Bn) Forecast, by Business Model, 2017‒2031
Table 31: Europe Shared Mobility Market Volume (Thousand Units) Forecast, by Vehicle Type, 2017‒2031
Table 32: Europe Shared Mobility Market Value (US$ Bn) Forecast, by Vehicle Type, 2017‒2031
Table 33: Europe Shared Mobility Market Volume (Thousand Units) Forecast, by Propulsion, 2017‒2031
Table 34: Europe Shared Mobility Market Value (US$ Bn) Forecast, by Propulsion, 2017‒2031
Table 35: Europe Shared Mobility Market Volume (Thousand Units) Forecast, by Country & Sub-region, 2017‒2031
Table 36: Europe Shared Mobility Market Value (US$ Bn) Forecast, by Country & Sub-region, 2017‒2031
Table 37: Asia Pacific Shared Mobility Market Volume (Thousand Units) Forecast, by Sector Type, 2017‒2031
Table 38: Asia Pacific Shared Mobility Market Value (US$ Bn) Forecast, by Sector Type, 2017‒2031
Table 39: Asia Pacific Shared Mobility Market Volume (Thousand Units) Forecast, by Shared Mobility Type, 2017‒2031
Table 40: Asia Pacific Shared Mobility Market Value (US$ Bn) Forecast, by Shared Mobility Type, 2017‒2031
Table 41: Asia Pacific Shared Mobility Market Volume (Thousand Units) Forecast, by Business Model, 2017‒2031
Table 42: Asia Pacific Shared Mobility Market Value (US$ Bn) Forecast, by Business Model, 2017‒2031
Table 43: Asia Pacific Shared Mobility Market Volume (Thousand Units) Forecast, by Vehicle Type, 2017‒2031
Table 44: Asia Pacific Shared Mobility Market Value (US$ Bn) Forecast, by Vehicle Type, 2017‒2031
Table 45: Asia Pacific Shared Mobility Market Volume (Thousand Units) Forecast, by Propulsion, 2017‒2031
Table 46: Asia Pacific Shared Mobility Market Value (US$ Bn) Forecast, by Propulsion, 2017‒2031
Table 47: Asia Pacific Shared Mobility Market Volume (Thousand Units) Forecast, by Country & Sub-region, 2017‒2031
Table 48: Asia Pacific Shared Mobility Market Value (US$ Bn) Forecast, by Country & Sub-region, 2017‒2031
Table 49: Middle East & Africa Shared Mobility Market Volume (Thousand Units) Forecast, by Sector Type, 2017‒2031
Table 50: Middle East & Africa Shared Mobility Market Value (US$ Bn) Forecast, by Sector Type, 2017‒2031
Table 51: Middle East & Africa Shared Mobility Market Volume (Thousand Units) Forecast, by Shared Mobility Type, 2017‒2031
Table 52: Middle East & Africa Shared Mobility Market Value (US$ Bn) Forecast, by Shared Mobility Type, 2017‒2031
Table 53: Middle East & Africa Shared Mobility Market Volume (Thousand Units) Forecast, by Business Model, 2017‒2031
Table 54: Middle East & Africa Shared Mobility Market Value (US$ Bn) Forecast, by Business Model, 2017‒2031
Table 55: Middle East & Africa Shared Mobility Market Volume (Thousand Units) Forecast, by Vehicle Type, 2017‒2031
Table 56: Middle East & Africa Shared Mobility Market Value (US$ Bn) Forecast, by Vehicle Type, 2017‒2031
Table 57: Middle East & Africa Shared Mobility Market Volume (Thousand Units) Forecast, by Propulsion, 2017‒2031
Table 58: Middle East & Africa Shared Mobility Market Value (US$ Bn) Forecast, by Propulsion, 2017‒2031
Table 59: Middle East & Africa Shared Mobility Market Volume (Thousand Units) Forecast, by Country & Sub-region, 2017‒2031
Table 60: Middle East & Africa Shared Mobility Market Value (US$ Bn) Forecast, by Country & Sub-region, 2017‒2031
Table 61: South America Shared Mobility Market Volume (Thousand Units) Forecast, by Sector Type, 2017‒2031
Table 62: South America Shared Mobility Market Value (US$ Bn) Forecast, by Sector Type, 2017‒2031
Table 63: South America Shared Mobility Market Volume (Thousand Units) Forecast, by Shared Mobility Type, 2017‒2031
Table 64: South America Shared Mobility Market Value (US$ Bn) Forecast, by Shared Mobility Type, 2017‒2031
Table 65: South America Shared Mobility Market Volume (Thousand Units) Forecast, by Business Model, 2017‒2031
Table 66: South America Shared Mobility Market Value (US$ Bn) Forecast, by Business Model, 2017‒2031
Table 67: South America Shared Mobility Market Volume (Thousand Units) Forecast, by Vehicle Type, 2017‒2031
Table 68: South America Shared Mobility Market Value (US$ Bn) Forecast, by Vehicle Type, 2017‒2031
Table 69: South America Shared Mobility Market Volume (Thousand Units) Forecast, by Propulsion, 2017‒2031
Table 70: South America Shared Mobility Market Value (US$ Bn) Forecast, by Propulsion, 2017‒2031
Table 71: South America Shared Mobility Market Volume (Thousand Units) Forecast, by Country & Sub-region, 2017‒2031
Table 72: South America Shared Mobility Market Value (US$ Bn) Forecast, by Country & Sub-region, 2017‒2031
List of Figures
Figure 1: Global Shared Mobility Market Volume (Thousand Units) Forecast, 2017–2031
Figure 2: Global Shared Mobility Market Value (US$ Bn) Forecast, 2017–2031
Figure 3: Key Segment Analysis for Global
Figure 4: Global Shared Mobility Market Value (US$ Bn) Forecast, 2017‒2031
Figure 5: Global Shared Mobility Market Value (US$ Bn) Forecast, by Sector Type, 2017‒2031
Figure 6: Global Market Attractiveness, Value (US$ Bn), by Sector Type, 2022‒2031
Figure 7: Global Shared Mobility Market Value (US$ Bn) Forecast, by Shared Mobility Type, 2017‒2031
Figure 8: Global Market Attractiveness, Value (US$ Bn), by Shared Mobility Type, 2022‒2031
Figure 9: Global Shared Mobility Market Value (US$ Bn) Forecast, by Business Model, 2017‒2031
Figure 10: Global Market Attractiveness, Value (US$ Bn), by Business Model, 2022‒2031
Figure 11: Global Shared Mobility Market Value (US$ Bn) Forecast, by Vehicle Type, 2017‒2031
Figure 12: Global Market Attractiveness, Value (US$ Bn), by Vehicle Type, 2022‒2031
Figure 13: Global Shared Mobility Market Value (US$ Bn) Forecast, by Propulsion, 2017‒2031
Figure 14: Global Market Attractiveness, Value (US$ Bn), by Propulsion, 2022‒2031
Figure 15: Global Shared Mobility Market Value (US$ Bn) Forecast, by Region, 2017‒2031
Figure 16: Global Market Attractiveness, Value (US$ Bn), by Region, 2022‒2031
Figure 17: North America Shared Mobility Market Value (US$ Bn) Forecast, by Sector Type, 2017‒2031
Figure 18: North America Market Attractiveness, Value (US$ Bn), by Sector Type, 2022‒2031
Figure 19: North America Shared Mobility Market Value (US$ Bn) Forecast, by Shared Mobility Type, 2017‒2031
Figure 20: North America Market Attractiveness, Value (US$ Bn), by Shared Mobility Type, 2022‒2031
Figure 21: North America Shared Mobility Market Value (US$ Bn) Forecast, by Business Model, 2017‒2031
Figure 22: North America Market Attractiveness, Value (US$ Bn), by Business Model, 2022‒2031
Figure 23: North America Shared Mobility Market Value (US$ Bn) Forecast, by Vehicle Type, 2017‒2031
Figure 24: North America Market Attractiveness, Value (US$ Bn), by Vehicle Type, 2022‒2031
Figure 25: North America Shared Mobility Market Value (US$ Bn) Forecast, by Propulsion, 2017‒2031
Figure 26: North America Market Attractiveness, Value (US$ Bn), by Propulsion, 2022‒2031
Figure 27: North America Shared Mobility Market Value (US$ Bn) Forecast, by Country, 2017‒2031
Figure 28: North America Market Attractiveness, Value (US$ Bn), by Country, 2022‒2031
Figure 29: Europe Shared Mobility Market Value (US$ Bn) Forecast, by Sector Type, 2017‒2031
Figure 30: Europe Market Attractiveness, Value (US$ Bn), by Sector Type, 2022‒2031
Figure 31: Europe Shared Mobility Market Value (US$ Bn) Forecast, by Shared Mobility Type, 2017‒2031
Figure 32: Europe Market Attractiveness, Value (US$ Bn), by Shared Mobility Type, 2022‒2031
Figure 33: Europe Shared Mobility Market Value (US$ Bn) Forecast, by Business Model, 2017‒2031
Figure 34: Europe Market Attractiveness, Value (US$ Bn), by Business Model, 2022‒2031
Figure 35: Europe Shared Mobility Market Value (US$ Bn) Forecast, by Vehicle Type, 2017‒2031
Figure 36: Europe Market Attractiveness, Value (US$ Bn), by Vehicle Type, 2022‒2031
Figure 37: Europe Shared Mobility Market Value (US$ Bn) Forecast, by Propulsion, 2017‒2031
Figure 38: Europe Market Attractiveness, Value (US$ Bn), by Propulsion, 2022‒2031
Figure 39: Europe Shared Mobility Market Value (US$ Bn) Forecast, by Country & Sub-region, 2017‒2031
Figure 40: Europe Market Attractiveness, Value (US$ Bn), by Country & Sub-region, 2022‒2031
Figure 41: Asia Pacific Shared Mobility Market Value (US$ Bn) Forecast, by Sector Type, 2017‒2031
Figure 42: Asia Pacific Market Attractiveness, Value (US$ Bn), by Sector Type, 2022‒2031
Figure 43: Asia Pacific Shared Mobility Market Value (US$ Bn) Forecast, by Shared Mobility Type, 2017‒2031
Figure 44: Asia Pacific Market Attractiveness, Value (US$ Bn), by Shared Mobility Type, 2022‒2031
Figure 45: Asia Pacific Shared Mobility Market Value (US$ Bn) Forecast, by Business Model, 2017‒2031
Figure 46: Asia Pacific Market Attractiveness, Value (US$ Bn), by Business Model, 2022‒2031
Figure 47: Asia Pacific Shared Mobility Market Value (US$ Bn) Forecast, by Vehicle Type, 2017‒2031
Figure 48: Asia Pacific Market Attractiveness, Value (US$ Bn), by Vehicle Type, 2022‒2031
Figure 49: Asia Pacific Shared Mobility Market Value (US$ Bn) Forecast, by Propulsion, 2017‒2031
Figure 50: Asia Pacific Market Attractiveness, Value (US$ Bn), by Propulsion, 2022‒2031
Figure 51: Asia Pacific Shared Mobility Market Value (US$ Bn) Forecast, by Country & Sub-region, 2017‒2031
Figure 52: Asia Pacific Market Attractiveness, Value (US$ Bn), by Country & Sub-region, 2022‒2031
Figure 53: Middle East & Africa Shared Mobility Market Value (US$ Bn) Forecast, by Sector Type, 2017‒2031
Figure 54: Middle East & Africa Market Attractiveness, Value (US$ Bn), by Sector Type, 2022‒2031
Figure 55: Middle East & Africa Shared Mobility Market Value (US$ Bn) Forecast, by Shared Mobility Type, 2017‒2031
Figure 56: Middle East & Africa Market Attractiveness, Value (US$ Bn), by Shared Mobility Type, 2022‒2031
Figure 57: Middle East & Africa Shared Mobility Market Value (US$ Bn) Forecast, by Business Model, 2017‒2031
Figure 58: Middle East & Africa Market Attractiveness, Value (US$ Bn), by Business Model, 2022‒2031
Figure 59: Middle East & Africa Shared Mobility Market Value (US$ Bn) Forecast, by Vehicle Type, 2017‒2031
Figure 60: Middle East & Africa Market Attractiveness, Value (US$ Bn), by Vehicle Type, 2022‒2031
Figure 61: Middle East & Africa Shared Mobility Market Value (US$ Bn) Forecast, by Propulsion, 2017‒2031
Figure 62: Middle East & Africa Market Attractiveness, Value (US$ Bn), by Propulsion, 2022‒2031
Figure 63: Middle East & Africa Shared Mobility Market Value (US$ Bn) Forecast, by Country & Sub-region, 2017‒2031
Figure 64: Middle East & Africa Market Attractiveness, Value (US$ Bn), by Country & Sub-region, 2022‒2031
Figure 65: South America Shared Mobility Market Value (US$ Bn) Forecast, by Sector Type, 2017‒2031
Figure 66: South America Market Attractiveness, Value (US$ Bn), by Sector Type, 2022‒2031
Figure 67: South America Shared Mobility Market Value (US$ Bn) Forecast, by Shared Mobility Type, 2017‒2031
Figure 68: South America Market Attractiveness, Value (US$ Bn), by Shared Mobility Type, 2022‒2031
Figure 69: South America Shared Mobility Market Value (US$ Bn) Forecast, by Business Model, 2017‒2031
Figure 70: South America Market Attractiveness, Value (US$ Bn), by Business Model, 2022‒2031
Figure 71: South America Shared Mobility Market Value (US$ Bn) Forecast, by Vehicle Type, 2017‒2031
Figure 72: South America Market Attractiveness, Value (US$ Bn), by Vehicle Type, 2022‒2031
Figure 73: South America Shared Mobility Market Value (US$ Bn) Forecast, by Propulsion, 2017‒2031
Figure 74: South America Market Attractiveness, Value (US$ Bn), by Propulsion, 2022‒2031
Figure 75: South America Shared Mobility Market Value (US$ Bn) Forecast, by Country & Sub-region, 2017‒2031
Figure 76: South America Market Attractiveness, Value (US$ Bn), by Country & Sub-region, 2022‒2031
Copyright © Transparency Market Research, Inc. All Rights reserved
Trust Online


Shared Mobility Market