Americans’ Monthly Credit Card Spending
If you were fortunate enough to keep your job during the pandemic, you probably noticed a financial benefit: you spent less. Amid restrictions, credit card spending on fun activities—like going out for dinner—became less frequent.
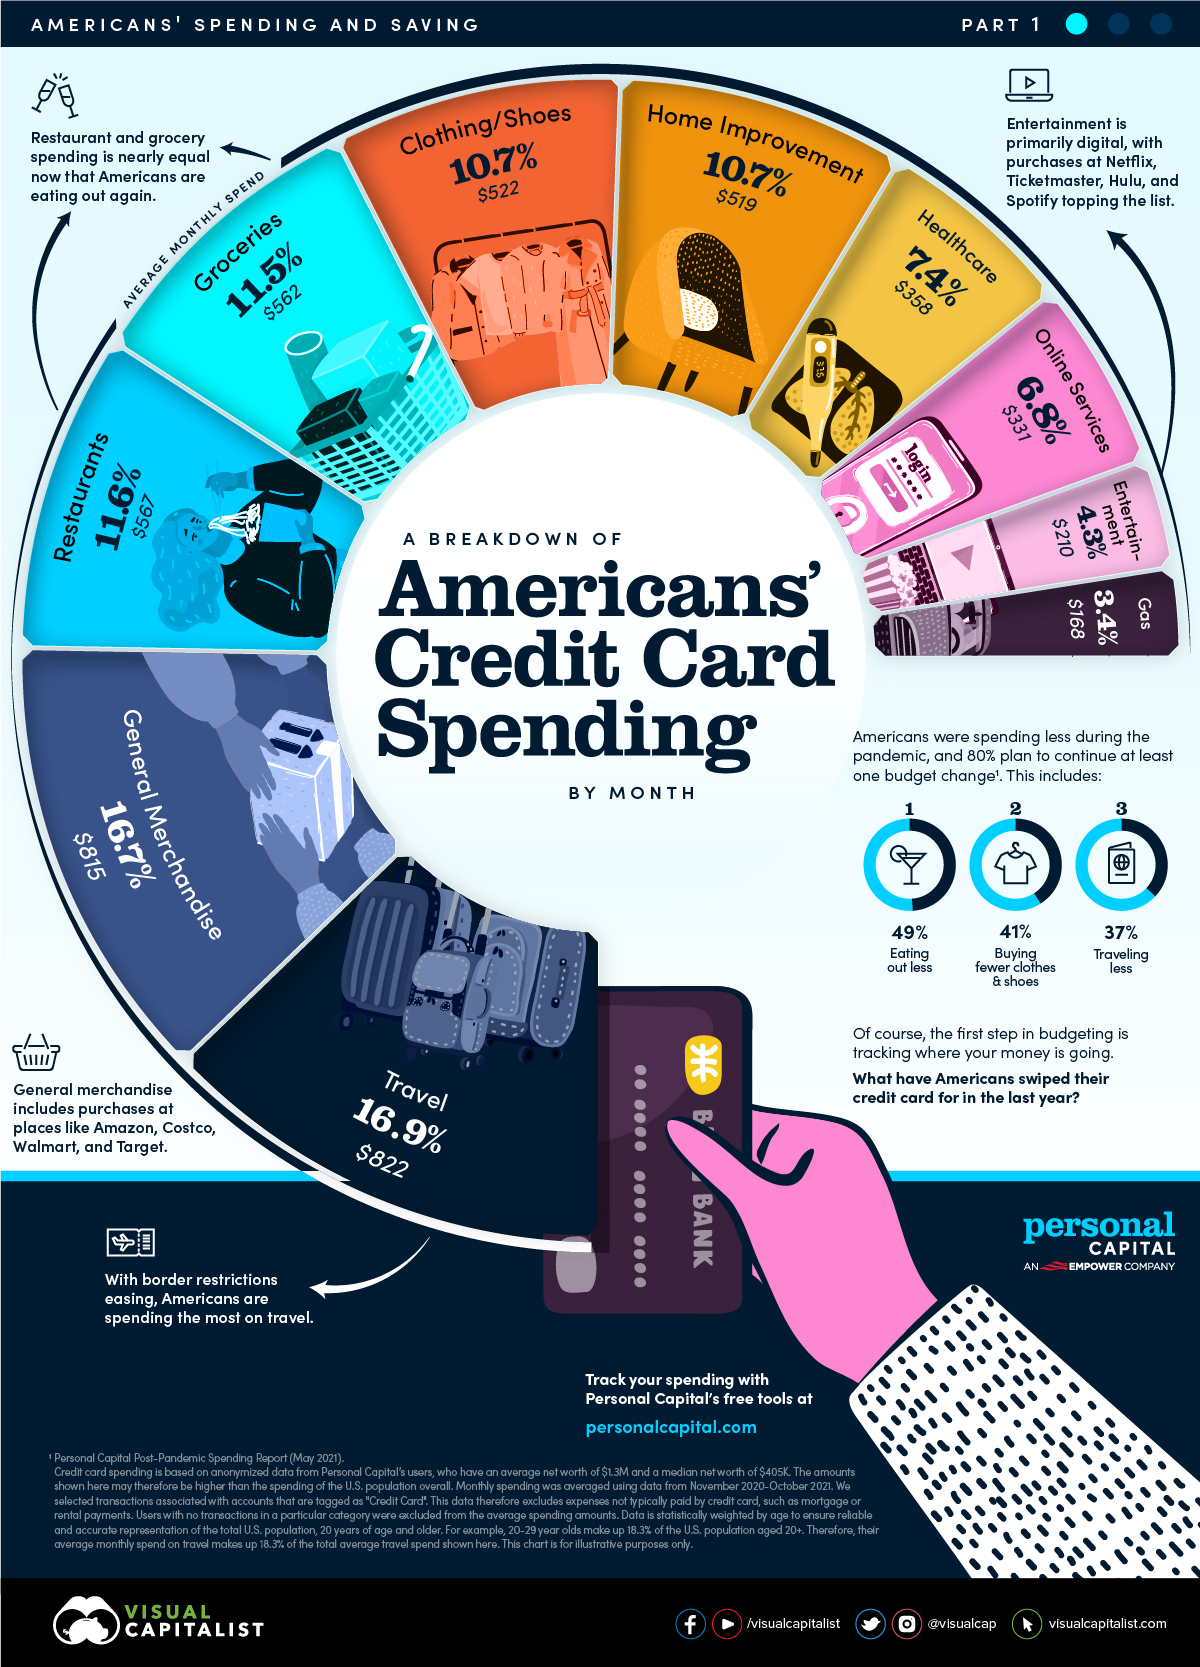
Looking ahead, the majority of Americans plan to continue at least one budget change post-pandemic, including eating out less (49%), buying fewer clothes and shoes (41%), and traveling less (37%). Of course, the first step in budgeting is tracking where your money is going.
In the above graphic from Personal Capital, we break down Americans’ monthly credit card spending by category. It’s the first in a three-part series that will explore the spending and saving of Americans.
Behind the Numbers
Credit card spending is based on anonymized data from Personal Capital users, who tend to have a higher-than-average net worth. For this particular subset of users, people had an average net worth of $1.3 million and a median net worth of $405,000. Therefore, the credit card spending amounts may be higher than those of the general U.S. population.
It’s also worth noting that the data reflects credit card spending only. It does not include expenses such as mortgage or rental payments, which are typically paid through other methods.
Credit Card Spending by Category
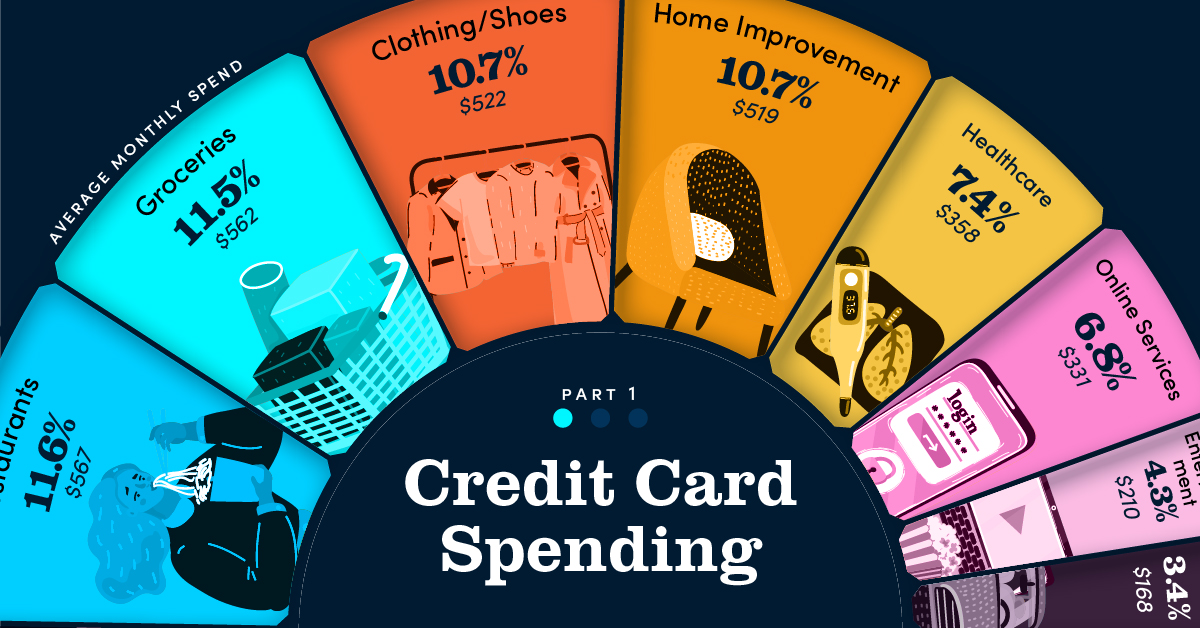
Here’s a breakdown of monthly credit card spending, based on averaged data from November 2020 to October 2021.
| Category | Monthly Spend | % of Monthly Spend |
| Travel | $822 | 16.9% |
| General Merchandise | $815 | 16.7% |
| Restaurants | $567 | 11.6% |
| Groceries | $562 | 11.5% |
| Clothing/Shoes | $522 | 10.7% |
| Home Improvement | $519 | 10.7% |
| Healthcare | $358 | 7.4% |
| Online Services | $331 | 6.8% |
| Entertainment | $210 | 4.3% |
| Gas | $168 | 3.4% |
| Total | $4,874 | 100.0% |
Users with no transactions in a particular category were excluded from the average spending amounts. Data is statistically weighted by age to ensure accurate and reliable representation of the total U.S. population, 20 years of age and older.
As border restrictions ease, Americans are spending the most on travel. In fact, 83% of Americans say they are excited to plan a trip in a post-pandemic world. The most popular merchant within travel is Airbnb, followed by airlines such as Delta and United as air travel recovers from its pandemic slump. However, this recovery could be in jeopardy amid fresh concerns over the Omicron variant.
Travel is closely followed by general merchandise, at places like Amazon, Costco, Walmart, and Target. Monthly spending in this category has averaged at $815 over the last year. Of course, this could climb even higher near year-end due to the holiday spending boom typically seen in the U.S. every year.
On the other hand, Americans spend the least on online services (such as Google and Facebook), entertainment, and gas. Though the average monthly spending on gas was the lowest of all categories, it increased by 60% from November 2020 to October 2021. This is likely due to gas being one of the categories hit hardest by inflation, along with increased travel.
Turning Reduced Spending Into Savings
With the swipe of a credit card, it can be easy to underestimate how quickly eating out and online shopping add up. However, by taking a closer look at your credit card spending, you can get a sense of where your money is going.
Like most Americans, you may also decide to carry over at least one budget change post-pandemic. What do Americans want to do with the extra cash? Over half plan to put it towards savings, and 16% aim to contribute more to retirement savings or investments.
In Part 2 of the Americans’ Spending and Saving series, we’ll break down Americans’ financial assets by age.