

Consumer Insights
Uncover trends and behaviors shaping consumer choices today
Procurement Insights
Optimize your sourcing strategy with key market data
Industry Stats
Stay ahead with the latest trends and market analysis.
Trending Now


The global frac sand market was estimated to be worth around USD 9.61 Billion in 2024. The market is anticipated to grow at a compound annual growth rate (CAGR) of 7.50% between 2025-2034, reaching USD 19.81 Billion by 2034. The global frac sand market plays a crucial role in hydraulic fracturing (fracking) for shale oil extraction. Frac sand is used to create fractures in shale formations, allowing for the efficient extraction of hydrocarbons. As shale production continues to increase, the demand for frac sand grows, driving the oil and gas industry. The sand helps to prop open fractures, ensuring that oil and gas can flow freely. In April 2024, Apollo Global Management affiliates acquired frack-sand provider US Silica Holdings for USD 1.21 billion. US Silica shareholders will receive USD 15.50 per share, an 18.7% premium over the company's closing price on April 25, 2024. With an expanding market, frac sand is essential for increasing the recovery of oil and gas from tight shale formations, enhancing overall shale production and boosting energy supply.
Base Year
Historical Year
Forecast Year
In 2023, the demand for sand mining has surged dramatically, with estimates indicating a tripling in demand over the past two decades, culminating in an annual extraction rate of approximately 50 billion tonnes. This increase is primarily driven by the construction industry, which relies heavily on sand as a fundamental material for concrete and other building applications. The United Nations Environment Programme has warned of a potential "sand crisis," highlighting the urgent need for sustainable practices in sand extraction to mitigate environmental impacts.
In the United States, frac sand mining has intensified, particularly in states such as Wisconsin, Illinois, Minnesota, and Michigan, where high-quality sandstone deposits are abundant. Frac sand is crucial for hydraulic fracturing (fracking), a method used to extract oil and gas from shale formations. Each well can require up to 10,000 tons of sand, contributing to a significant portion of the total demand for industrial sand. As of 2023, the U.S. produced about 130 million tons of industrial sand and gravel, with frac sand accounting for approximately 81% of this total.
Reports indicate that sand is now recognised as Earth's most mined material, with around 50 billion tons extracted annually from various aquatic and coastal environments. This extensive mining activity calls for stricter regulations to balance economic needs with ecological preservation. The ongoing global shale oil and gas boom is not limited to North America; countries like Argentina, China, and Russia are also exploring their shale reserves, further driving demand for frac sand.


Value in USD Billion
2025-2034
Frac Sand Market Outlook
*this image is indicative*
Read more about this report - REQUEST FREE SAMPLE COPY IN PDF
Increasing hydraulic fracturing activities, technological advancements in drilling and extraction, and growing preference for high-grade frac sand are the key trends propelling the market growth.
The growing demand for oil and natural gas, particularly from unconventional sources like shale formations, has led to an increase in hydraulic fracturing activities, which require large quantities of frac sand. For instance, the U.S. is the largest producer of crude oil, with an average production of approximately 12.8 million barrels per day (b/d) in 2024, expected to grow by 1.5 million b/d in both 2024 and 2025 due to increased output from shale formations. A crucial trend of frac sand market is that as conventional oil and gas reserves become depleted or harder to access, the focus has shifted towards unconventional sources such as shale formations. Extracting hydrocarbons from these formations requires hydraulic fracturing (fracking), a process that relies heavily on frac sand to prop open the fractures in the rock, allowing oil and gas to flow to the surface. This increased reliance on hydraulic fracturing to meet energy demands has directly translated into a surge in the need for frac sand, making it a critical component in the energy extraction process.
Advances in drilling and extraction technologies have made hydraulic fracturing more efficient and cost-effective, thereby boosting the demand for frac sand. For example, Halliburton is a leader in hydraulic fracturing services, employing advanced technologies to optimise fracturing operations. Their innovative approaches include electric fracturing platforms and real-time monitoring systems that improve efficiency, reduce costs and can boost frac sand market value. The evolution of drilling and extraction technologies has been a game-changer for the market. Innovations such as horizontal drilling and improvements in fracking techniques have made it possible to access previously unreachable or uneconomical reserves. These advancements have not only increased the efficiency of hydraulic fracturing but also reduced its overall costs, making it a more attractive option for oil and gas producers. For example, the combination of horizontal drilling and hydraulic fracturing has led to significant cost reductions in drilling operations, with reports indicating a decrease of 15-20% in costs for drilling and well completions.
Brown frac sand is increasingly favoured due to its cost-effectiveness and availability near drilling sites. For instance, EOG Resources has invested in brown sand operations in Texas, significantly reducing its costs. By owning its own sand sources, EOG can pay approximately USD 80 per ton for brown sand, compared to the market price of USD 120 per ton for northern white sand. This strategic move allows EOG to lower overall drilling costs, making it more competitive in the Permian Basin, where high-quality proppants are crucial for increasing production efficiency. Another example is Pioneer Natural Resources, which acquired a sand mine in Brady, Texas. This acquisition is projected to save the company between USD 65 to 70 million annually by providing a reliable supply of brown frac sand for its operations in the Permian Basin. The proximity of this mine allows Pioneer to mitigate transportation costs and secure a steady supply of proppants essential for hydraulic fracturing. Additionally, companies like Cadre Proppants operate large silica sand mines in Texas that focus on producing brown frac sand required by oil and gas operators. The growing acceptance of brown frac sand as a valid alternative to northern white sand reflects a broader trend.
The trend of consolidation is reshaping the frac sand landscape as companies seek to enhance their market presence and operational efficiencies. For example, U.S. Silica Holdings acquired Cleveland, Ohio-based Eagle Ford Sand, expanding its footprint in key shale regions. This acquisition not only increases U.S. Silica's production capabilities but also allows it to offer a more diverse range of proppant products to its customers, thereby strengthening its competitive position in the market. Similarly, Hi-Crush Partners, a major player in the frac sand industry, has also engaged in strategic acquisitions to bolster its market share. By acquiring smaller frac sand producers, Hi-Crush aims to streamline operations and reduce costs associated with production and logistics. This consolidation trend enables larger companies to leverage economies of scale, resulting in lower prices for consumers and increased bargaining power within supply chains.
The frac sand market is experiencing significant growth driven by increasing demand for shale gas extraction through hydraulic fracturing. Frac sand, primarily composed of crystalline silica and quartz sand, is a key proppant used in the hydraulic fracturing process. It helps keep fractures open in shale formations, enabling the efficient extraction of hydrocarbons like shale gas. As shale production continues to rise, the petroleum industry heavily relies on high-quality frac sand to optimise production and reduce operational costs. Smart Sand Inc. reported USD 73.8 million in revenues for Q4 2022, marking a 110% increase from Q4 2021. Higher volumes and selling prices contributed to the growth. Tons sold rose by 35% compared to Q4 2021, reaching 1.175 million tons.
The frac sand market has witnessed significant shifts in recent years due to fluctuating demand and the impacts of global events. The mining sector has faced challenges in meeting supply chain demands for frac sand, particularly during disruptions caused by COVID-19. As a crucial proppant in hydraulic fracturing, frac sand plays an essential role in shale gas extraction, leading to strong product demand in the oil and gas industry. However, logistical issues within the supply chain have hindered consistent delivery, affecting the production pace. Additionally, frac sand is increasingly used in other industries such as construction and glass manufacturing, diversifying its applications and contributing to market growth. Despite the challenges posed by the pandemic, the overall trend shows continued demand for frac sand, with supply chains evolving to meet the needs of both traditional and new sectors.
The frac sand market is evolving with increasing demand for high-quality frac sand in hydraulic fracturing, particularly in enhanced oil recovery (EOR) techniques. As oil companies aim to improve reservoir behavior and boost extraction, infrastructure development is critical to support growing drilling activities. Advances in artificial intelligence (AI) are also being leveraged to optimise the use of frac sand, enhancing efficiency in reservoirs management. The shape and size of frac sand particles play a crucial role in proppant performance, ensuring optimal flow and reservoir permeability. With expanding infrastructure to transport and store frac sand, the market is experiencing steady growth. The need for improved infrastructure also addresses logistical challenges, ensuring that the supply chain meets the high demand for frac sand across the oil and gas industry. As exploration and production activities ramp up, the market for frac sand remains robust.
Read more about this report - REQUEST FREE SAMPLE COPY IN PDF
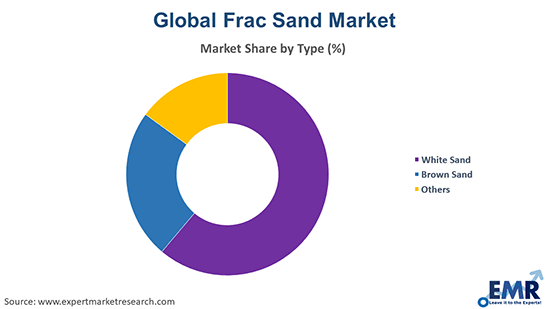
White frac sand offers high purity and roundness, making it ideal for hydraulic fracturing. Its superior strength resists crushing under high pressure, ensuring fractures stay open and enhancing the flow of hydrocarbons. Used primarily in high-performance applications, it boosts drilling efficiency, providing longer-lasting results in shale oil and gas extraction.
Brown frac sand is a cost-effective alternative to white sand, offering a lower price point while still serving as an efficient proppant in hydraulic fracturing. Although not as pure, it is widely used in less demanding applications and for enhanced oil recovery (EOR), providing value in shale formations where performance requirements are moderate, balancing cost and effectiveness.
In oil exploration, frac sand is crucial for hydraulic fracturing, a process that increases the flow of oil from underground reservoirs. The sand keeps fractures open, allowing for the efficient extraction of oil. White frac sand is particularly beneficial due to its high strength, ensuring fractures remain open under high pressure, contributing to enhanced production rates and better reservoir performance, especially in challenging shale formations.
In natural gas exploration, frac sand facilitates hydraulic fracturing, increasing gas flow from shale and other tight formations. The sand supports fracture walls during the extraction process, allowing natural gas to flow freely. With its high conductivity and strength, frac sand enhances the efficiency of the drilling process, ensuring greater gas recovery. This makes it an essential component for boosting production and optimising natural gas reserves, particularly in unconventional gas sources.


Argentina Frac Sand Market
The Argentina frac sand market is experiencing steady growth due to increasing demand for hydraulic fracturing in the country's shale oil and gas exploration. With vast reserves in the Vaca Muerta formation, one of the largest shale oil fields globally, the need for high-quality frac sand is rising. This sand is essential for the extraction process, where it helps to maintain fracture openings in shale formations, enhancing oil and gas flow. The market benefits from local production and imports of frac sand, boosting the country's energy sector. As exploration and production activities expand, the demand for frac sand in Argentina is expected to increase. From January 2021 to September 2024, Argentina's crude oil production rose by 50%, and natural gas production increased by 27%, approaching early 2000s output records. The Vaca Muerta shale formation holds 308 trillion cubic feet of recoverable shale gas and 16 billion barrels of shale oil, positioning Argentina among the top five global holders of these resources.
North America
The North American frac sand market is experiencing significant growth, driven by the increasing demand for hydraulic fracturing in shale oil and gas extraction. The region benefits from vast reserves of high-quality frac sand, particularly in states like Wisconsin, which is known for its high-purity, silica-rich sand. The market is also supported by technological advancements in fracking techniques and the rising focus on enhanced oil recovery (EOR). The growing demand for energy and the resurgence of drilling activities post-pandemic are further accelerating market expansion, with increasing investments in infrastructure and supply chain optimisation. Drilling costs for Haynesville wells, ranging from 10,500 to 13,500 feet deep, are high. In September 2024, shale natural gas production was 13.0 Bcf/d, making it the third-largest U.S. shale gas producer, after Marcellus and Permian. In 2023, it contributed 14% of total U.S. production.
Major players in the market are increasingly expanding their presence through the development of existing and new mining facilities. Several companies in the global frac sand market are experiencing growth through various strategic initiatives. One of the primary approaches is expanding production capacity, with many companies opening new mines or enlarging existing facilities to meet the rising demand for frac sand, particularly in regions with significant fracking activity. Additionally, investments in advanced technologies for mining, processing, and quality control of frac sand are becoming increasingly common.
In July 2024, Apollo Funds completed the acquisition of U.S. Silica Holdings, a diversified minerals and logistics provider to the oil and gas sector. U.S. Silica expressed confidence in the partnership, highlighting Apollo’s alignment with its vision for future growth. The company emphasised its strong foundation and dedicated team as key factors for success moving forward.
In November 2024, U.S. Silica Holdings announced price increases for its Industrial and Specialty...

In November 2024, Covia Energy and Black Mountain Sand merged to form Iron Oak Energy Solutions, ...
In October 2023, ProFrac Holding Corp. announced it was evaluating strategic options to maximise ...
Alborz Silica, one of the oldest privately held silica sand mining companies in Iran, operated th...
*Please note that this is only a partial list; the complete list of key players is available in the full report. Additionally, the list of key players can be customized to better suit your needs.*
“Frac Sand Market Report and Forecast 2025-2034” offers a detailed analysis of the market based on the following segments:
Product Outlook (Revenue, Billion, 2025-2034)
Application Outlook (Revenue, Billion, 2025-2034)
Region Outlook (Revenue, Billion, 2025-2034)
*While we strive to always give you current and accurate information, the numbers depicted on the website are indicative and may differ from the actual numbers in the main report. At Expert Market Research, we aim to bring you the latest insights and trends in the market. Using our analyses and forecasts, stakeholders can understand the market dynamics, navigate challenges, and capitalize on opportunities to make data-driven strategic decisions.*
Get in touch with us for a customized solution tailored to your unique requirements and save upto 35%!
In 2024, the market reached an approximate value of USD 9.61 Billion.
The market is assessed to grow at a CAGR of 7.50% between 2025 and 2034.
The market is estimated to witness healthy growth in the forecast period of 2025-2034 to reach a value of around USD 19.81 Billion by 2034.
The global frac sand market grows due to increased hydraulic fracturing, shale gas exploration, technological advancements, rising energy demand, higher oil prices, infrastructure development, and expanding production in emerging markets.
The cost-effectiveness of frac sand, the increasing research and development (R&D) activities aimed at launching high-efficiency and high-quality frac sand, and the growing adoption of shale fracturing in oil and gas extraction are the key trends guiding the market.
North America, Europe, the Asia Pacific, Latin America, and the Middle East and Africa are the major regions in the market.
White sand and brown sand, among others, are the various product of frac sand.
Frac sand is primarily used in oil and natural gas exploration, among other applications.
The leading players in the market are CARBO Ceramics Inc., Covia Holdings Corporation, Badger Mining Corporation, Smart Sand, Inc., U.S. Silica, Hi-Crush Inc, McLanahan, American Silica, Black Mountain Sand, Alpine Silica, PALANDEH SAF, Alborz Silica, Henan Zhengzhou Mining Machinery Co., Ltd., Sibelco, and Resico India Pvt. Ltd., among others.
North America is expected to dominate the global frac sand market.
Challenges faced by the global frac sand market include supply chain disruptions, environmental concerns, regulatory restrictions, and price volatility.
Expected trends in the global frac sand market include increased demand for regional sand, technological advancements, sustainability efforts, and consolidation in suppliers.
The market is segment in product and application insights.
Factors influencing the growth of the global frac sand market include rising oil prices, shale gas production, technological advancements, and infrastructure development.
Explore our key highlights of the report and gain a concise overview of key findings, trends, and actionable insights that will empower your strategic decisions.
| REPORT FEATURES | DETAILS |
| Base Year | 2024 |
| Historical Period | 2018-2024 |
| Forecast Period | 2025-2034 |
| Scope of the Report |
Historical and Forecast Trends, Industry Drivers and Constraints, Historical and Forecast Market Analysis by Segment:
|
| Breakup by Product |
|
| Breakup by Application |
|
| Breakup by Region |
|
| Market Dynamics |
|
| Competitive Landscape |
|
| Companies Covered |
|
| Report Price and Purchase Option | Explore our purchase options that are best suited to your resources and industry needs. |
| Delivery Format | Delivered as an attached PDF and Excel through email, with an option of receiving an editable PPT, according to the purchase option. |
Datasheet
One User
USD 2,499
USD 2,249
tax inclusive*
Single User License
One User
USD 3,999
USD 3,599
tax inclusive*
Five User License
Five User
USD 4,999
USD 4,249
tax inclusive*
Corporate License
Unlimited Users
USD 5,999
USD 5,099
tax inclusive*
*Please note that the prices mentioned below are starting prices for each bundle type. Kindly contact our team for further details.*
Flash Bundle
Small Business Bundle
Growth Bundle
Enterprise Bundle
*Please note that the prices mentioned below are starting prices for each bundle type. Kindly contact our team for further details.*
Flash Bundle
Number of Reports: 3
20%
tax inclusive*
Small Business Bundle
Number of Reports: 5
25%
tax inclusive*
Growth Bundle
Number of Reports: 8
30%
tax inclusive*
Enterprise Bundle
Number of Reports: 10
35%
tax inclusive*
How To Order
Our step-by-step guide will help you select, purchase, and access your reports swiftly, ensuring you get the information that drives your decisions, right when you need it.

Select License Type
Choose the right license for your needs and access rights.

Click on ‘Buy Now’
Add the report to your cart with one click and proceed to register.

Select Mode of Payment
Choose a payment option for a secure checkout. You will be redirected accordingly.
Track prices with detailed trend reports.

Analyse trade data for supply chain insights.

Leverage cost reports for smart savings

Enhance supply chain with partnerships.

Gain insights to stay ahead and seize opportunities.

Get insights & trends for a competitive edge.

Track prices with detailed trend reports.
Analyse trade data for supply chain insights.
Leverage cost reports for smart savings
Enhance supply chain with partnerships.
Gain insights to stay ahead and seize opportunities.
Get insights & trends for a competitive edge.
Track prices with detailed trend reports.
Analyse trade data for supply chain insights.
Connect For More Information
Our expert team of analysts will offer full support and resolve any queries regarding the report, before and after the purchase.
Our expert team of analysts will offer full support and resolve any queries regarding the report, before and after the purchase.
We employ meticulous research methods, blending advanced analytics and expert insights to deliver accurate, actionable industry intelligence, staying ahead of competitors.
Our skilled analysts offer unparalleled competitive advantage with detailed insights on current and emerging markets, ensuring your strategic edge.
We offer an in-depth yet simplified presentation of industry insights and analysis to meet your specific requirements effectively.
Australia
63 Fiona Drive, Tamworth, NSW
+61-448-061-727
India
C130 Sector 2 Noida, Uttar Pradesh 201301
+91-723-689-1189
Philippines
40th Floor, PBCom Tower, 6795 Ayala Avenue Cor V.A Rufino St. Makati City,1226.
+63-287-899-028, +63-967-048-3306
United Kingdom
6 Gardner Place, Becketts Close, Feltham TW14 0BX, Greater London
+44-753-713-2163
United States
30 North Gould Street, Sheridan, WY 82801
+1-415-325-5166
Vietnam
193/26/4 St.no.6, Ward Binh Hung Hoa, Binh Tan District, Ho Chi Minh City
+84-865-399-124
United States (Head Office)
30 North Gould Street, Sheridan, WY 82801
+1-415-325-5166
Australia
63 Fiona Drive, Tamworth, NSW
+61-448-061-727
India
C130 Sector 2 Noida, Uttar Pradesh 201301
+91-723-689-1189
Philippines
40th Floor, PBCom Tower, 6795 Ayala Avenue Cor V.A Rufino St. Makati City, 1226.
+63-287-899-028, +63-967-048-3306
United Kingdom
6 Gardner Place, Becketts Close, Feltham TW14 0BX, Greater London
+44-753-713-2163
Vietnam
193/26/4 St.no.6, Ward Binh Hung Hoa, Binh Tan District, Ho Chi Minh City
+84-865-399-124


Share