
Analysts’ Viewpoint on Quartz Crystal Market Scenario
Companies in the quartz crystal market are focusing on high-growth end-use industries, such as consumer electronics and IT & telecommunication, to keep their businesses growing post the COVID-19 pandemic. Accordingly, the market is estimated to expand significantly during the forecast period, owing to a rise in the demand for consumer electronics sectors for various applications including wearable devices, smartphones, video gamers, camera, and computers. Furthermore, increase in adoption of 5G network is estimated to propel the demand for quartz crystal in the next few years. Crystal oscillators are primarily utilized in digital integrated circuits to offer a stable clock signal and in specific applications that require high-frequency reference. Manufacturers should tap into incremental opportunities in quartz crystals to broaden their revenue streams.
Request a sample to get extensive insights into the Quartz Crystal Market
Request a custom report on Quartz Crystal Market
|
Attribute |
Detail |
|
Market Size Value in 2021 |
US$ 4.69 Bn |
|
Market Forecast Value in 2031 |
US$ 8.83 Bn |
|
Growth Rate (CAGR) |
6.8% |
|
Forecast Period |
2022–2031 |
|
Historical Data Available for |
2017–2020 |
|
Quantitative Units |
US$ Bn for Value and Million Units for Volume |
|
Market Analysis |
It includes cross segment analysis at global as well as regional level. Furthermore, qualitative analysis includes drivers, restraints, opportunities, key trends, Porter’s Five Forces analysis, value chain analysis, and key trend analysis. |
|
Competition Landscape |
|
|
Format |
Electronic (PDF) + Excel |
|
Market Segmentation |
|
|
Regions Covered |
|
|
Countries Covered |
|
|
Companies Profiled |
|
|
Customization Scope |
Available upon request |
|
Pricing |
Available upon request |
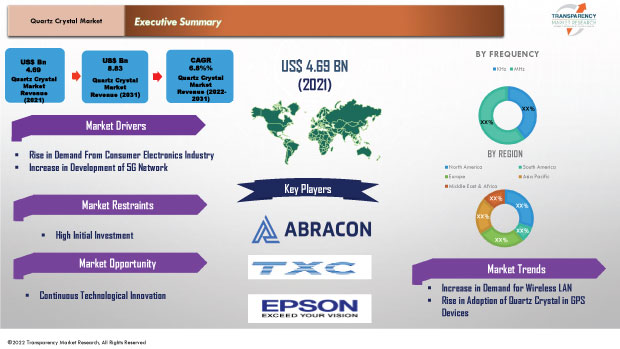
The quartz crystal market stood at US$ 4.69 Bn in 2021.
The quartz crystal market is expected to grow at a CAGR of 6.8% by 2031.
The quartz crystal market to reach US$ 8.83 Bn in 2031.
Abracon, ACTE A/S, Diodes Incorporated, DK Photonics, KYOCERA Crystal Device Corporation, Micro Crystal AG, Microchip Technology Inc., Nihon Dempa Kogyo Co., Ltd., RIVER ELETEC CORPORATION, Seiko Epson Corporation, SiTime Corporation, and TXC Corporation.
The U.S. accounted for 37.5% of share of the quartz crystal market in 2021.
Based on crystal cut, the AT Cut segment is estimated to hold 37.5% share of the quartz crystal market in 2021.
Increase in demand for wireless LAN and rise in adoption of quartz crystal in GPS devices.
Asia Pacific is more lucrative region of the global quartz crystal market.
1. Preface
1.1. Market Introduction
1.2. Market and Segments Definition
1.3. Market Taxonomy
1.4. Research Methodology
1.5. Assumption and Acronyms
2. Executive Summary
2.1. Global Quartz Crystal Market Overview
2.2. Regional Outline
2.3. Industry Outline
2.4. Market Dynamics Snapshot
2.5. Competition Blueprint
3. Market Dynamics
3.1. Macro-economic Factors
3.2. Drivers
3.3. Restraints
3.4. Opportunities
3.5. Key Trends
3.6. Regulatory Scenario
4. Associated Industry and Key Indicator Assessment
4.1. Parent Industry Overview – Passive Frequency Component Industry Overview
4.2. Supply Chain Analysis
4.3. Pricing Analysis
4.4. Technology Roadmap Analysis
4.5. Industry SWOT Analysis
4.6. Porter Five Forces Analysis
4.7. Covid-19 Impact and Recovery Analysis
5. Quartz Crystal Market Analysis, by Frequency
5.1. Quartz Crystal Market Size (US$ Bn) and Volume (Million Units) Analysis & Forecast, by Frequency, 2017–2031
5.1.1. KHz
5.1.2. MHz s
5.2. Market Attractiveness Analysis, by Frequency
6. Quartz Crystal Market Analysis, by Crystal Cut
6.1. Quartz Crystal Market Size (US$ Bn) and Volume (Million Units) Analysis & Forecast, by Crystal Cut, 2017–2031
6.1.1. AT Cut
6.1.2. BT Cut
6.1.3. SC Cut
6.1.4. Others (FC, AK, CT etc.)
6.2. Market Attractiveness Analysis, by Crystal Cut
7. Quartz Crystal Market Analysis, by Application
7.1. Quartz Crystal Market Size (US$ Bn) Analysis & Forecast, by Application, 2017–2031
7.1.1. Automotive MCU
7.1.2. In-Vehicle Infotainment System
7.1.3. Communication and Test Equipment
7.1.4. Lighting Fixtures
7.1.5. HDDs/SSDs
7.1.6. Wearables
7.1.7. Others
7.2. Market Attractiveness Analysis, by Application
8. Quartz Crystal Market Analysis, by End-use Industry
8.1. Quartz Crystal Market Size (US$ Bn) Analysis & Forecast, by End-use Industry, 2017–2031
8.1.1. IT & Telecommunication
8.1.2. Consumer Electronics
8.1.3. Aerospace & Defense
8.1.4. Healthcare
8.1.5. Automotive
8.1.6. Industrial
8.1.7. Others
8.2. Market Attractiveness Analysis, by End-use Industry
9. Quartz Crystal Market Analysis and Forecast, by Region
9.1. Quartz Crystal Market Size (US$ Bn) and Volume (Million Units) Analysis & Forecast, by Region, 2017–2031
9.1.1. North America
9.1.2. Europe
9.1.3. Asia Pacific
9.1.4. Middle East & Africa
9.1.5. South America
9.2. Market Attractiveness Analysis, by Region
10. North America Quartz Crystal Market Analysis and Forecast
10.1. Market Snapshot
10.2. Drivers and Restraints: Impact Analysis
10.3. Quartz Crystal Market Size (US$ Bn) and Volume (Million Units) Analysis & Forecast, by Frequency, 2017–2031
10.3.1. KHz
10.3.2. MHz
10.4. Quartz Crystal Market Size (US$ Bn) and Volume (Million Units) Analysis & Forecast, by Crystal Cut, 2017–2031
10.4.1. AT Cut
10.4.2. BT Cut
10.4.3. SC Cut
10.4.4. Others (FC, AK, CT etc.)
10.5. Quartz Crystal Market Size (US$ Bn) Analysis & Forecast, by Application, 2017–2031
10.5.1. Automotive MCU
10.5.2. In-Vehicle Infotainment System
10.5.3. Communication and Test Equipment
10.5.4. Lighting Fixtures
10.5.5. HDDs/SSDs
10.5.6. Wearables
10.5.7. Others
10.6. Quartz Crystal Market Size (US$ Bn) Analysis & Forecast, by End-use Industry, 2017–2031
10.6.1. IT & Telecommunication
10.6.2. Consumer Electronics
10.6.3. Aerospace & Defense
10.6.4. Healthcare
10.6.5. Automotive
10.6.6. Industrial
10.6.7. Others
10.7. Quartz Crystal Market Size (US$ Bn) and Volume (Million Units) Analysis & Forecast, by Country and Sub-region, 2017–2031
10.7.1. The U.S.
10.7.2. Canada
10.7.3. Rest of North America
10.8. Market Attractiveness Analysis
10.8.1. By Frequency
10.8.2. By Crystal Cut
10.8.3. By Application
10.8.4. By End-use Industry
10.8.5. By Country/Sub-region
11. Europe Quartz Crystal Market Analysis and Forecast
11.1. Market Snapshot
11.2. Drivers and Restraints: Impact Analysis
11.3. Quartz Crystal Market Size (US$ Bn) and Volume (Million Units) Analysis & Forecast, by Frequency, 2017–2031
11.3.1. KHz
11.3.2. MHz
11.4. Quartz Crystal Market Size (US$ Bn) and Volume (Million Units) Analysis & Forecast, by Crystal Cut, 2017–2031
11.4.1. AT Cut
11.4.2. BT Cut
11.4.3. SC Cut
11.4.4. Others (FC, AK, CT etc.)
11.5. Quartz Crystal Market Size (US$ Bn) Analysis & Forecast, by Application, 2017–2031
11.5.1. Automotive MCU
11.5.2. In-Vehicle Infotainment System
11.5.3. Communication and Test Equipment
11.5.4. Lighting Fixtures
11.5.5. HDDs/SSDs
11.5.6. Wearables
11.5.7. Others
11.6. Quartz Crystal Market Size (US$ Bn) Analysis & Forecast, by End-use Industry, 2017–2031
11.6.1. IT & Telecommunication
11.6.2. Consumer Electronics
11.6.3. Aerospace & Defense
11.6.4. Healthcare
11.6.5. Automotive
11.6.6. Industrial
11.6.7. Others
11.7. Quartz Crystal Market Size (US$ Bn) and Volume (Million Units) Analysis & Forecast, by Country and Sub-region, 2017–2031
11.7.1. The U.K.
11.7.2. Germany
11.7.3. France
11.7.4. Rest of Europe
11.8. Market Attractiveness Analysis
11.8.1. By Frequency
11.8.2. By Crystal Cut
11.8.3. By Application
11.8.4. By End-use Industry
11.8.5. By Country/Sub-region
12. Asia Pacific Quartz Crystal Market Analysis and Forecast
12.1. Market Snapshot
12.2. Drivers and Restraints: Impact Analysis
12.3. Quartz Crystal Market Size (US$ Bn) and Volume (Million Units) Analysis & Forecast, by Frequency, 2017–2031
12.3.1. KHz
12.3.2. MHz
12.4. Quartz Crystal Market Size (US$ Bn) and Volume (Million Units) Analysis & Forecast, by Crystal Cut, 2017–2031
12.4.1. AT Cut
12.4.2. BT Cut
12.4.3. SC Cut
12.4.4. Others (FC, AK, CT etc.)
12.5. Quartz Crystal Market Size (US$ Bn) Analysis & Forecast, by Application, 2017–2031
12.5.1. Automotive MCU
12.5.2. In-Vehicle Infotainment System
12.5.3. Communication and Test Equipment
12.5.4. Lighting Fixtures
12.5.5. HDDs/SSDs
12.5.6. Wearables
12.5.7. Others
12.6. Quartz Crystal Market Size (US$ Bn) Analysis & Forecast, by End-use Industry, 2017–2031
12.6.1. IT & Telecommunication
12.6.2. Consumer Electronics
12.6.3. Aerospace & Defense
12.6.4. Healthcare
12.6.5. Automotive
12.6.6. Industrial
12.6.7. Others
12.7. Quartz Crystal Market Size (US$ Bn) and Volume (Million Units) Analysis & Forecast, by Country and Sub-region, 2017–2031
12.7.1. China
12.7.2. Japan
12.7.3. India
12.7.4. South Korea
12.7.5. ASEAN
12.7.6. Rest of Asia Pacific
12.8. Market Attractiveness Analysis
12.8.1. By Frequency
12.8.2. By Crystal Cut
12.8.3. By Application
12.8.4. By End-use Industry
12.8.5. By Country/Sub-region
13. Middle East & Africa Quartz Crystal Market Analysis and Forecast
13.1. Market Snapshot
13.2. Drivers and Restraints: Impact Analysis
13.3. Quartz Crystal Market Size (US$ Bn) and Volume (Million Units) Analysis & Forecast, by Frequency, 2017–2031
13.3.1. KHz
13.3.2. MHz
13.4. Quartz Crystal Market Size (US$ Bn) and Volume (Million Units) Analysis & Forecast, by Crystal Cut, 2017–2031
13.4.1. AT Cut
13.4.2. BT Cut
13.4.3. SC Cut
13.4.4. Others (FC, AK, CT etc.)
13.5. Quartz Crystal Market Size (US$ Bn) Analysis & Forecast, by Application, 2017–2031
13.5.1. Automotive MCU
13.5.2. In-Vehicle Infotainment System
13.5.3. Communication and Test Equipment
13.5.4. Lighting Fixtures
13.5.5. HDDs/SSDs
13.5.6. Wearables
13.5.7. Others
13.6. Quartz Crystal Market Size (US$ Bn) Analysis & Forecast, by End-use Industry, 2017–2031
13.6.1. IT & Telecommunication
13.6.2. Consumer Electronics
13.6.3. Aerospace & Defense
13.6.4. Healthcare
13.6.5. Automotive
13.6.6. Industrial
13.6.7. Others
13.7. Quartz Crystal Market Size (US$ Bn) and Volume (Million Units) Analysis & Forecast, by Country and Sub-region, 2017–2031
13.7.1. GCC
13.7.2. South Africa
13.7.3. Rest of Middle East & Africa
13.8. Market Attractiveness Analysis
13.8.1. By Frequency
13.8.2. By Crystal Cut
13.8.3. By Application
13.8.4. By End-use Industry
13.8.5. By Country/Sub-region
14. South America Quartz Crystal Market Analysis and Forecast
14.1. Market Snapshot
14.2. Drivers and Restraints: Impact Analysis
14.3. Quartz Crystal Market Size (US$ Bn) and Volume (Million Units) Analysis & Forecast, by Frequency, 2017–2031
14.3.1. KHz
14.3.2. MHz
14.4. Quartz Crystal Market Size (US$ Bn) and Volume (Million Units) Analysis & Forecast, by Crystal Cut, 2017–2031
14.4.1. AT Cut
14.4.2. BT Cut
14.4.3. SC Cut
14.4.4. Others (FC, AK, CT etc.)
14.5. Quartz Crystal Market Size (US$ Bn) Analysis & Forecast, by Application, 2017–2031
14.5.1. Automotive MCU
14.5.2. In-Vehicle Infotainment System
14.5.3. Communication and Test Equipment
14.5.4. Lighting Fixtures
14.5.5. HDDs/SSDs
14.5.6. Wearables
14.5.7. Others
14.6. Quartz Crystal Market Size (US$ Bn) Analysis & Forecast, by End-use Industry, 2017–2031
14.6.1. IT & Telecommunication
14.6.2. Consumer Electronics
14.6.3. Aerospace & Defense
14.6.4. Healthcare
14.6.5. Automotive
14.6.6. Industrial
14.6.7. Others
14.7. Quartz Crystal Market Size (US$ Bn) and Volume (Million Units) Analysis & Forecast, by Country and Sub-region, 2017–2031
14.7.1. Brazil
14.7.2. Rest of South America
14.8. Market Attractiveness Analysis
14.8.1. By Frequency
14.8.2. By Crystal Cut
14.8.3. By Application
14.8.4. By End-use Industry
14.8.5. By Country/Sub-region
15. Competition Assessment
15.1. Global Quartz Crystal Market Competition Matrix - a Dashboard View
15.1.1. Global Quartz Crystal Market Company Share Analysis, by Value (2021)
15.1.2. Technological Differentiator
16. Company Profiles (Global Manufacturers/Suppliers)
16.1. Abracon
16.1.1. Overview
16.1.2. Product Portfolio
16.1.3. Sales Footprint
16.1.4. Key Subsidiaries or Distributors
16.1.5. Strategy and Recent Developments
16.1.6. Key Financials
16.2. ACTE A/S
16.2.1. Overview
16.2.2. Product Portfolio
16.2.3. Sales Footprint
16.2.4. Key Subsidiaries or Distributors
16.2.5. Strategy and Recent Developments
16.2.6. Key Financials
16.3. Diodes Incorporated
16.3.1. Overview
16.3.2. Product Portfolio
16.3.3. Sales Footprint
16.3.4. Key Subsidiaries or Distributors
16.3.5. Strategy and Recent Developments
16.3.6. Key Financials
16.4. DK Photonics
16.4.1. Overview
16.4.2. Product Portfolio
16.4.3. Sales Footprint
16.4.4. Key Subsidiaries or Distributors
16.4.5. Strategy and Recent Developments
16.4.6. Key Financials
16.5. KYOCERA Crystal Device Corporation
16.5.1. Overview
16.5.2. Product Portfolio
16.5.3. Sales Footprint
16.5.4. Key Subsidiaries or Distributors
16.5.5. Strategy and Recent Developments
16.5.6. Key Financials
16.6. Micro Crystal AG
16.6.1. Overview
16.6.2. Product Portfolio
16.6.3. Sales Footprint
16.6.4. Key Subsidiaries or Distributors
16.6.5. Strategy and Recent Developments
16.6.6. Key Financials
16.7. Microchip Technology Inc.
16.7.1. Overview
16.7.2. Product Portfolio
16.7.3. Sales Footprint
16.7.4. Key Subsidiaries or Distributors
16.7.5. Strategy and Recent Developments
16.7.6. Key Financials
16.8. Nihon Dempa Kogyo Co., Ltd.
16.8.1. Overview
16.8.2. Product Portfolio
16.8.3. Sales Footprint
16.8.4. Key Subsidiaries or Distributors
16.8.5. Strategy and Recent Developments
16.8.6. Key Financials
16.9. RIVER ELETEC CORPORATION
16.9.1. Overview
16.9.2. Product Portfolio
16.9.3. Sales Footprint
16.9.4. Key Subsidiaries or Distributors
16.9.5. Strategy and Recent Developments
16.9.6. Key Financials
16.10. Seiko Epson Corporation
16.10.1. Overview
16.10.2. Product Portfolio
16.10.3. Sales Footprint
16.10.4. Key Subsidiaries or Distributors
16.10.5. Strategy and Recent Developments
16.10.6. Key Financials
16.11. SiTime Corporation
16.11.1. Overview
16.11.2. Product Portfolio
16.11.3. Sales Footprint
16.11.4. Key Subsidiaries or Distributors
16.11.5. Strategy and Recent Developments
16.11.6. Key Financials
16.12. TXC Corporation
16.12.1. Overview
16.12.2. Product Portfolio
16.12.3. Sales Footprint
16.12.4. Key Subsidiaries or Distributors
16.12.5. Strategy and Recent Developments
16.12.6. Key Financials
17. Recommendation
17.1. Opportunity Assessment
17.1.1. By Frequency
17.1.2. By Crystal Cut
17.1.3. By Application
17.1.4. By End-use Industry
17.1.5. By Region
List of Tables
Table 01: Global Quartz Crystal Market Size & Forecast, by Frequency, Value (US$ Bn), 2017‒2031
Table 02: Global Quartz Crystal Market Size & Forecast, by Frequency, Volume (Million Units), 2017‒2031
Table 03: Global Quartz Crystal Market Size & Forecast, by Crystal Cut, Value (US$ Bn), 2017‒2031
Table 04: Global Quartz Crystal Market Size & Forecast, by Crystal Cut, Volume (Million Units), 2017‒2031
Table 05: Global Quartz Crystal Market Size & Forecast, by Applications, Value (US$ Bn), 2017‒2031
Table 06: Global Quartz Crystal Market Size & Forecast, by End-use Industry, Value (US$ Bn), 2017‒2031
Table 07: Global Quartz Crystal Market Size & Forecast, by Region, Value (US$ Bn), 2017‒2031
Table 08: Global Quartz Crystal Market Size & Forecast, by Region, Volume (Million Units), 2017‒2031
Table 09: North America Quartz Crystal Market Size & Forecast, by Frequency, Value (US$ Bn), 2017‒2031
Table 10: North America Quartz Crystal Market Size & Forecast, by Frequency, Volume (Million Units), 2017‒2031
Table 11: North America Quartz Crystal Market Size & Forecast, by Crystal Cut, Value (US$ Bn), 2017‒2031
Table 12: North America Quartz Crystal Market Size & Forecast, by Crystal Cut, Volume (Million Units), 2017‒2031
Table 13: North America Quartz Crystal Market Size & Forecast, by Applications, Value (US$ Bn), 2017‒2031
Table 14: North America Quartz Crystal Market Size & Forecast, by End-use Industry, Value (US$ Bn), 2017‒2031
Table 15: North America Quartz Crystal Market Size & Forecast, by Country, Value (US$ Bn), 2017‒2031
Table 16: North America Quartz Crystal Market Size & Forecast, by Country, Volume (Million Units), 2017‒2031
Table 17: Europe Quartz Crystal Market Size & Forecast, by Frequency, Value (US$ Bn), 2017‒2031
Table 18: Europe Quartz Crystal Market Size & Forecast, by Frequency, Volume (Million Units), 2017‒2031
Table 19: Europe Quartz Crystal Market Size & Forecast, by Crystal Cut, Value (US$ Bn), 2017‒2031
Table 20: Europe Quartz Crystal Market Size & Forecast, by Crystal Cut, Volume (Million Units), 2017‒2031
Table 21: Europe Quartz Crystal Market Size & Forecast, by Applications, Value (US$ Bn), 2017‒2031
Table 22: Europe Quartz Crystal Market Size & Forecast, by End-use Industry, Value (US$ Bn), 2017‒2031
Table 23: Europe Quartz Crystal Market Size & Forecast, by Country and Sub-region, Value (US$ Bn), 2017‒2031
Table 24: Europe Quartz Crystal Market Size & Forecast, by Country and Sub-region, Volume (Million Units), 2017‒2031
Table 25: Asia Pacific Quartz Crystal Market Size & Forecast, by Frequency, Value (US$ Bn), 2017‒2031
Table 26: Asia Pacific Quartz Crystal Market Size & Forecast, by Frequency, Volume (Million Units), 2017‒2031
Table 27: Asia Pacific Quartz Crystal Market Size & Forecast, by Crystal Cut, Value (US$ Bn), 2017‒2031
Table 28: Asia Pacific Quartz Crystal Market Size & Forecast, by Crystal Cut, Volume (Million Units), 2017‒2031
Table 29: Asia Pacific Quartz Crystal Market Size & Forecast, by Applications, Value (US$ Bn), 2017‒2031
Table 30: Asia Pacific Quartz Crystal Market Size & Forecast, by End-use Industry, Value (US$ Bn), 2017‒2031
Table 31: Asia Pacific Quartz Crystal Market Size & Forecast, by Country and Sub-region, Value (US$ Bn), 2017‒2031
Table 32: Asia Pacific Quartz Crystal Market Size & Forecast, by Country and Sub-region, Volume (Million Units), 2017‒2031
Table 33: Middle East & Africa Quartz Crystal Market Size & Forecast, by Frequency, Value (US$ Bn), 2017‒2031
Table 34: Middle East & Africa Quartz Crystal Market Size & Forecast, by Frequency, Volume (Million Units), 2017‒2031
Table 35: Middle East & Africa Quartz Crystal Market Size & Forecast, by Crystal Cut, Value (US$ Bn), 2017‒2031
Table 36: Middle East & Africa Quartz Crystal Market Size & Forecast, by Crystal Cut, Volume (Million Units), 2017‒2031
Table 37: Middle East & Africa Quartz Crystal Market Size & Forecast, by Applications, Value (US$ Bn), 2017‒2031
Table 38: Middle East & Africa Quartz Crystal Market Size & Forecast, by End-use Industry, Value (US$ Bn), 2017‒2031
Table 39: Middle East & Africa (MEA) Quartz Crystal Market Size & Forecast, by Country and Sub-region, Value (US$ Bn), 2017‒2031
Table 40: Middle East & Africa (MEA) Quartz Crystal Market Size & Forecast, by Country and Sub-region, Volume (Million Units), 2017‒2031
Table 41: South America Quartz Crystal Market Size & Forecast, by Frequency, Value (US$ Bn), 2017‒2031
Table 42: South America Quartz Crystal Market Size & Forecast, by Frequency, Volume (Million Units), 2017‒2031
Table 43: South America Quartz Crystal Market Size & Forecast, by Crystal Cut, Value (US$ Bn), 2017‒2031
Table 44: South America Quartz Crystal Market Size & Forecast, by Crystal Cut, Volume (Million Units), 2017‒2031
Table 45: South America Quartz Crystal Market Size & Forecast, by Applications, Value (US$ Bn), 2017‒2031
Table 46: South America Quartz Crystal Market Size & Forecast, by End-use Industry, Value (US$ Bn), 2017‒2031
Table 47: South America Quartz Crystal Market Size & Forecast, by Country and Sub-region, Value (US$ Bn), 2017‒2031
Table 48: South America Quartz Crystal Market Size & Forecast, by Country and Sub-region, Volume (Million Units), 2017‒2031
List of Figures
Figure 01: Global Quartz Crystal Market Size & Forecast, Value (US$ Bn ), 2017‒2031
Figure 02: Global Quartz Crystal Market Size & Forecast, Volume (Million Units), 2017‒2031
Figure 03: Global Quartz Crystal Market, Y-o-Y, 2017‒2031
Figure 04: Global Quartz Crystal Price Trend, 2017‒2031
Figure 05: Global Quartz Crystal Market Size & Forecast, by Frequency, Value (US$ Bn), 2017‒2031
Figure 06: Global Quartz Crystal Market Attractiveness, by Frequency, Value (US$ Bn), 2022‒2031
Figure 07: Global Quartz Crystal Market Share Analysis, by Frequency, 2021 and 2031
Figure 08: Global Quartz Crystal Market Size & Forecast, by Crystal Cut, Value (US$ Bn), 2017‒2031
Figure 09: Global Quartz Crystal Market Attractiveness, by Crystal Cut, Value (US$ Bn), 2022‒2031
Figure 10: Global Quartz Crystal Market Share Analysis, by Crystal Cut, 2021 and 2031
Figure 11: Global Quartz Crystal Market Size & Forecast, by Applications, Value (US$ Bn), 2017‒2031
Figure 12: Global Quartz Crystal Market Attractiveness, by Applications, Value (US$ Bn), 2022‒2031
Figure 13: Global Quartz Crystal Market Share Analysis, by Applications, 2021 and 2031
Figure 14: Global Quartz Crystal Market Size & Forecast, by End-use Industry, Value (US$ Bn), 2017‒2031
Figure 15: Global Quartz Crystal Market Attractiveness, by End-use Industry, Value (US$ Bn), 2022‒2031
Figure 16: Global Quartz Crystal Market Share Analysis, by End-use Industry, 2021 and 2031
Figure 17: Global Quartz Crystal Market Size & Forecast, by Region, Value (US$ Bn), 2017‒2031
Figure 18: Global Quartz Crystal Market Attractiveness, by Region, Value (US$ Bn), 2022‒2031
Figure 19: Global Quartz Crystal Market Share Analysis, by Region, 2021 and 2031
Figure 20: North America Quartz Crystal Market Size & Forecast, Value (US$ Bn ), 2017‒2031
Figure 21: North America Quartz Crystal Market Size & Forecast, Volume (Million Units), 2017‒2031
Figure 22: North America Quartz Crystal Market, Value (US$ Bn), 2017‒2031
Figure 23: North America Quartz Crystal Price Trend, 2017‒2031
Figure 24: North America Quartz Crystal Market Size & Forecast, by Frequency, Value (US$ Bn), 2017‒2031
Figure 25: North America Quartz Crystal Market Attractiveness, by Frequency, Value (US$ Bn), 2022‒2031
Figure 26: North America Quartz Crystal Market Share Analysis, by Frequency, 2021 and 2031
Figure 27: North America Quartz Crystal Market Size & Forecast, by Crystal Cut, Value (US$ Bn), 2017‒2031
Figure 28: North America Quartz Crystal Market Attractiveness, by Crystal Cut, Value (US$ Bn), 2022‒2031
Figure 29: North America Quartz Crystal Market Share Analysis, by Crystal Cut, 2021 and 2031
Figure 30: North America Quartz Crystal Market Size & Forecast, by Applications, Value (US$ Bn), 2017‒2031
Figure 31: North America Quartz Crystal Market Attractiveness, by Applications, Value (US$ Bn), 2022‒2031
Figure 32: North America Quartz Crystal Market Share Analysis, by Applications, 2021 and 2031
Figure 33: North America Quartz Crystal Market Size & Forecast, by End-use Industry, Value (US$ Bn), 2017‒2031
Figure 34: North America Quartz Crystal Market Attractiveness, by End-use Industry, Value (US$ Bn), 2022‒2031
Figure 35: North America Quartz Crystal Market Share Analysis, by End-use Industry, 2021 and 2031
Figure 36: North America Quartz Crystal Market Size & Forecast, by Country, Value (US$ Bn), 2017‒2031
Figure 37: North America Quartz Crystal Market Attractiveness, by Country, Value (US$ Bn), 2022‒2031
Figure 38: North America Quartz Crystal Market Share Analysis, by Country, 2021 and 2031
Figure 39: Europe Quartz Crystal Market Size & Forecast, Value (US$ Bn ), 2017‒2031
Figure 40: Europe Quartz Crystal Market Size & Forecast, Volume (Million Units), 2017‒2031
Figure 41: Europe Quartz Crystal Market, Y-o-Y, 2017‒2031
Figure 42: Europe Quartz Crystal Price Trend, 2017‒2031
Figure 43: Europe Quartz Crystal Market Size & Forecast, by Frequency, Value (US$ Bn), 2017‒2031
Figure 44: Europe Quartz Crystal Market Attractiveness, by Frequency, Value (US$ Bn), 2022‒2031
Figure 45: Europe Quartz Crystal Market Share Analysis, by Frequency, 2021 and 2031
Figure 46: Europe Quartz Crystal Market Size & Forecast, by Crystal Cut, Value (US$ Bn), 2017‒2031
Figure 47: Europe Quartz Crystal Market Attractiveness, by Crystal Cut, Value (US$ Bn), 2022‒2031
Figure 48: Europe Quartz Crystal Market Share Analysis, by Crystal Cut, 2021 and 2031
Figure 49: Europe Quartz Crystal Market Size & Forecast, by Applications, Value (US$ Bn), 2017‒2031
Figure 50: Europe Quartz Crystal Market Attractiveness, by Applications, Value (US$ Bn), 2022‒2031
Figure 51: Europe Quartz Crystal Market Share Analysis, by Applications, 2021 and 2031
Figure 52: Europe Quartz Crystal Market Size & Forecast, by End-use Industry, Value (US$ Bn), 2017‒2031
Figure 53: Europe Quartz Crystal Market Attractiveness, by End-use Industry, Value (US$ Bn), 2022‒2031
Figure 54: Europe Quartz Crystal Market Share Analysis, by End-use Industry, 2021 and 2031
Figure 55: Europe Quartz Crystal Market Size & Forecast, by Country and Sub-region, Value (US$ Bn), 2017‒2031
Figure 56: Europe Quartz Crystal Market Attractiveness, by Country and Sub-region, Value (US$ Bn), 2022‒2031
Figure 57: Europe Quartz Crystal Market Share Analysis, by Country and Sub-region, 2021 and 2031
Figure 58: Asia Pacific Quartz Crystal Market Size & Forecast, Value (US$ Bn ), 2017‒2031
Figure 59: Asia Pacific Quartz Crystal Market Size & Forecast, Volume (Million Units), 2017‒2031
Figure 60: Asia Pacific Quartz Crystal Market, Y-o-Y, 2017‒2031
Figure 61: Asia Pacific Quartz Crystal Price Trend, 2017‒2031
Figure 62: Asia Pacific Quartz Crystal Market Size & Forecast, by Frequency, Value (US$ Bn), 2017‒2031
Figure 63: Asia Pacific Quartz Crystal Market Attractiveness, by Frequency, Value (US$ Bn), 2022‒2031
Figure 64: Asia Pacific Quartz Crystal Market Share Analysis, by Frequency, 2021 and 2031
Figure 65: Asia Pacific Quartz Crystal Market Size & Forecast, by Crystal Cut, Value (US$ Bn), 2017‒2031
Figure 66: Asia Pacific Quartz Crystal Market Attractiveness, by Crystal Cut, Value (US$ Bn), 2022‒2031
Figure 67: Asia Pacific Quartz Crystal Market Share Analysis, by Crystal Cut, 2021 and 2031
Figure 68: Asia Pacific Quartz Crystal Market Size & Forecast, by Applications, Value (US$ Bn), 2017‒2031
Figure 69: Asia Pacific Quartz Crystal Market Attractiveness, by Applications, Value (US$ Bn), 2022‒2031
Figure 70: Asia Pacific Quartz Crystal Market Share Analysis, by Applications, 2021 and 2031
Figure 71: Asia Pacific Quartz Crystal Market Size & Forecast, by End-use Industry, Value (US$ Bn), 2017‒2031
Figure 72: Asia Pacific Quartz Crystal Market Attractiveness, by End-use Industry, Value (US$ Bn), 2022‒2031
Figure 73: Asia Pacific Quartz Crystal Market Share Analysis, by End-use Industry, 2021 and 2031
Figure 74: Asia Pacific Quartz Crystal Market Size & Forecast, by Country and Sub-region, Value (US$ Bn), 2017‒2031
Figure 75: Asia Pacific Quartz Crystal Market Attractiveness, by Country and Sub-region, Value (US$ Bn), 2022‒2031
Figure 76: Asia Pacific Quartz Crystal Market Share Analysis, by Country and Sub-region, 2021 and 2031
Figure 77: Middle East & Africa Quartz Crystal Market Size & Forecast, Value (US$ Bn ), 2017‒2031
Figure 78: Middle East & Africa Quartz Crystal Market Size & Forecast, Volume (Million Units), 2017‒2031
Figure 79: Middle East & Africa Quartz Crystal Market, Y-o-Y, 2017‒2031
Figure 80: Middle East & Africa Quartz Crystal Price Trend, 2017‒2031
Figure 81: Middle East & Africa Quartz Crystal Market Size & Forecast, by Frequency, Value (US$ Bn), 2017‒2031
Figure 82: Middle East & Africa Quartz Crystal Market Attractiveness, by Frequency, Value (US$ Bn), 2022‒2031
Figure 83: Middle East & Africa Quartz Crystal Market Share Analysis, by Frequency, 2021 and 2031
Figure 84: Middle East & Africa Quartz Crystal Market Size & Forecast, by Crystal Cut, Value (US$ Bn), 2017‒2031
Figure 85: Middle East & Africa Quartz Crystal Market Attractiveness, by Crystal Cut, Value (US$ Bn), 2022‒2031
Figure 86: Middle East & Africa Quartz Crystal Market Share Analysis, by Crystal Cut, 2021 and 2031
Figure 87: Middle East & Africa Quartz Crystal Market Size & Forecast, by Applications, Value (US$ Bn), 2017‒2031
Figure 88: Middle East & Africa Quartz Crystal Market Attractiveness, by Applications, Value (US$ Bn), 2022‒2031
Figure 89: Middle East & Africa Quartz Crystal Market Share Analysis, by Applications, 2021 and 2031
Figure 90: Middle East & Africa Quartz Crystal Market Size & Forecast, by End-use Industry, Value (US$ Bn), 2017‒2031
Figure 91: Middle East & Africa Quartz Crystal Market Attractiveness, by End-use Industry, Value (US$ Bn), 2022‒2031
Figure 92: Middle East & Africa Quartz Crystal Market Share Analysis, by End-use Industry, 2021 and 2031
Figure 93: Middle East & Africa Quartz Crystal Market Size & Forecast, by Country and Sub-region, Value (US$ Bn), 2017‒2031
Figure 94: Middle East & Africa Quartz Crystal Market Attractiveness, by Country and Sub-region, Value (US$ Bn), 2022‒2031
Figure 95: Middle East & Africa Quartz Crystal Market Share Analysis, by Country and Sub-region, 2021 and 2031
Figure 96: South America Quartz Crystal Market Size & Forecast, Value (US$ Bn ), 2017‒2031
Figure 97: South America Quartz Crystal Market Size & Forecast, Volume (Million Units), 2017‒2031
Figure 98: South America Quartz Crystal Market, Value (US$ Bn), 2017‒2031
Figure 99: South Africa Quartz Crystal Price Trend, 2017‒2031
Figure 100: South America Quartz Crystal Market Size & Forecast, by Frequency, Value (US$ Bn), 2017‒2031
Figure 101: South America Quartz Crystal Market Attractiveness, by Frequency, Value (US$ Bn), 2022‒2031
Figure 102: South America Quartz Crystal Market Share Analysis, by Frequency, 2021 and 2031
Figure 103: South America Quartz Crystal Market Size & Forecast, by Crystal Cut, Value (US$ Bn), 2017‒2031
Figure 104: South America Quartz Crystal Market Attractiveness, by Crystal Cut, Value (US$ Bn), 2022‒2031
Figure 105: South America Quartz Crystal Market Share Analysis, by Crystal Cut, 2021 and 2031
Figure 106: South America Quartz Crystal Market Size & Forecast, by Applications, Value (US$ Bn), 2017‒2031
Figure 107: South America Quartz Crystal Market Attractiveness, by Applications, Value (US$ Bn), 2022‒2031
Figure 108: South America Quartz Crystal Market Share Analysis, by Applications, 2021 and 2031
Figure 109: South America Quartz Crystal Market Size & Forecast, by End-use Industry, Value (US$ Bn), 2017‒2031
Figure 110: South America Quartz Crystal Market Attractiveness, by End-use Industry, Value (US$ Bn), 2022‒2031
Figure 111: South America Quartz Crystal Market Share Analysis, by End-use Industry, 2021 and 2031
Figure 112: South America Quartz Crystal Market Size & Forecast, by Country and Sub-region, Value (US$ Bn), 2017‒2031
Figure 113: South America Quartz Crystal Market Attractiveness, by Country and Sub-region, Value (US$ Bn), 2022‒2031
Figure 114: South America Quartz Crystal Market Share Analysis, by Country and Sub-region, 2021 and 2031
Copyright © Transparency Market Research, Inc. All Rights reserved
Trust Online


Quartz Crystal Market