 Ryuji Hatsuki1
 Ayae Honda
 Takatoki Yamamoto
- 1Department of Mechanical and Control Engineering, Tokyo Institute of Technology, Tokyo, Japan
- 2Faculty of Bioscience and Applied Chemistry, Housei University, Tokyo, Japan
- 3Department of Bioscience, Teikyo University, Tochigi, Japan
Our living sphere is constantly exposed to a wide range of pathogenic viruses, which can be either known, or of novel origin. Currently, there is no methodology for continuously monitoring the environment for viruses in general, much less a methodology that allows the rapid and sensitive identification of a wide variety of viruses responsible for communicable diseases. Traditional approaches, based on PCR and immunodetection systems, only detect known or specifically targeted viruses. We here describe a simple device that can potentially detect any virus between nanogap electrodes using nonlinear impedance spectroscopy. Three test viruses, differing in shape and size, were used to demonstrate the general applicability of this approach: baculovirus, tobacco mosaic virus (TMV), and influenza virus. We show that each of the virus types responded differently in the nanogap to changes in the electric field strength, and the impedance of the virus solutions differed depending both on virus type and virus concentration. These preliminary results show that the three virus types can be distinguished and their approximate concentrations determined. Although further studies are required, the proposed nonlinear impedance spectroscopy method may achieve a sensitivity comparable to that of more traditional, but less versatile, virus detection systems.
Introduction
Our environment is posed a constant threat of exposure by pathogenic viruses, whether to humans or pets, domestic animals, or agricultural and marine products (plants, fish, or shellfish). No established methodology exists for inactivating most viruses that could cause widespread communicable viral infection. It is therefore imperative to realize a technology that can monitor the environment for viruses and prevent their spread and disease transmission. The key is to develop a practical sensor that can continuously monitor the environment for viruses. Such virus sensors could be installed at airports, seaports, and other points of entry, and where necessary at farms and ranches, at restaurants, in air conditioning units, in sewage systems, and in other public facilities or utilities. These sensors would continuously monitor for viruses, and if they were detected, measures could be implemented to prevent infection, in contrast to their existing diagnostic application. In cases where detection and countermeasures are too late to prevent an outbreak of a communicable disease, a network of virus sensors could facilitate rapid identification of affected areas, allowing medical resources to be focused in those areas. This would lead to early-stage detection and treatment, and maximize the efficient use of medical resources.
Currently, there is no technology that can sense viruses in our daily environment. Existing virus detection methods are focused on diagnosing infected individuals, and can be classified into three main categories: (1) those that utilize genomic information and are based on the polymerase chain reaction (PCR) and metagenomic analysis; (2) those that utilize molecular recognition or receptor linking functions of compounds such as antibodies, sugar chains, and peptide aptamers; and (3) those that are based on the electrical or optical properties of viruses (Cheng et al., 2009). In the first category, PCR-based methods provide high detection sensitivity and accuracy but require long analysis times, costly equipment, and specialized techniques, so their range of use is limited in terms of location and qualified personnel (Yang and Rothman, 2004; Espy et al., 2006; Charlton et al., 2009; Hodneland et al., 2011; Cella et al., 2013). In the second category, immunochromatography can provide a relatively fast, simple, and portable means of virus detection in clinical settings such as hospitals, and has therefore become a mainstream technique; however, it suffers from problems such as low sensitivity and accuracy that impede early-stage detection (Lee et al., 1993, 2009; Patolsky et al., 2004; Reichmuth et al., 2008; Heinze et al., 2009; Wang et al., 2009, 2011; Hassen et al., 2011; Lum et al., 2012; Nguyen et al., 2012). Both categories, moreover, basically involve single-use disposable test units, and can only detect known or specifically targeted viruses. In short, neither category is appropriate in principle for application to continuous virus monitoring of the environment, or detecting new or unspecified viruses. Consequently, neither category holds significant promise for the development of a systematic technology for comprehensive environmental virus monitoring.
There have been fewer studies in the third category, which are based on direct measurement of physical properties. The methods in this category are inferior to the other two in terms of sensitivity, and are particularly poor in their ability to selectively distinguish viruses in the presence of numerous contaminants. However, methods in the third category have two key potential advantages: the ability to continuously monitor the environment, and to detect unspecified viruses and mutants, since biological information on genomes or receptors is not required. A high-sensitivity, accurate virus sensor based on direct measurement of physical properties would enable long-term, continuous virus monitoring, which cannot be achieved by the other two categories. This would represent a groundbreaking advance in virus-monitoring technology.
Most virus detection techniques based on physical properties use optical or electrical methods. Typical optical methods use light scattering to achieve high-sensitivity detection to confirm the presence of virus particles. However, optical detection has disadvantages in miniaturization of a complex optical setup and light source (Fan et al., 2008). On hand, electrical method for direct virus detection uses impedance spectroscopy, while another uses dielectric relaxation (Ermolina et al., 2003). Other recent examples include microelectrodes fabricated in microchannels coupled with impedance spectroscopy. This approach is aimed at identifying and quantifying baculovirus and lentivirus in solutions, based on the impedance magnitude at the peak frequency (Poenar et al., 2004). However, the accuracy and sensitivity of these approaches are low compared with PCR-based and immunochromatographic methods, and there have been few publications regarding these techniques.
We investigated the use of impedance spectroscopy for highly sensitive and accurate virus detection based on the nonlinear effect of electrophoretic and dielectrophoretic forces on the virion during measurement to enhance both sensitivity and selectivity. The approach involves applying a sufficiently strong electric field to cause inter-electrode virion movement and allow control of the orientation in the case of non-spherical virions. This active perturbation of the virion allows nonlinear measurement of its properties.
Generally, an electric field of 105 V/m or more is required to induce movement of nanometer-sized particles by dielectrophoretic forces, but an applied voltage of several volts or more ordinarily required for this purpose would also induce prominent electrode reactions that would tend to preclude effective for measurement (Turcu and Lucaciu, 1989; Akin et al., 2004; Liu and Bau, 2004; Yang et al., 2008; Pethig, 2010). To obtain an electric field of 105 V/m or more using a lower applied voltage, we propose the use of nanogap electrodes. For example, it is possible to generate an electric field of 200 kV/m across a 500 nm gap using an applied voltage of 0.1 V, which is too low for electrolysis to occur. This study reports a high-sensitivity virus detection method by nonlinear impedance spectroscopy with the use of nanogap electrodes to generate strong electric fields under a low applied voltage.
Materials and Methods
Virus Samples
Table 1 shows the shapes and sizes of the three viruses used in this study. The dipole moment induced in a small particle generally depends on its size and shape, and the dipolar effect tends to be particularly strong for long, narrow particles. We therefore used baculovirus, tobacco mosaic virus (TMV), and influenza virus [influenza A (H1N1)] as sample viruses with different sizes and long/short axis ratios. The baculovirus is rod-shaped, with a diameter of 30–60 nm and a length of approximately 260 nm (Burley et al., 1982; Choi et al., 2012). The TMV is approximately 20 nm in diameter and 300 nm in length (Klug, 1999), and the influenza A (H1N1) virus is spherical with a diameter of approximately 100 nm (Tiffany and Blough, 1970; Sai et al., 2011).
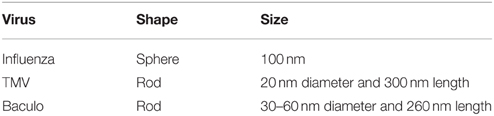
Table 1. Dimensions of viruses used in this study.
Quantification of Virus
To date, virus concentrations is generally determined based on the tissue culture infective dose (TCID50) or plaque forming units (PFU) leaving the number of virions is unclear, making it difficult to quantify the sensitivity of the sensing and to compare the results with those of other methods. To prevent this problem, we first visualized and counted the number of virions by fluorescence labeling and observation, then expressed the concentration in terms of virions per unit volume. 1 mM KCl buffer was used, and a fluorescent dye (SYBR-GOLD, Invitrogen Inc.) was added to solution for labeling the viruses. The labeled virions were counted under a fluorescence microscope. Figure 1 shows a typical result, with each bright spot representing a single baculovirion. The virion concentrations were estimated from the bright spot counts using image analysis software (Image J) (Schneider et al., 2012).
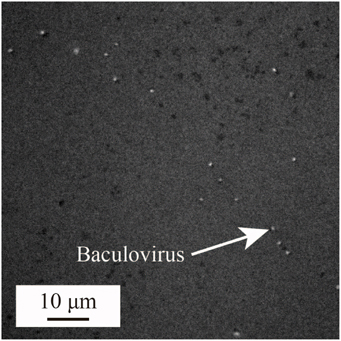
Figure 1. Scanning electron microscopy of baculovirus used for counting the number of virions.
Device Fabrication
Figures 2A,B show top and cross-sectional schematic views of the measurement device. The device is basically fabricated on a quartz substrate patterned with two nanogap electrodes, a polydimethylsiloxane (PDMS) sheet forming the measurement chamber wall, and a glass plate as the chamber lid. The nanogap electrodes were patterned with an Au (250 nm)/Ti (1 nm) layer in strip fabricated by photolithographic lift-off, and the strip was then cut to form opposing electrodes with an intervening nanogap using a focused ion beam (FIB; FB-2200, Hitachi High-Technologies Corp.) (Hatsuki et al., 2013). Figure 2C shows a scanning ion micrograph of the fabricated measurement region. The small grooves in the quartz substrate between and on both sides of the nanogap are overrun regions for cutting the parallel flat-plate electrodes in the FIB process. The fabricated gold/metal electrodes were 250 nm in height and 5 μm in width, with an intervening gap width of 510 nm. The depth of the groove was about 530 nm in the middle of the nanogap. A hole with a diameter of 3 mm was opened in the 0.2-mm-thick PDMS sheet to form the wall of the cell chamber (approximately 1.5 μL volume) and the sheet was then bonded in position to form the measurement cell. For the impedance measurements, the chamber was filled with the sample solution and closed with the glass lid.
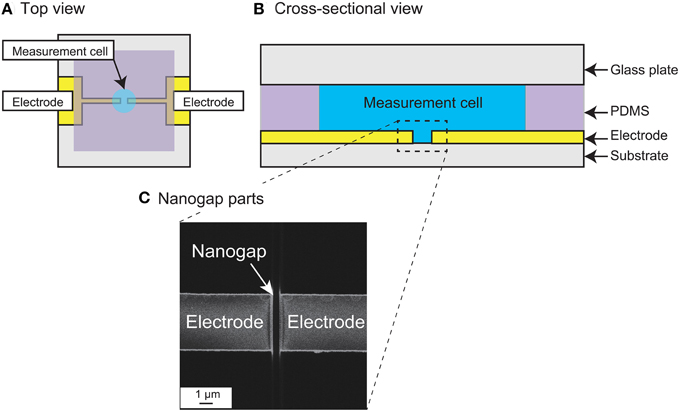
Figure 2. (A) Schematic top view and (B) Cross-sectional view of the measurement device with nanogap electrodes. (C) Scanning ion microscopy image of the measurement region, showing the nanogap electrodes. The gap width is 510 nm.
Impedance Measurements
The impedance was measured using a frequency response analyzer (1260, Solartron Analytical) with a dielectric interface (1296, Solartron Analytical), which were controlled with SMART software (Solartron Analytical), and the data were analyzed using Zview software (Solartron Analytical).
The electrical impedance of liquid samples suffer from several problems, including unavoidable electrode decomposition and substantial changes in the conductivity due to the release of ions, and damages to the virus with these ions in high concentrations. These problems were apparently appeared in low frequency region less than 100 kHz in our preliminary measurements, so that the measurements were conducted in the range 100 kHz–6.3 MHz. Prior to each measurement, open/short calibration was performed, and the effects of parasitic capacitance and other parasitic components, wiring induction coupling, and leakage were eliminated. The applied frequency for all of the measurements was 100 kHz or higher, to prevent background effects from the solid-liquid double layer capacitance that tends to form at the interface of the measuring electrode (Poenar et al., 2004); this layer is large at low frequencies but minimal at high frequencies. The virion impedance component was obtained by subtracting the separately measured impedance component for the 1 mM KCl buffer solution from the total solution impedance; corrected measurements were used in all assessments. Because the repeated measurement of the same sample shows no apparent difference in electrical signal, it is assumed that the application of high electric field of 105 V/m or more would not be significantly damaging to the virus. It is, however, not confirmed whether the effect of high electric field is how much hazardous to the viruses in their biological activities.
Results and Discussion
Impedance Dependence on Electric Field Strength
We first investigated the presence of a nonlinear impedance effect in a strong electric field by measuring the impedance while increasing the electric field strength incrementally from 104 V/m to 2 × 10⁵ V/m, using a baculovirus solution with 1014 virions/mL.
As shown in Figure 3, at frequencies above 1 MHz, the impedance response is very different for an electric field of 100 kV/m (50 mV) or greater than for an electric field of 20 kV/m (10 mV) or less. This is presumably at least partially attributable to the desired effect of the strong nonlinear electric field and the related dielectrophoretic force that generally arises in strong high-frequency electric fields. Many studies have shown that positive dielectrophoresis (in which the force is exerted toward higher field strength) occurs in electric fields of several 100 kV/m to several MV/m with frequencies of several 100 kHz or higher (Morgan and Green, 1997; Morgan et al., 1999; Hughes et al., 2001; Park et al., 2007). This suggests that the virions between the electrodes were moved by this force and aligned their long axes with the field direction due to the torque by the electric field. In some cases, the virions adhered to the electrode edges, where the field strength was maximum in the measurement area, resulting in a nonlinear increase in impedance. However, it was not possible to confirm this mechanism because the excitation light required for fluorescence measurements during the impedance measurements would have introduced noise into the system. At present, therefore, this explanation remains speculation.
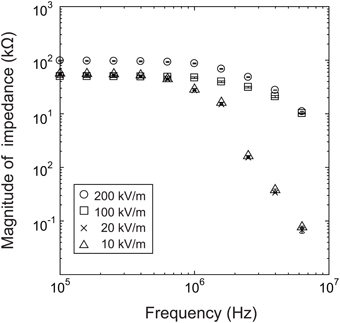
Figure 3. Dependence of impedance response on electric field strength.
In summary, the measurements showed changes in impedance that are presumably a nonlinear effect of an applied electric field of 100 kV/m or higher at a frequency above 1 MHz. In light of these results, we used a field strength of 200 kV/m (100 mV) in the subsequent experiments.
The electric field was designed by the finite element method using the commercially available solver COMSOL 4.4 (COMSOL Inc.). Based on simulation, the region between the electrodes for an electric field of 100 kV/m or higher was obtained with a gap length of 510 nm, an electrode width of 5 μm, and a depth of groove approximately 530 nm, corresponding to a volume of about 1.4 fL. This is a rough estimate due to the errors inherent in the measurements; regardless, for a sample concentration of 1011 virions/mL, this volume would contain approximately 0.3 virions. Under the assumption that the number of virions measured with a sample concentration of 1011 virions/mL would actually be one to several, we set 1011 virions/mL concentration as the lower limit for subsequent experiments.
Impedance Dependence on Virus Concentration
Our investigation of the impedance dependence on virus concentration showed that the impedance varies with virus concentration in the range 1011–1014 virions/mL for baculovirus, TMV, and influenza virus, as shown in Figure 4. In the figure, the solid and dotted lines represent the real and imaginary impedance components, respectively. For the real component, similar behavior is found for the baculovirus and influenza viruses, as shown in Figure 4A and Figure 4C, respectively. The values decrease moderately with increasing frequency between 100 kHz and 1 MHz, then fall sharply at higher frequency, and also generally increase with increasing sample concentration. In contrast, the imaginary component for both viruses shows a peak near 1 MHz that increases in height with increasing sample concentration. As shown in Figure 4C, however, the trends exhibited by TMV clearly differ from those for the baculovirus and influenza viruses. The real impedance component for TMV peaks at 1 MHz, then decreases rapidly at higher frequency. The values generally increase with increasing sample concentration as with the other two viruses, whereas the imaginary impedance component for TMV tends to decrease up to a frequency of 1 MHz, and then increase to a maximum near 3.9 MHz.
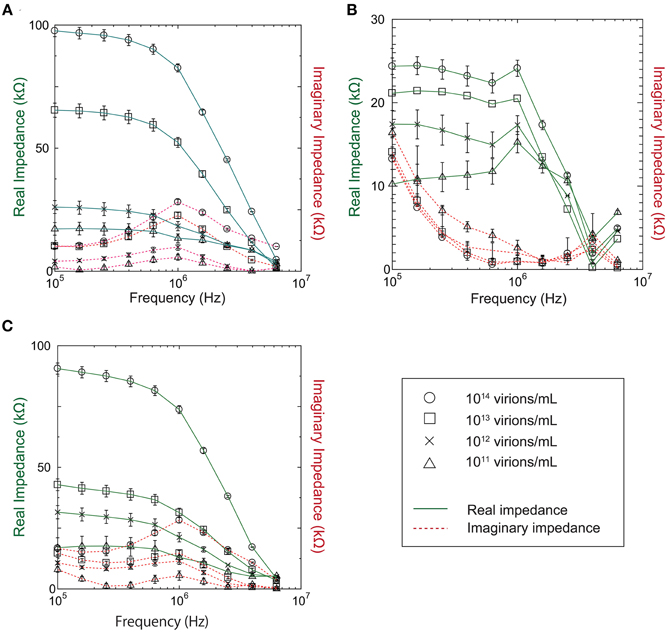
Figure 4. Real and imaginary components of measured impedance for (A) Baculovirus, (B) TMV, and (C) Influenza virus.
As shown in Figure 4, all three viruses showed an impedance peak and transition point near 1 MHz for both the real component and imaginary components. In Figure 5, the vertical and horizontal axes represent the magnitude of the impedance and the virus concentration, respectively. The figure shows the dependence of the impedance magnitude at 1 MHz on the virus concentration for each virus. These results clearly indicate that the impedance values for the three virus types tend to increase with increasing concentration and can therefore be used to quantify the virus concentration.
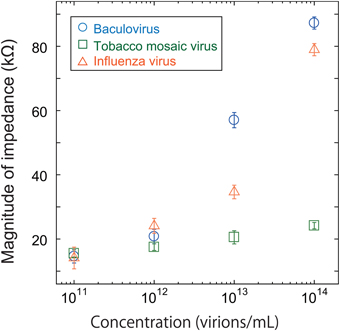
Figure 5. Magnitude of impedance for baculovirus, TMV, and influenza virus solution at 1 MHz. The concentration was varied from 1011 to 1014 virions/mL.
Distinguish Virus Types
It would be difficult to distinguish quantitatively between the three virus types using only the impedance spectra shown in Figure 4. The baculovirus and influenza virus spectra are similar, although they are both distinct from that of TMV.
We therefore compared the three virus types, and particularly the baculovirus and influenza virus, for differences in phase effects. Figure 6 shows the mapped the data obtained for each virus at concentrations of 1011–1014 virions/mL. The horizontal and vertical axes represent the phases of the imaginary impedance component somewhat arbitrarily at 100 kHz and the peak frequency, fp, respectively. Although some overlap is apparent between the three clusters of data points, the graph clearly shows that it is possible to distinguish between virus types on this basis, independent of their concentrations.
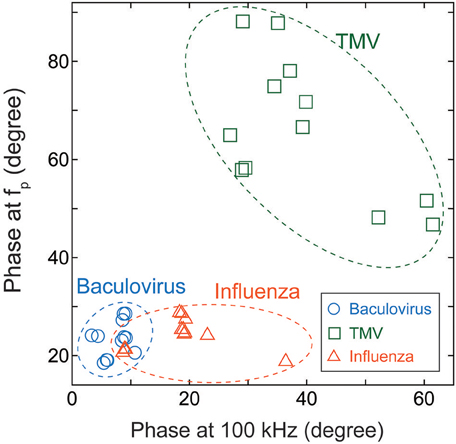
Figure 6. Cluster map of Baculovirus, TMV, and influenza virus. The data were obtained for virus concentrations of 1011–1014 virions/mL, and plotted with the phase at 100 kHz along the horizontal axis and the phase at the peak frequency of the imaginary component of impedance along the vertical axis.
It should be noted, however, that this investigation was performed for only these three viruses, and it would be premature to extrapolate the results to other virus types.
Conclusions
Here we proposed a virus detection method by nonlinear impedance spectroscopy under a strong electric field between two nanogap electrodes.
In sweeping frequencies from 100 Hz to 6.3 MHz while varying the electric field strength, we found an apparently marked nonlinear effect on impedance at electric field strengths of 100 kV/m or higher. Further measurements were performed for those electric field strengths and frequency while varying the concentrations of baculovirus, TMV, and influenza A (H1N1) virus solutions. The data clearly showed that the virus concentration can be quantified by the impedance value. Furthermore, the three virus types could be distinguished by plotting the phase at 100 kHz against the phase of the peak value of the imaginary component of the impedance for each virus type.
At the minimum sample concentration of 1011 virions/mL used in this study, one to several virions occupied the effective measurement space. This is a rough estimate, and a more detailed study is required for verification. The results nevertheless show that the proposed nonlinear impedance spectroscopy method may achieve a sensitivity comparable to that of PCR and immunodetection systems. The response time to sweep the frequency for each measurement was about a few minutes, which will be enough fast for the continuous monitoring of environment. One of the large remaining issues is to evaluate the detection and identification ability of some specific viruses from the heterogeneous mixture of crude sample. That is the universal challenge for any types of biosensing methods, and also the future work to put this method into practical use.
Conflict of Interest Statement
The authors declare that the research was conducted in the absence of any commercial or financial relationships that could be construed as a potential conflict of interest.
Acknowledgments
This work was conducted as part of the Four-University Nano-Micro Fabrication Kawasaki Consortium (Fab-4U) and was supported by Kakenhi Grants-in-Aid (No, 25006605, 25289096) from the Japan Society for the Promotion of Science (JSPS), and partly by CREST, JST.
References
Akin, D., Li, H., and Bashir, R. (2004). Real-time virus trapping and fluorescent imaging in microfluidic devices. Nano Lett. 4, 257–259. doi: 10.1021/nl034987p
Burley, S. K., Miller, A., Harrap, K. A., and Kelly, D. C. (1982). Structure of the baculovirus nucleocapsid. Virology 120, 433–440. doi: 10.1016/0042-6822(82)90043-5
Cella, L. N., Blackstock, D., Yates, M. A., Mulchandani, A., and Chen, W. (2013). Detection of RNA viruses: current technologies and future perspectives. Crit. Rev. Eukaryot. Gene Expr. 23, 125–137. doi: 10.1615/CritRevEukaryotGeneExpr.2013006974
Charlton, B., Crossley, B., and Hietala, S. (2009). Conventional and future diagnostics for avian influenza. Comp. Immunol. Microbiol. Infect. Dis. 32, 341–350. doi: 10.1016/j.cimid.2008.01.009
Cheng, X., Chen, G., and Rodriguez, W. R. (2009). Micro- and nanotechnology for viral detection. Anal. Bioanal. Chem. 393, 487–501. doi: 10.1007/s00216-008-2514-x
Choi, J. Y., Roh, J. Y., Wang, Y., Zhen, Z., Tao, X. Y., Lee, J. H., et al. (2012). Analysis of genes expression of Spodoptera exigua larvae upon AcMNPV infection. PLoS ONE 7:e42462. doi: 10.1371/journal.pone.0042462
Ermolina, I., Morgan, H., Green, N. G., Milner, J. J., and Feldman, Y. (2003). Dielectric spectroscopy of tobacco mosaic virus. Biochim. Biophys. Acta 1622, 57–63. doi: 10.1016/S0304-4165(03)00118-1
Espy, M. J., Uhl, J. R., Sloan, L. M., Buckwalter, S. P., Jones, M. F., Vetter, E. A., et al. (2006). Real-time PCR in clinical microbiology: applications for routine laboratory testing. Clin. Microbiol. Rev. 19, 165–256. doi: 10.1128/CMR.19.1.165-256.2006
Fan, X., White, I. M., Shopova, S. I., Zhu, H., Suter, J. D., and Sun, Y. (2008). Sensitive optical biosensors for unlabeled targets: a review. Anal. Chim. Acta. 6, 8–26. doi: 10.1016/j.aca.2008.05.022
Hassen, W. M., Duplan, V., Frost, E., and Dubowski, J. J. (2011). Quantitation of influenza A virus in the presence of extraneous protein using electrochemical impedance spectroscopy. Electrochim. Acta 56, 8325–8328. doi: 10.1016/j.electacta.2011.07.009
Hatsuki, R., Fuchigami, Y., and Yamamoto, T. (2013). Direct measurement of electric double layer in a nanochannel by electrical impedance spectroscopy. Microfluid. Nanofluid. 14, 983–988. doi: 10.1007/s10404-012-1105-5
Heinze, B. C., Song, J. Y., Lee, C. H., Najam, A., and Yoon, J. Y. (2009). Microfluidic immunosensor for rapid and sensitive detection of bovine viral diarrhea virus. Sens. Actuators B Chem. 138, 491–496. doi: 10.1016/j.snb.2009.02.058
Hodneland, K., García, R., Balbuena, J. A., Zarza, C., and Fouz, B. (2011). Real-time RT-PCR detection of betanodavirus in naturally and experimentally infected fish from Spain. J. Fish Dis. 34, 189–202. doi: 10.1111/j.1365-2761.2010.01227.x
Hughes, M. P., Morgan, H., and Rixon, F. J. (2001). Dielectrophoretic manipulation and characterization of herpes simplex virus-1 capsids. Eur. Biophys. J. 30, 268–272. doi: 10.1007/s002490100144
Klug, A. (1999). The tobacco mosaic virus particle: structure and assembly. Philos. Trans. R. Soc. Lond. B Biol. Sci. 354, 531–535. doi: 10.1098/rstb.1999.0404
Lee, B. W., Bey, R. F., Baarsch, M. J., and Simonson, R. R. (1993). ELISA method for detection of influenza A infection in swine. J. Vet. Diagn. Invest. 5, 510–515. doi: 10.1177/104063879300500402
Lee, Y. F., Lien, K. Y., Lei, H. Y., and Lee, G. B. (2009). An integrated microfluidic system for rapid diagnosis of dengue virus infection. Biosens. Bioelectron. 25, 745–752. doi: 10.1016/j.bios.2009.08.020
Liu, H., and Bau, H. H. (2004). The dialectrophoresis of cylindrical and spherical particles submerged in shells and in semi-infinite media. Phys. Fluids 16, 1217–1228. doi: 10.1063/1.1649237
Lum, J., Wang, R., Lassiter, K., Srinivasan, B., Abi-Ghanem, D., Berghman, L., et al. (2012). Rapid detection of avian influenza H5N1 virus using impedance measurement of immuno-reaction coupled with RBC amplification. Biosens. Bioelectron. 38, 67–73. doi: 10.1016/j.bios.2012.04.047
Morgan, H., and Green, N. G. (1997). Dielectrophoretic manipulation of rod-shaped viral particles. J. Electrostat. 40, 279–293. doi: 10.1016/S0304-3886(97)00159-9
Morgan, H., Hughes, M. P., and Green, N. G. (1999). Separation of submicron bioparticles by dielectrophoresis. Biophys. J. 77, 516–525. doi: 10.1016/S0006-3495(99)76908-0
Nguyen, B. T., Peh, A. E., Chee, C. Y., Fink, K., Chow, V. T., Ng, M. M., et al. (2012). Electrochemical impedance spectroscopy characterization of nanoporous alumina dengue virus biosensor. Bioelectrochemistry 88, 15–21. doi: 10.1016/j.bioelechem.2012.04.006
Park, K., Akin, D., and Bashir, R. (2007). Electrical capture and lysis of vaccinia virus particles using silicon nano-scale probe array. Biomed. Microdevices 9, 877–883. doi: 10.1007/s10544-007-9101-3
Patolsky, F., Zheng, G., Hayden, O., Lakadamyali, M., Zhuang, X., and Lieber, C. M. (2004). Electrical detection of single viruses. Proc. Natl. Acad. Sci. U.S.A. 101, 14017–14022. doi: 10.1073/pnas.0406159101
Pethig, R. (2010). Dielectrophoresis: status of the theory, technology, and applications. Biomicrofluidics 4, 022811. doi: 10.1063/1.3456626
Poenar, D. P., Iliescu, C., Boulaire, J., and Yu, H. (2004). Label-free virus identification and characterization using electrochemical impedance spectroscopy. Electrophoresis 35, 433–440. doi: 10.1002/elps.201300368
Reichmuth, D. S., Wang, S. K., Barrett, L. M., Throckmorton, D. J., Einfeld, W., and Singh, A. K. (2008). Rapid microchip-based electrophoretic immunoassays for the detection of swine influenza virus. Lab Chip 8, 1319–1324. doi: 10.1039/b801396a
Sai, L., Frederic, E., Christian, S., Andreas, H., Iwan, A. T., and Schaap, I. A. (2011). Bending and puncturing the influenza lipid envelope. Biophys. J. 100, 637–645. doi: 10.1016/j.bpj.2010.12.3701
Schneider, C. A., Rasband, W. S., and Eliceiri, K. W. (2012). NIH image to image J: 25 years of image analysis. Nat. Methods 9, 671–675. doi: 10.1038/nmeth.2089
Tiffany, J. M., and Blough, H. (1970). Models of structure of the envelope of influenza virus. Proc. Natl. Acad. Sci. U.S.A. 65, 1105–1012. doi: 10.1073/pnas.65.4.1105
Turcu, I., and Lucaciu, C. M. (1989). Dielectrophoresis: a spherical shell model. J. Phys. A Math. Gen. 22, 985–993. doi: 10.1088/0305-4470/22/8/014
Wang, R., Lin, J., Lassiter, K., Srinivasan, B., Lin, L., Lu, H., et al. (2011). Evaluation study of a portable impedance biosensor for detection of avian influenza virus. J. Virol. Methods 178, 52–58. doi: 10.1016/j.jviromet.2011.08.011
Wang, R., Wang, Y., Lassiter, K., Li, Y., Hargis, B., Tung, S., et al. (2009). Interdigitated array microelectrode based impedance immunosensor for detection of avian influenza virus H5N1. Talanta 79, 159–164. doi: 10.1016/j.talanta.2009.03.017
Yang, L., Banada, P. P., Bhunia, A. K., and Bashir, R. (2008). Effects of dielectrophoresis on growth, viability and immuno-reactivity of listeria monocytogenes. J. Biol. Eng. 2:6. doi: 10.1186/1754-1611-2-6
Keywords: virus, virus sensing, impedance spectroscopy, nanogap, nanofluidics, environmental monitoring
Citation: Hatsuki R, Honda A, Kajitani M and Yamamoto T (2015) Nonlinear electrical impedance spectroscopy of viruses using very high electric fields created by nanogap electrodes. Front. Microbiol. 6:940. doi: 10.3389/fmicb.2015.00940
Received: 27 July 2015; Accepted: 24 August 2015;
Published: 09 September 2015.
Edited by:
Slobodan Paessler, University of Texas Medical Branch, USACopyright © 2015 Hatsuki, Honda, Kajitani and Yamamoto. This is an open-access article distributed under the terms of the Creative Commons Attribution License (CC BY). The use, distribution or reproduction in other forums is permitted, provided the original author(s) or licensor are credited and that the original publication in this journal is cited, in accordance with accepted academic practice. No use, distribution or reproduction is permitted which does not comply with these terms.
*Correspondence: Takatoki Yamamoto, Department of Mechanical and Control Engineering, Tokyo Institute of Technology, 2-12-1 Ookayama, Meguro-ku, Tokyo 152-8550, Japan, yamamoto@mes.titech.ac.jp