Energy
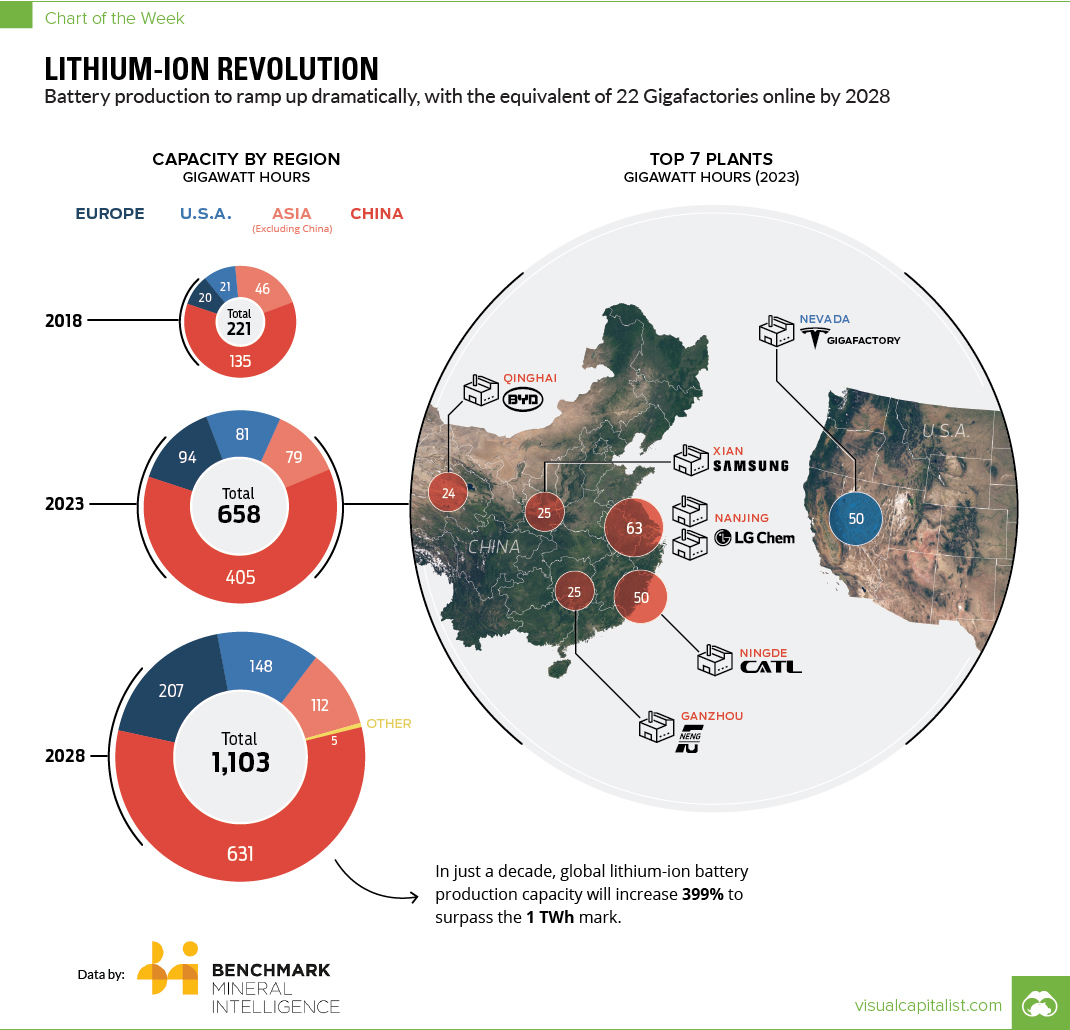
Battery Megafactory Forecast: 400% Increase in Capacity to 1 TWh by 2028
Battery Megafactory Forecast
The Chart of the Week is a weekly Visual Capitalist feature on Fridays.
When ground broke on the massive Tesla Gigafactory in Nevada in 2014, the world marveled at the project’s audacity, size, and scope.
At the time, it was touted that the cutting-edge facility would be the largest building in the world by footprint, and that the Gigafactory would single-handedly be capable of doubling the world’s lithium-ion battery production capacity.
What many did not realize, however, is that although as ambitious and as forward-looking as the project sounded, the Gigafactory was just the start of a trend towards scale in the battery making space. While Tesla’s facility was the most publicized, it would ultimately be one of many massive factories in the global pipeline.
Mastering Scale
Today’s data comes to us from Benchmark Mineral Intelligence, and it forecasts that we will see a 399% increase in lithium-ion battery production capacity over the next decade – enough to pass the impressive 1 TWh milestone.
Here is a more detailed projection of how things will shape up in the coming decade:
| Region | Capacity (GWh, 2018) | Capacity (GWh, 2023) | Capacity (GWh, 2028) |
|---|---|---|---|
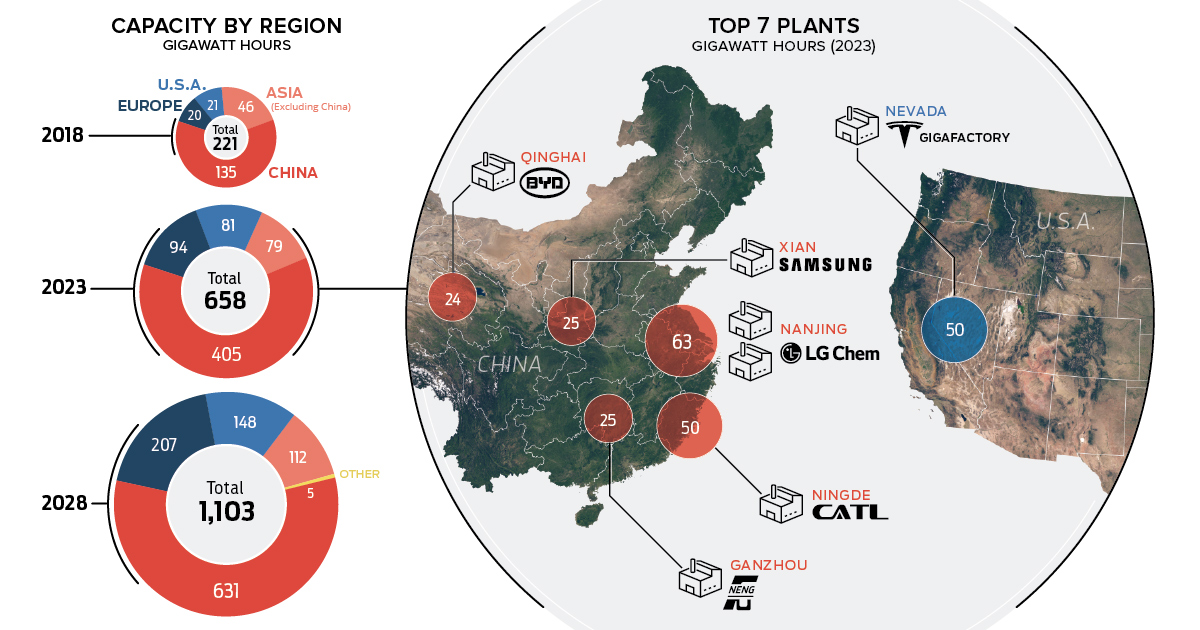
| China | 134.5 | 405 | 631 |
| Europe | 19.6 | 93.5 | 207 |
| North America | 20.9 | 81 | 148 |
| Other | 0 | 0 | 5 |
| Asia (excl China) | 45.5 | 78.5 | 111.5 |
| Grand Total | 220.5 | 658 | 1,102.5 |
In just a decade, lithium-ion battery megafactories around the world will have a combined production capacity equivalent to 22 Tesla Gigafactories!
The majority of this capacity will be located in China, which is projected to have 57% of the global total.
The Top Plants Globally
According to Benchmark, the top 10 megafactories will be combining for 299 GWh of capacity in 2023, which will be equal to almost half of the global production total.
Here are the top 10 plants, sorted by projected capacity:
| Rank | Megafactory | Owner | Country | Forecasted capacity by 2023 (GWh) |
|---|---|---|---|---|
| #1 | CATL | Contemporary Amperex Technology Co Ltd | China | 50 |
| #2 | Tesla Gigafactory 1 | Tesla Inc / Panasonic Corp (25%) | US | 50 |
| #3 | Nanjing LG Chem New Energy Battery Co., Ltd. | LG Chem | China | 35 |
| #4 | Nanjing LG Chem New Energy Battery Co., Ltd. Plant 2 | LG Chem | China | 28 |
| #5 | Samsung SDI Xian | Samsung SDI | China | 25 |
| #6 | Funeng Technology | Funeng Technology (Ganzhou) | China | 25 |
| #7 | BYD , Qinghai | BYD Co Ltd | China | 24 |
| #8 | LG Chem Wroclaw Energy Sp. z o.o. | LG Chem | Poland | 22 |
| #9 | Samsung SDI Korea | Samsung SDI | Korea | 20 |
| #10 | Lishen | TianJin Lishen Battery Joint-Stock CO.,LTD | China | 20 |
Of the top 10 megafactory plants in 2023, the majority will be located in China – meanwhile, the U.S. (Tesla Gigafactory), South Korea (Samsung), and Poland (LG Chem) will be home to the rest.
Reaching economies of scale in lithium-ion battery production will be a significant step in decreasing the overall cost of electric vehicles, which are expected to surpass traditional vehicles in market share by 2038.


Who’s Building the Most Solar Energy?
This was originally posted on our Voronoi app. Download the app for free on iOS or Android and discover incredible data-driven charts from a variety of trusted sources.
In 2023, solar energy accounted for three-quarters of renewable capacity additions worldwide. Most of this growth occurred in Asia, the EU, and the U.S., continuing a trend observed over the past decade.
In this graphic, we illustrate the rise in installed solar photovoltaic (PV) capacity in China, the EU, and the U.S. between 2010 and 2022, measured in gigawatts (GW). Bruegel compiled the data..
Chinese Dominance
As of 2022, China’s total installed capacity stands at 393 GW, nearly double that of the EU’s 205 GW and surpassing the USA’s total of 113 GW by more than threefold in absolute terms.
| Installed solar capacity (GW) | China | EU27 | U.S. |
|---|---|---|---|
| 2022 | 393.0 | 205.5 | 113.0 |
| 2021 | 307.0 | 162.7 | 95.4 |
| 2020 | 254.0 | 136.9 | 76.4 |
| 2019 | 205.0 | 120.1 | 61.6 |
| 2018 | 175.3 | 104.0 | 52.0 |
| 2017 | 130.8 | 96.2 | 43.8 |
| 2016 | 77.8 | 91.5 | 35.4 |
| 2015 | 43.6 | 87.7 | 24.2 |
| 2014 | 28.4 | 83.6 | 18.1 |
| 2013 | 17.8 | 79.7 | 13.3 |
| 2012 | 6.7 | 71.1 | 8.6 |
| 2011 | 3.1 | 53.3 | 5.6 |
| 2010 | 1.0 | 30.6 | 3.4 |
Since 2017, China has shown a compound annual growth rate (CAGR) of approximately 25% in installed PV capacity, while the USA has seen a CAGR of 21%, and the EU of 16%.
Additionally, China dominates the production of solar power components, currently controlling around 80% of the world’s solar panel supply chain.
In 2022, China’s solar industry employed 2.76 million individuals, with manufacturing roles representing approximately 1.8 million and the remaining 918,000 jobs in construction, installation, and operations and maintenance.
The EU industry employed 648,000 individuals, while the U.S. reached 264,000 jobs.
According to the IEA, China accounts for almost 60% of new renewable capacity expected to become operational globally by 2028.
Despite the phasing out of national subsidies in 2020 and 2021, deployment of solar PV in China is accelerating. The country is expected to reach its national 2030 target for wind and solar PV installations in 2024, six years ahead of schedule.

-

 Markets6 days ago
The Most Valuable Companies in Major EU Economies
-

 Wealth2 weeks ago
Charted: Which City Has the Most Billionaires in 2024?
-

 Technology2 weeks ago
All of the Grants Given by the U.S. CHIPS Act
-

 Green2 weeks ago
The Carbon Footprint of Major Travel Methods
-

 United States1 week ago
Visualizing the Most Common Pets in the U.S.
-

 Culture1 week ago
The World’s Top Media Franchises by All-Time Revenue
-

 voronoi1 week ago
Best Visualizations of April on the Voronoi App
-

 Wealth1 week ago
Charted: Which Country Has the Most Billionaires in 2024?