
Analysts’ Viewpoint on Building Information Modeling (BIM) Market Scenario
The building information modeling (BIM) process helps increase productivity, efficiency, infrastructure value, quality, and sustainability. The popularity of BIM is rising across the globe due to its ability to reduce cost and time incurred in construction projects, and mitigate construction risks. Growth in penetration of BIM in civil engineering, construction modeling, and architecture industries is augmenting the building information modeling (BIM) market. The COVID-19 pandemic has negatively impacted the construction industry, thus hampering the adoption of BIM in construction project management. Companies operating in the BIM market are striving to offer innovative building information modeling services, primarily for the construction industry, in order to broaden their revenue streams.
Building information modeling (BIM) is the process of creating, storing, managing, exchanging, and sharing building information. BIM is the 3D visualization of a technical drawing, which includes the plan, elevation, and section of a building. It is a kind of digital fabrication system, wherein the actual model of the building is digitally constructed with an accurate value. The BIM software enables the creation of a realistic 3D model of a building that helps identify construction defects, simplify building operations, and automate the construction process. Building information management helps resolve construction issues and reduce the expensive and time-consuming changes that occur during construction activities.
Request a sample to get extensive insights into the Building Information Modeling (BIM) Market
Increase in awareness about the benefits of BIM, rise in number of construction projects, and growth in demand for automated models in the AEC (architecture, engineering, and construction) sector are augmenting the demand for BIM tools in the construction industry. Increase in adoption of BIM tools in infrastructure and commercial projects is projected to fuel the global building information modeling (BIM) market during the forecast period. BIM provides an architect with a 3D view of the building's height, width, and depth. This helps reduce errors that occur during the construction process. BIM also provides advanced workflow capabilities to design high-performing and efficient buildings. Development of infrastructure to support the growing road and railways network due to the ever-increasing population is anticipated to fuel the building Information modeling solutions market in the near future. Building information management system also helps lower carbon emissions in the construction industry. According to clients such as architects, designers, sub-contractors, and contractors, the return on investment (ROI) using building information technology is greater than that in conventional construction management.
Equipment operator training and safety training are two areas where virtual reality (VR) could have a significant impact on the AEC industry. With VR, laborers can get higher exposure to environments such as working at a height or a confined space-controlled environment. Augmented Reality (AR) enables the construction industry to achieve a detailed observation of each phase of the project lifecycle. Reality modeling and 3D allow project designers and architects to move various elements around and detect any potential issues in design. With AR, clients can ‘view’ a building before it is constructed or built. This enables clients to get a better picture of the end result, thus allowing speedy approval of the design. Combining AR with BIM helps users to view 3D models. Electrical and plumbing systems can also be placed more precisely with the help of 3D models.
The construction industry is heading toward digitalization. Implementation of AR and VR technologies is expected to help deliver greater design visualization and provide a better understanding of projects. It is also likely to improve jobsite safety and avoid hidden hazards. Maintenance is also made simpler using AR technology. Users of AR can view work history, information on schematics, and work directions for specific building models. Thus, rise in penetration of virtual reality (VR) and augmented reality (AR) technologies is expected to offer lucrative opportunities to companies operating in the building information modeling (BIM) market during the forecast period.
North America is anticipated to dominate the global building information modeling (BIM) market by the end of 2022. The market in the region is anticipated to grow at a prominent CAGR during the forecast period. This is majorly due to increase in awareness about the benefits of BIM tools in the region. The building information modeling (BIM) solutions market in Asia Pacific is likely to grow substantially in the next few years owing to the rise in number of construction activities and smart city projects in the region. For instance, the Government of India has taken various initiatives to develop smart cities across the country. On the other hand, increase in awareness about BIM technology in construction industry in Middle East & Africa is expected to create immense opportunities for the market players in the region during the forecast period.
The global building information modeling (BIM) market is consolidated, with the presence of a few large-scale vendors that control majority of the share. Investments in R&D activities are expected to drive the global building information modeling (BIM) market. Expansion of product portfolios and mergers & acquisitions are major strategies adopted by key players operating in the market. Prominent players operating in the global building information modeling (BIM) market are Autodesk Inc., AVEVA Group plc, Beck Technology, Bentley Systems, Incorporated, ClearEdge3D, Inc., Dassault Systèmes, DC Engineering Products PVT. LTD, FARO, Geo-Plus Inc., Innovaya LLC., Microsoft Corporation, Nemetschek Group, RIB Software SE, Safe Software Inc., SierraSoft, Technodigit, Tekla Corporation, Trimble, Inc. and Vectorworks, Inc.
Request a custom report on Building Information Modeling (BIM) Market
Each of these players has been profiled in the Building Information Modeling (BIM) market report based on parameters such as company overview, financial overview, business strategies, product portfolio, business segments, and recent developments.
|
Attribute |
Detail |
|
Market Size Value in 2021 |
US$ 14.7 Bn |
|
Market Forecast Value in 2031 |
US$ 53.8 Bn |
|
Growth Rate (CAGR) |
14.0% |
|
Forecast Period |
2022–2031 |
|
Historical Data Available for |
2017–2020 |
|
Quantitative Units |
US$ Bn for Value |
|
Market Analysis |
Includes cross segment analysis at global as well as regional level. Furthermore, qualitative analysis includes drivers, restraints, opportunities, key trends, Porter’s Five Forces analysis, value chain analysis, and key trend analysis. |
|
Competition Landscape |
|
|
Format |
Electronic (PDF) + Excel |
|
Market Segmentation |
|
|
Regions Covered |
|
|
Countries Covered |
|
|
Companies Profiled |
|
|
Customization Scope |
Available upon request |
|
Pricing |
Available upon request |
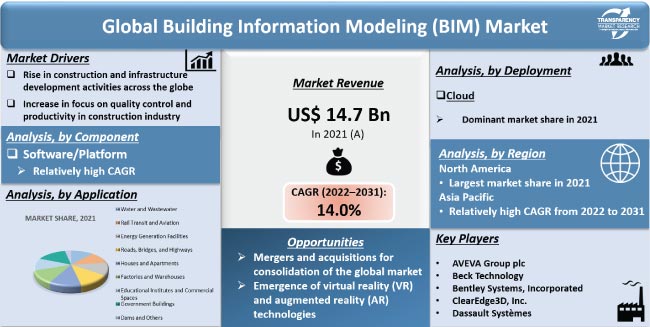
The building information modeling (BIM) market stood at US$ 14.7 Bn in 2021
The building information modeling (BIM) market is estimated to rise at a CAGR of 14.0% during the forecast period
Emergence of virtual reality (VR) and augmented reality (AR) technologies is the biggest growth opportunity for the building information modeling (BIM) market
Increase in construction activities with more emphasis on quality control and productivity is a major factor expected to drive the global building information modeling (BIM) market during the forecast period
North America is more attractive region for players in the building information modeling (BIM) market
The global building information modeling (BIM) market is expected to reach US$ 53.8 Bn by 2031
Autodesk Inc., AVEVA Group plc, Beck Technology, Bentley Systems, Incorporated, CLEAREDGE3D, INC., Dassault Systèmes, DC Engineering Products PVT. LTD, FARO, Geo-Plus Inc., Innovaya LLC., Microsoft Corporation, Nemetschek Group, RIB Software SE, Safe Software Inc., SierraSoft, Technodigit, Tekla Corporation, Trimble, Inc. and Vectorworks, Inc.
1. Preface
1.1. Market Introduction
1.2. Market Segmentation
1.3. Key Research Objectives
2. Assumptions and Research Methodology
2.1. Research Methodology
2.1.1. List of Primary and Secondary Sources
2.2. Key Assumptions for Data Modelling
3. Executive Summary - Global Building Information Modeling (BIM) Market
4. Market Overview
4.1. Market Definition
4.2. Market Factor Analysis
4.2.1. Forecast Factors
4.2.2. Technology Roadmap
4.2.3. Ecosystem/ Value Chain Analysis
4.2.4. Market Dynamics (Growth Influencers)
4.2.4.1. Drivers
4.2.4.2. Restraints
4.2.4.3. Opportunities
4.2.4.4. Impact Analysis of Drivers and Restraints
4.3. Impact Analysis of COVID-19 on Building Information Modeling (BIM) Market
4.3.1. Deployment Sentiment Analysis: Comparative Analysis on Spending
4.3.1.1. Increase in Spending
4.3.1.2. Decrease in Spending
4.3.2. Short Term and Long Term Impact on the Market
4.4. Market Opportunity Assessment – by Region (North America/ Europe/ Asia Pacific/ Middle East & Africa/ South America)
4.4.1. By Component
4.4.2. By Deployment
4.4.3. By Application
4.5. Competitive Scenario and Trends
4.5.1. List of Emerging, Prominent and Leading Players
4.5.2. Mergers & Acquisitions, Expansions
5. Global Building Information Modeling (BIM) Market Analysis and Forecast
5.1. Market Value Analysis (US$ Bn), 2016-2031
5.1.1. Historic Growth Trends, 2016-2021
5.1.2. Forecast Trends, 2022-2031
5.2. Pricing Model Analysis
6. Global Building Information Modeling (BIM) Market Analysis, by Component
6.1. Key Segment Analysis
6.2. Building Information Modeling (BIM) Market Size (US$ Bn) Forecast, by Component, 2018 - 2031
6.2.1. Software/Platform
6.2.2. Services
6.2.2.1. Consultation & Integration
6.2.2.2. Support & Maintenance
7. Global Building Information Modeling (BIM) Market Analysis, by Deployment
7.1. Key Segment Analysis
7.2. Building Information Modeling (BIM) Market Size (US$ Bn) Forecast, by Deployment, 2018 - 2031
7.2.1. On-premise
7.2.2. Cloud
8. Global Building Information Modeling (BIM) Market Analysis, by Application
8.1. Key Segment Analysis
8.2. Building Information Modeling (BIM) Market Size (US$ Bn) Forecast, by Application, 2018 - 2031
8.2.1. Water and Wastewater
8.2.2. Rail Transit and Aviation
8.2.3. Energy Generation Facilities
8.2.4. Roads, Bridges, and Highways
8.2.5. Houses and Apartments
8.2.6. Factories and Warehouses
8.2.7. Educational Institutes and Commercial Spaces
8.2.8. Government Buildings
8.2.9. Dams and Others
9. Global Building Information Modeling (BIM) Market Analysis and Forecast, by Region
9.1. Key Findings
9.2. Building Information Modeling (BIM) Market Size (US$ Bn) Forecast, by Region, 2018 - 2031
9.2.1. North America
9.2.2. Europe
9.2.3. Asia Pacific
9.2.4. Middle East & Africa
9.2.5. South America
10. North America Building Information Modeling (BIM) Market Analysis
10.1. Regional Outlook
10.2. Building Information Modeling (BIM) Market Size (US$ Bn) Analysis and Forecast (2018 - 2031)
10.2.1. By Component
10.2.2. By Deployment
10.2.3. By Application
10.3. Building Information Modeling (BIM) Market Size (US$ Bn) Forecast, by Country, 2018 - 2031
10.3.1. U.S.
10.3.2. Canada
10.3.3. Mexico
11. Europe Building Information Modeling (BIM) Market Analysis and Forecast
11.1. Regional Outlook
11.2. Building Information Modeling (BIM) Market Size (US$ Bn) Analysis and Forecast (2018 - 2031)
11.2.1. By Component
11.2.2. By Deployment
11.2.3. By Application
11.3. Building Information Modeling (BIM) Market Size (US$ Bn) Forecast, by Country & Sub-region, 2018 - 2031
11.3.1. Germany
11.3.2. U.K.
11.3.3. France
11.3.4. Italy
11.3.5. Spain
11.3.6. Rest of Europe
12. Asia Pacific Building Information Modeling (BIM) Market Analysis and Forecast
12.1. Regional Outlook
12.2. Building Information Modeling (BIM) Market Size (US$ Bn) Analysis and Forecast (2018 - 2031)
12.2.1. By Component
12.2.2. By Deployment
12.2.3. By Application
12.3. Building Information Modeling (BIM) Market Size (US$ Bn) Forecast, by Country & Sub-region, 2018 - 2031
12.3.1. China
12.3.2. India
12.3.3. Japan
12.3.4. ASEAN
12.3.5. Rest of Asia Pacific
13. Middle East & Africa (MEA) Building Information Modeling (BIM) Market Analysis and Forecast
13.1. Regional Outlook
13.2. Building Information Modeling (BIM) Market Size (US$ Bn) Analysis and Forecast (2018 - 2031)
13.2.1. By Component
13.2.2. By Deployment
13.2.3. By Application
13.3. Building Information Modeling (BIM) Market Size (US$ Bn) Forecast, by Country & Sub-region, 2018 - 2031
13.3.1. Saudi Arabia
13.3.2. United Arab Emirates
13.3.3. South Africa
13.3.4. Rest of Middle East & Africa (MEA)
14. South America Building Information Modeling (BIM) Market Analysis and Forecast
14.1. Regional Outlook
14.2. Building Information Modeling (BIM) Market Size (US$ Bn) Analysis and Forecast (2018 - 2031)
14.2.1. By Component
14.2.2. By Deployment
14.2.3. By Application
14.3. Building Information Modeling (BIM) Market Size (US$ Bn) Forecast, by Country & Sub-region, 2018 - 2031
14.3.1. Brazil
14.3.2. Argentina
14.3.3. Rest of South America
15. Competition Landscape
15.1. Market Competition Matrix, by Leading Players
15.2. Market Value Share Analysis (%), by Leading Players (2021)
16. Company Profiles
16.1. Autodesk Inc.
16.1.1. Business Overview
16.1.2. Company Revenue
16.1.3. Product Portfolio
16.1.4. Geographic Footprint
16.1.5. Strategic Partnership, Merger & Acquisition, Business Expansion, New Product Launch, Innovation etc.
16.2. AVEVA Group plc
16.2.1. Business Overview
16.2.2. Company Revenue
16.2.3. Product Portfolio
16.2.4. Geographic Footprint
16.2.5. Strategic Partnership, Merger & Acquisition, Business Expansion, New Product Launch, Innovation etc.
16.3. Beck Technology
16.3.1. Business Overview
16.3.2. Company Revenue
16.3.3. Product Portfolio
16.3.4. Geographic Footprint
16.3.5. Strategic Partnership, Merger & Acquisition, Business Expansion, New Product Launch, Innovation etc.
16.4. Bentley Systems, Incorporated
16.4.1. Business Overview
16.4.2. Company Revenue
16.4.3. Product Portfolio
16.4.4. Geographic Footprint
16.4.5. Strategic Partnership, Merger & Acquisition, Business Expansion, New Product Launch, Innovation etc.
16.5. CLEAREDGE3D, INC.
16.5.1. Business Overview
16.5.2. Company Revenue
16.5.3. Product Portfolio
16.5.4. Geographic Footprint
16.5.5. Strategic Partnership, Merger & Acquisition, Business Expansion, New Product Launch, Innovation etc.
16.6. Dassault Systèmes
16.6.1. Business Overview
16.6.2. Company Revenue
16.6.3. Product Portfolio
16.6.4. Geographic Footprint
16.6.5. Strategic Partnership, Merger & Acquisition, Business Expansion, New Product Launch, Innovation etc.
16.7. DC Engineering Products PVT. LTD
16.7.1. Business Overview
16.7.2. Company Revenue
16.7.3. Product Portfolio
16.7.4. Geographic Footprint
16.7.5. Strategic Partnership, Merger & Acquisition, Business Expansion, New Product Launch, Innovation etc.
16.8. FARO
16.8.1. Business Overview
16.8.2. Company Revenue
16.8.3. Product Portfolio
16.8.4. Geographic Footprint
16.8.5. Strategic Partnership, Merger & Acquisition, Business Expansion, New Product Launch, Innovation etc.
16.9. Geo-Plus Inc.
16.9.1. Business Overview
16.9.2. Company Revenue
16.9.3. Product Portfolio
16.9.4. Geographic Footprint
16.9.5. Strategic Partnership, Merger & Acquisition, Business Expansion, New Product Launch, Innovation etc.
16.10. Innovaya LLC
16.10.1. Business Overview
16.10.2. Company Revenue
16.10.3. Product Portfolio
16.10.4. Geographic Footprint
16.10.5. Strategic Partnership, Merger & Acquisition, Business Expansion, New Product Launch, Innovation etc.
16.11. Microsoft Corporation
16.11.1. Business Overview
16.11.2. Company Revenue
16.11.3. Product Portfolio
16.11.4. Geographic Footprint
16.11.5. Strategic Partnership, Merger & Acquisition, Business Expansion, New Product Launch, Innovation etc.
16.12. Nemetschek Group
16.12.1. Business Overview
16.12.2. Company Revenue
16.12.3. Product Portfolio
16.12.4. Geographic Footprint
16.12.5. Strategic Partnership, Merger & Acquisition, Business Expansion, New Product Launch, Innovation etc.
16.13. RIB Software SE
16.13.1. Business Overview
16.13.2. Company Revenue
16.13.3. Product Portfolio
16.13.4. Geographic Footprint
16.13.5. Strategic Partnership, Merger & Acquisition, Business Expansion, New Product Launch, Innovation etc.
16.14. Safe Software Inc
16.14.1. Business Overview
16.14.2. Company Revenue
16.14.3. Product Portfolio
16.14.4. Geographic Footprint
16.14.5. Strategic Partnership, Merger & Acquisition, Business Expansion, New Product Launch, Innovation etc.
16.15. SierraSoft
16.15.1. Business Overview
16.15.2. Company Revenue
16.15.3. Product Portfolio
16.15.4. Geographic Footprint
16.15.5. Strategic Partnership, Merger & Acquisition, Business Expansion, New Product Launch, Innovation etc.
16.16. Technodigit
16.16.1. Business Overview
16.16.2. Company Revenue
16.16.3. Product Portfolio
16.16.4. Geographic Footprint
16.16.5. Strategic Partnership, Merger & Acquisition, Business Expansion, New Product Launch, Innovation etc.
16.17. Tekla Corporation
16.17.1. Business Overview
16.17.2. Company Revenue
16.17.3. Product Portfolio
16.17.4. Geographic Footprint
16.17.5. Strategic Partnership, Merger & Acquisition, Business Expansion, New Product Launch, Innovation etc.
16.18. Trimble, Inc.
16.18.1. Business Overview
16.18.2. Company Revenue
16.18.3. Product Portfolio
16.18.4. Geographic Footprint
16.18.5. Strategic Partnership, Merger & Acquisition, Business Expansion, New Product Launch, Innovation etc.
16.19. Vectorworks, Inc.
16.19.1. Business Overview
16.19.2. Company Revenue
16.19.3. Product Portfolio
16.19.4. Geographic Footprint
16.19.5. Strategic Partnership, Merger & Acquisition, Business Expansion, New Product Launch, Innovation etc.
16.20. Others
17. Key Takeaways
List of Tables
Table 1: Acronyms Used in the Building Information Modeling (BIM) Market
Table 2: North America Building Information Modeling (BIM) Market Value Analysis, by Country, 2022 - 2031 (US$ Bn)
Table 3: Europe Building Information Modeling (BIM) Market Value Analysis, by Country & Sub-region, 2022 - 2031 (US$ Bn)
Table 4: Asia Pacific Building Information Modeling (BIM) Market Value Analysis, by Country & Sub-region, 2022 - 2031 (US$ Bn)
Table 5: Middle East & Africa Building Information Modeling (BIM) Market Value Analysis, by Country & Sub-region, 2022 and 2031 (US$ Bn)
Table 6: South America Building Information Modeling (BIM) Market Value Analysis, by Country & Sub-region, 2022 - 2031 (US$ Bn)
Table 7: Impact Analysis of Drivers & Restraints
Table 8: Global Building Information Modeling (BIM) Market Value (US$ Bn) Forecast, by Component, 2018 – 2031
Table 9: Global Building Information Modeling (BIM) Market Value (US$ Bn) Forecast, by Deployment, 2018 – 2031
Table 10: Global Building Information Modeling (BIM) Market Value (US$ Bn) Forecast, by Application, 2018 – 2031
Table 11: Global Building Information Modeling (BIM) Market Volume (US$ Bn) Forecast, by Region, 2018 – 2031
Table 12: North America Building Information Modeling (BIM) Market Value (US$ Bn) Forecast, by Component, 2018 – 2031
Table 13: North America Building Information Modeling (BIM) Market Value (US$ Bn) Forecast, by Deployment, 2018 – 2031
Table 14: North America Building Information Modeling (BIM) Market Value (US$ Bn) Forecast, by Application, 2018 – 2031
Table 15: North America Building Information Modeling (BIM) Market Value (US$ Bn) Forecast, by Country, 2018 - 2031
Table 16: U.S. Building Information Modeling (BIM) Market Value CAGR Breakdown (%), by Growth Term
Table 17: Canada Building Information Modeling (BIM) Market Value CAGR Breakdown (%), by Growth Term
Table 18: Mexico Building Information Modeling (BIM) Market Value CAGR Breakdown (%), by Growth Term
Table 19: Europe Building Information Modeling (BIM) Market Value (US$ Bn) Forecast, by Component, 2018 – 2031
Table 20: Europe Building Information Modeling (BIM) Market Value (US$ Bn) Forecast, by Deployment, 2018 – 2031
Table 21: Europe Building Information Modeling (BIM) Market Value (US$ Bn) Forecast, by Application, 2018 – 2031
Table 22: Europe Building Information Modeling (BIM) Market Value (US$ Bn) Forecast, by Country & Sub-region, 2018 - 2031
Table 23: Germany Building Information Modeling (BIM) Market Value CAGR Breakdown (%), by Growth Term
Table 24: U.K. Building Information Modeling (BIM) Market Value CAGR Breakdown (%), by Growth Term
Table 25: France Building Information Modeling (BIM) Market Value CAGR Breakdown (%), by Growth Term
Table 26: Spain Building Information Modeling (BIM) Market Value CAGR Breakdown (%), by Growth Term
Table 27: Italy Building Information Modeling (BIM) Market Value CAGR Breakdown (%), by Growth Term
Table 28: Asia Pacific Building Information Modeling (BIM) Market Value (US$ Bn) Forecast, by Component, 2018 – 2031
Table 29: Asia Pacific Building Information Modeling (BIM) Market Value (US$ Bn) Forecast, by Deployment, 2018 – 2031
Table 30: Asia Pacific Building Information Modeling (BIM) Market Value (US$ Bn) Forecast, by Application, 2018 – 2031
Table 31: Asia Pacific Building Information Modeling (BIM) Market Value (US$ Bn) Forecast, by Country & Sub-region, 2018 - 2031
Table 32: China Building Information Modeling (BIM) Market Value CAGR Breakdown (%), by Growth Term
Table 33: India Building Information Modeling (BIM) Market Value CAGR Breakdown (%), by Growth Term
Table 34: Japan Building Information Modeling (BIM) Market Value CAGR Breakdown (%), by Growth Term
Table 35: ASEAN Building Information Modeling (BIM) Market Value CAGR Breakdown (%), by Growth Term
Table 36: Middle East & Africa Building Information Modeling (BIM) Market Value (US$ Bn) Forecast, by Component, 2018 – 2031
Table 37: Middle East & Africa Building Information Modeling (BIM) Market Value (US$ Bn) Forecast, by Deployment, 2018 – 2031
Table 38: Middle East & Africa Building Information Modeling (BIM) Market Value (US$ Bn) Forecast, by Application, 2018 – 2031
Table 39: Middle East & Africa Building Information Modeling (BIM) Market Value (US$ Bn) Forecast, by Country & Sub-region, 2018 - 2031
Table 40: Saudi Arabia Building Information Modeling (BIM) Market Value CAGR Breakdown (%), by Growth Term
Table 41: U.A.E. Building Information Modeling (BIM) Market Value CAGR Breakdown (%), by Growth Term
Table 42: South Africa Building Information Modeling (BIM) Market Value CAGR Breakdown (%), by Growth Term
Table 43: South America Building Information Modeling (BIM) Market Value (US$ Bn) Forecast, by Component, 2018 – 2031
Table 44: South America Building Information Modeling (BIM) Market Value (US$ Bn) Forecast, by Deployment, 2018 – 2031
Table 45: South America Building Information Modeling (BIM) Market Value (US$ Bn) Forecast, by Application, 2018 – 2031
Table 46: South America Building Information Modeling (BIM) Market Value (US$ Bn) Forecast, by Country & Sub-region, 2018 - 2031
Table 47: Brazil Building Information Modeling (BIM) Market Value CAGR Breakdown (%), by Growth Term
Table 48: Argentina Building Information Modeling (BIM) Market Value CAGR Breakdown (%), by Growth Term
Table 49: Mergers & Acquisitions, Expansions (1/4)
Table 50: Mergers & Acquisitions, Expansions (2/4)
Table 51: Mergers & Acquisitions, Expansions (3/4)
Table 52: Mergers & Acquisitions, Expansions (4/4)
List of Figures
Figure 1: Global Building Information Modeling (BIM) Market Size (US$ Bn) Forecast, 2018–2031
Figure 2: Global Building Information Modeling (BIM) Market Value (US$ Bn) Opportunity Assessment, by Region, 2022E
Figure 3: Top Segment Analysis of Building Information Modeling (BIM) Market
Figure 4: Global Building Information Modeling (BIM) Market Value (US$ Bn) Opportunity Assessment, by Region, 2031F
Figure 5: Global Building Information Modeling (BIM) Market Attractiveness Assessment, by Component
Figure 6: Global Building Information Modeling (BIM) Market Attractiveness Assessment, by Deployment
Figure 7: Global Building Information Modeling (BIM) Market Attractiveness Assessment, by Application
Figure 8: Global Building Information Modeling (BIM) Market Attractiveness Assessment, by Region
Figure 9: Global Building Information Modeling (BIM) Market Value (US$ Bn) Historic Trends, 2016 - 2021
Figure 10: Global Building Information Modeling (BIM) Market Value Opportunity (US$ Bn) Historic Trends, 2016 - 2021
Figure 11: Global Building Information Modeling (BIM) Market Value Share Analysis, by Component, 2022
Figure 12: Global Building Information Modeling (BIM) Market Value Share Analysis, by Component, 2031
Figure 13: Global Building Information Modeling (BIM) Market Absolute Opportunity (US$ Bn), by Software/Platform, 2022 – 2031
Figure 14: Global Building Information Modeling (BIM) Market Absolute Opportunity (US$ Bn), by Services, 2022 – 2031
Figure 15: Global Building Information Modeling (BIM) Market Value Share Analysis, by Deployment, 2022
Figure 16: Global Building Information Modeling (BIM) Market Value Share Analysis, by Deployment, 2031
Figure 17: Global Building Information Modeling (BIM) Market Absolute Opportunity (US$ Bn), by On-premise, 2022 – 2031
Figure 18: Global Building Information Modeling (BIM) Market Absolute Opportunity (US$ Bn), by Cloud, 2022 – 2031
Figure 19: Global Building Information Modeling (BIM) Market Value Share Analysis, by Application, 2022
Figure 20: Global Building Information Modeling (BIM) Market Value Share Analysis, by Application, 2031
Figure 21: Global Building Information Modeling (BIM) Market Absolute Opportunity (US$ Bn), by Water and Wastewater, 2022 – 2031
Figure 22: Global Building Information Modeling (BIM) Market Absolute Opportunity (US$ Bn), by Rail Transit and Aviation, 2022 – 2031
Figure 23: Global Building Information Modeling (BIM) Market Absolute Opportunity (US$ Bn), by Energy Generation Facilities, 2022 – 2031
Figure 24: Global Building Information Modeling (BIM) Market Absolute Opportunity (US$ Bn), by Roads, Bridges, and Highways, 2022 – 2031
Figure 25: Global Building Information Modeling (BIM) Market Absolute Opportunity (US$ Bn), by Houses and Apartments, 2022 – 2031
Figure 26: Global Building Information Modeling (BIM) Market Absolute Opportunity (US$ Bn), by Factories and Warehouses, 2022 – 2031
Figure 27: Global Building Information Modeling (BIM) Market Absolute Opportunity (US$ Bn), by Educational Institutes and Commercial Spaces, 2022 – 2031
Figure 28: Global Building Information Modeling (BIM) Market Absolute Opportunity (US$ Bn), by Government Buildings, 2022 – 2031
Figure 29: Global Building Information Modeling (BIM) Market Absolute Opportunity (US$ Bn), by Dams and Others, 2022 – 2031
Figure 30: Global Building Information Modeling (BIM) Market Opportunity (US$ Bn), by Region
Figure 31: Global Building Information Modeling (BIM) Market Opportunity Share (%), by Region, 2022–2031
Figure 32: Global Building Information Modeling (BIM) Market Size (US$ Bn), by Region, 2022 & 2031
Figure 33: Global Building Information Modeling (BIM) Market Value Share Analysis, by Region, 2022
Figure 34: Global Building Information Modeling (BIM) Market Value Share Analysis, by Region, 2031
Figure 35: North America Building Information Modeling (BIM) Market Absolute Opportunity (US$ Bn), 2022 – 2031
Figure 36: Europe Building Information Modeling (BIM) Market Absolute Opportunity (US$ Bn), 2022 – 2031
Figure 37: Asia Pacific Building Information Modeling (BIM) Market Absolute Opportunity (US$ Bn), 2022 – 2031
Figure 38: Middle East & Africa Building Information Modeling (BIM) Market Absolute Opportunity (US$ Bn), 2022 – 2031
Figure 39: South America Building Information Modeling (BIM) Market Absolute Opportunity (US$ Bn), 2022 – 2031
Figure 40: North America Building information modeling (BIM) Revenue Opportunity Share, by Component
Figure 41: North America Building information modeling (BIM) Revenue Opportunity Share, by Deployment
Figure 42: North America Building information modeling (BIM) Revenue Opportunity Share, by Application
Figure 43: North America l Building Information Modeling (BIM) Market Value Share Analysis, by Component, 2022
Figure 44: North America Building Information Modeling (BIM) Market Value Share Analysis, by Component, 2031
Figure 45: North America Building Information Modeling (BIM) Market Absolute Opportunity (US$ Bn), by Software/Platform, 2022 – 2031
Figure 46: North America Building Information Modeling (BIM) Market Absolute Opportunity (US$ Bn), by Services, 2022 – 2031
Figure 47: North America Building Information Modeling (BIM) Market Value Share Analysis, by Deployment, 2022
Figure 48: North America Building Information Modeling (BIM) Market Value Share Analysis, by Deployment, 2031
Figure 49: North America Building Information Modeling (BIM) Market Absolute Opportunity (US$ Bn), by On-premise, 2022 – 2031
Figure 50: North America Building Information Modeling (BIM) Market Absolute Opportunity (US$ Bn), by Cloud, 2022 – 2031
Figure 51: North America Building Information Modeling (BIM) Market Value Share Analysis, by Application, 2022
Figure 52: North America Building Information Modeling (BIM) Market Value Share Analysis, by Application, 2031
Figure 53: North America Building Information Modeling (BIM) Market Absolute Opportunity (US$ Bn), by Water and Wastewater, 2022 – 2031
Figure 54: North America Building Information Modeling (BIM) Market Absolute Opportunity (US$ Bn), by Rail Transit and Aviation, 2022 – 2031
Figure 55: North America Building Information Modeling (BIM) Market Absolute Opportunity (US$ Bn), by Energy Generation Facilities, 2022 – 2031
Figure 56: North America Building Information Modeling (BIM) Market Absolute Opportunity (US$ Bn), by Roads, Bridges, and Highways, 2022 – 2031
Figure 57: North America Building Information Modeling (BIM) Market Absolute Opportunity (US$ Bn), by Houses and Apartments, 2022 – 2031
Figure 58: North America Building Information Modeling (BIM) Market Absolute Opportunity (US$ Bn), by Factories and Warehouses, 2022 – 2031
Figure 59: North America Building Information Modeling (BIM) Market Absolute Opportunity (US$ Bn), by Educational Institutes and Commercial Spaces, 2022 – 2031
Figure 60: North America Building Information Modeling (BIM) Market Absolute Opportunity (US$ Bn), by Government Buildings, 2022 – 2031
Figure 61: North America Building Information Modeling (BIM) Market Absolute Opportunity (US$ Bn), by Dams and Others, 2022 – 2031
Figure 62: North America Building Information Modeling (BIM) Market Value Share Analysis, by Country, 2022
Figure 63: North America Building Information Modeling (BIM) Market Value Share Analysis, by Country, 2031
Figure 64: U.S. Building Information Modeling (BIM) Market Opportunity Growth Analysis (US$ Bn) Forecast, 2022 – 2031
Figure 65: Canada Building Information Modeling (BIM) Market Opportunity Growth Analysis (US$ Bn) Forecast, 2022 – 2031
Figure 66: Mexico Building Information Modeling (BIM) Market Opportunity Growth Analysis (US$ Bn) Forecast, 2022 – 2031
Figure 67: Europe Building information modeling (BIM) Revenue Opportunity Share, by Component
Figure 68: Europe Building information modeling (BIM) Revenue Opportunity Share, by Deployment
Figure 69: Europe Building information modeling (BIM) Revenue Opportunity Share, by Application
Figure 70: Europe Building Information Modeling (BIM) Market Value Share Analysis, by Component, 2022
Figure 71: Europe Building Information Modeling (BIM) Market Value Share Analysis, by Component, 2031
Figure 72: Europe Building Information Modeling (BIM) Market Absolute Opportunity (US$ Bn), by Software/Platform, 2022 – 2031
Figure 73: Europe Building Information Modeling (BIM) Market Absolute Opportunity (US$ Bn), by Services, 2022 – 2031
Figure 74: Europe Building Information Modeling (BIM) Market Value Share Analysis, by Deployment, 2022
Figure 75: Europe Building Information Modeling (BIM) Market Value Share Analysis, by Deployment, 2031
Figure 76: Europe Building Information Modeling (BIM) Market Absolute Opportunity (US$ Bn), by On-premise, 2022 – 2031
Figure 77: Europe Building Information Modeling (BIM) Market Absolute Opportunity (US$ Bn), by Cloud, 2022 – 2031
Figure 78: Europe Building Information Modeling (BIM) Market Value Share Analysis, by Application, 2022
Figure 79: Europe Building Information Modeling (BIM) Market Value Share Analysis, by Application, 2031
Figure 80: Europe Building Information Modeling (BIM) Market Absolute Opportunity (US$ Bn), by Water and Wastewater, 2022 – 2031
Figure 81: Europe Building Information Modeling (BIM) Market Absolute Opportunity (US$ Bn), by Rail Transit and Aviation, 2022 – 2031
Figure 82: Europe Building Information Modeling (BIM) Market Absolute Opportunity (US$ Bn), by Energy Generation Facilities, 2022 – 2031
Figure 83: Europe Building Information Modeling (BIM) Market Absolute Opportunity (US$ Bn), by Roads, Bridges, and Highways, 2022 – 2031
Figure 84: Europe Building Information Modeling (BIM) Market Absolute Opportunity (US$ Bn), by Houses and Apartments, 2022 – 2031
Figure 85: Europe Building Information Modeling (BIM) Market Absolute Opportunity (US$ Bn), by Factories and Warehouses, 2022 – 2031
Figure 86: Europe Building Information Modeling (BIM) Market Absolute Opportunity (US$ Bn), by Educational Institutes and Commercial Spaces, 2022 – 2031
Figure 87: Europe Building Information Modeling (BIM) Market Absolute Opportunity (US$ Bn), by Government Buildings, 2022 – 2031
Figure 88: Europe Building Information Modeling (BIM) Market Absolute Opportunity (US$ Bn), by Dams and Others, 2022 – 2031
Figure 89: Europe Building Information Modeling (BIM) Market Value Share Analysis, by Country & Sub-region, 2022
Figure 90: Europe Building Information Modeling (BIM) Market Value Share Analysis, by Country & Sub-region, 2031
Figure 91: Germany Building Information Modeling (BIM) Market Opportunity Growth Analysis (US$ Bn) Forecast, 2022 – 2031
Figure 92: U.K. Building Information Modeling (BIM) Market Opportunity Growth Analysis (US$ Bn) Forecast, 2022 – 2031
Figure 93: France Building Information Modeling (BIM) Market Opportunity Growth Analysis (US$ Bn) Forecast, 2022 – 2031
Figure 94: Italy Building Information Modeling (BIM) Market Opportunity Growth Analysis (US$ Bn) Forecast, 2022 – 2031
Figure 95: Spain Building Information Modeling (BIM) Market Opportunity Growth Analysis (US$ Bn) Forecast, 2022 – 2031
Figure 96: Asia Pacific Building information modeling (BIM) Revenue Opportunity Share, by Component
Figure 97: Asia Pacific Building information modeling (BIM) Revenue Opportunity Share, by Deployment
Figure 98: Asia Pacific Building information modeling (BIM) Revenue Opportunity Share, by Application
Figure 99: Asia Pacific l Building Information Modeling (BIM) Market Value Share Analysis, by Component, 2022
Figure 100: Asia Pacific Building Information Modeling (BIM) Market Value Share Analysis, by Component, 2031
Figure 101: Asia Pacific Building Information Modeling (BIM) Market Absolute Opportunity (US$ Bn), by Software/Platform, 2022 – 2031
Figure 102: Asia Pacific Building Information Modeling (BIM) Market Absolute Opportunity (US$ Bn), by Services, 2022 – 2031
Figure 103: Asia Pacific Building Information Modeling (BIM) Market Value Share Analysis, by Deployment, 2022
Figure 104: Asia Pacific Building Information Modeling (BIM) Market Value Share Analysis, by Deployment, 2031
Figure 105: Asia Pacific Building Information Modeling (BIM) Market Absolute Opportunity (US$ Bn), by On-premise, 2022 – 2031
Figure 106: Asia Pacific Building Information Modeling (BIM) Market Absolute Opportunity (US$ Bn), by Cloud, 2022 – 2031
Figure 107: Asia Pacific Building Information Modeling (BIM) Market Value Share Analysis, by Application, 2022
Figure 108: Asia Pacific Building Information Modeling (BIM) Market Value Share Analysis, by Application, 2031
Figure 109: Asia Pacific Building Information Modeling (BIM) Market Absolute Opportunity (US$ Bn), by Water and Wastewater, 2022 – 2031
Figure 110: Asia Pacific Building Information Modeling (BIM) Market Absolute Opportunity (US$ Bn), by Rail Transit and Aviation, 2022 – 2031
Figure 111: Asia Pacific Building Information Modeling (BIM) Market Absolute Opportunity (US$ Bn), by Energy Generation Facilities, 2022 – 2031
Figure 112: Asia Pacific Building Information Modeling (BIM) Market Absolute Opportunity (US$ Bn), by Roads, Bridges, and Highways, 2022 – 2031
Figure 113: Asia Pacific Building Information Modeling (BIM) Market Absolute Opportunity (US$ Bn), by Houses and Apartments, 2022 – 2031
Figure 114: Asia Pacific Building Information Modeling (BIM) Market Absolute Opportunity (US$ Bn), by Factories and Warehouses, 2022 – 2031
Figure 115: Asia Pacific Building Information Modeling (BIM) Market Absolute Opportunity (US$ Bn), by Educational Institutes and Commercial Spaces, 2022 – 2031
Figure 116: Asia Pacific Building Information Modeling (BIM) Market Absolute Opportunity (US$ Bn), by Government Buildings, 2022 – 2031
Figure 117: Asia Pacific Building Information Modeling (BIM) Market Absolute Opportunity (US$ Bn), by Dams and Others, 2022 – 2031
Figure 118: Asia Pacific Building Information Modeling (BIM) Market Value Share Analysis, by Country & Sub-region, 2022
Figure 119: Asia Pacific Building Information Modeling (BIM) Market Value Share Analysis, by Country & Sub-region, 2031
Figure 120: China Building Information Modeling (BIM) Market Opportunity Growth Analysis (US$ Bn) Forecast, 2022 – 2031
Figure 121: India Building Information Modeling (BIM) Market Opportunity Growth Analysis (US$ Bn) Forecast, 2022 – 2031
Figure 122: Japan Building Information Modeling (BIM) Market Opportunity Growth Analysis (US$ Bn) Forecast, 2022 – 2031
Figure 123: ASEAN Building Information Modeling (BIM) Market Opportunity Growth Analysis (US$ Bn) Forecast, 2022 – 2031
Figure 124: Middle East & Africa Building information modeling (BIM) Revenue Opportunity Share, by Component
Figure 125: Middle East & Africa Building information modeling (BIM) Revenue Opportunity Share, by Deployment
Figure 126: Middle East & Africa Building information modeling (BIM) Revenue Opportunity Share, by Application
Figure 127: Middle East & Africa l Building Information Modeling (BIM) Market Value Share Analysis, by Component, 2022
Figure 128: Middle East & Africa Building Information Modeling (BIM) Market Value Share Analysis, by Component, 2031
Figure 129: Middle East & Africa Building Information Modeling (BIM) Market Absolute Opportunity (US$ Bn), by Software/Platform (SIP) Trunking, 2022 – 2031
Figure 130: Middle East & Africa Building Information Modeling (BIM) Market Absolute Opportunity (US$ Bn), by Services, 2022 – 2031
Figure 131: Middle East & Africa Building Information Modeling (BIM) Market Value Share Analysis, by Deployment, 2022
Figure 132: Middle East & Africa Building Information Modeling (BIM) Market Value Share Analysis, by Deployment, 2031
Figure 133: Middle East & Africa Building Information Modeling (BIM) Market Absolute Opportunity (US$ Bn), by On-premise, 2022 – 2031
Figure 134: Middle East & Africa Building Information Modeling (BIM) Market Absolute Opportunity (US$ Bn), by Cloud, 2022 – 2031
Figure 135: Middle East & Africa Building Information Modeling (BIM) Market Value Share Analysis, by Application, 2022
Figure 136: Middle East & Africa Building Information Modeling (BIM) Market Value Share Analysis, by Application, 2031
Figure 137: Middle East & Africa Building Information Modeling (BIM) Market Absolute Opportunity (US$ Bn), by Water and Wastewater, 2022 – 2031
Figure 138: Middle East & Africa Building Information Modeling (BIM) Market Absolute Opportunity (US$ Bn), by Rail Transit and Aviation, 2022 – 2031
Figure 139: Middle East & Africa Building Information Modeling (BIM) Market Absolute Opportunity (US$ Bn), by Energy Generation Facilities, 2022 – 2031
Figure 140: Middle East & Africa Building Information Modeling (BIM) Market Absolute Opportunity (US$ Bn), by Roads, Bridges, and Highways, 2022 – 2031
Figure 141: Middle East & Africa Building Information Modeling (BIM) Market Absolute Opportunity (US$ Bn), by Houses and Apartments, 2022 – 2031
Figure 142: Middle East & Africa Building Information Modeling (BIM) Market Absolute Opportunity (US$ Bn), by Factories and Warehouses, 2022 – 2031
Figure 143: Middle East & Africa Building Information Modeling (BIM) Market Absolute Opportunity (US$ Bn), by Educational Institutes and Commercial Spaces, 2022 – 2031
Figure 144: Middle East & Africa Building Information Modeling (BIM) Market Absolute Opportunity (US$ Bn), by Government Buildings, 2022 – 2031
Figure 145: Middle East & Africa Building Information Modeling (BIM) Market Absolute Opportunity (US$ Bn), by Dams and Others, 2022 – 2031
Figure 146: Middle East & Africa Building Information Modeling (BIM) Market Value Share Analysis, by Country & Sub-region, 2022
Figure 147: Middle East & Africa Building Information Modeling (BIM) Market Value Share Analysis, by Country & Sub-region, 2031
Figure 148: Saudi Arabia Building Information Modeling (BIM) Market Opportunity Growth Analysis (US$ Bn) Forecast, 2022 – 2031
Figure 149: U.A.E. Building Information Modeling (BIM) Market Opportunity Growth Analysis (US$ Bn) Forecast, 2022 – 2031
Figure 150: South Africa Building Information Modeling (BIM) Market Opportunity Growth Analysis (US$ Bn) Forecast, 2022 – 2031
Figure 151: South America Building information modeling (BIM) Revenue Opportunity Share, by Component
Figure 152: South America Building information modeling (BIM) Revenue Opportunity Share, by Deployment
Figure 153: South America Building information modeling (BIM) Revenue Opportunity Share, by Application
Figure 154: South America Building Information Modeling (BIM) Market Value Share Analysis, by Component, 2022
Figure 155: South America Building Information Modeling (BIM) Market Value Share Analysis, by Component, 2031
Figure 156: South America Building Information Modeling (BIM) Market Absolute Opportunity (US$ Bn), by Software/Platform, 2022 – 2031
Figure 157: South America Building Information Modeling (BIM) Market Absolute Opportunity (US$ Bn), by Services, 2022 – 2031
Figure 158: South America Building Information Modeling (BIM) Market Value Share Analysis, by Deployment, 2022
Figure 159: South America Building Information Modeling (BIM) Market Value Share Analysis, by Deployment, 2031
Figure 160: South America Building Information Modeling (BIM) Market Absolute Opportunity (US$ Bn), by On-premise, 2022 – 2031
Figure 161: South America Building Information Modeling (BIM) Market Absolute Opportunity (US$ Bn), by Cloud, 2022 – 2031
Figure 162: South America Building Information Modeling (BIM) Market Value Share Analysis, by Application, 2022
Figure 163: South America Building Information Modeling (BIM) Market Value Share Analysis, by Application, 2031
Figure 164: South America Building Information Modeling (BIM) Market Absolute Opportunity (US$ Bn), by Water and Wastewater, 2022 – 2031
Figure 165: South America Building Information Modeling (BIM) Market Absolute Opportunity (US$ Bn), by Rail Transit and Aviation, 2022 – 2031
Figure 166: South America Building Information Modeling (BIM) Market Absolute Opportunity (US$ Bn), by Energy Generation Facilities, 2022 – 2031
Figure 167: South America Building Information Modeling (BIM) Market Absolute Opportunity (US$ Bn), by Roads, Bridges, and Highways, 2022 – 2031
Figure 168: South America Building Information Modeling (BIM) Market Absolute Opportunity (US$ Bn), by Houses and Apartments, 2022 – 2031
Figure 169: South America Building Information Modeling (BIM) Market Absolute Opportunity (US$ Bn), by Factories and Warehouses, 2022 – 2031
Figure 170: South America Building Information Modeling (BIM) Market Absolute Opportunity (US$ Bn), by Educational Institutes and Commercial Spaces, 2022 – 2031
Figure 171: South America Building Information Modeling (BIM) Market Absolute Opportunity (US$ Bn), by Government Buildings, 2022 – 2031
Figure 172: South America Building Information Modeling (BIM) Market Absolute Opportunity (US$ Bn), by Dams and Others, 2022 – 2031
Figure 173: South America Building Information Modeling (BIM) Market Value Share Analysis, by Country & Sub-region, 2022
Figure 174: South America Building Information Modeling (BIM) Market Value Share Analysis, by Country & Sub-region, 2031
Figure 175: Brazil Building Information Modeling (BIM) Market Opportunity Growth Analysis (US$ Bn) Forecast, 2022 – 2031
Figure 176: Argentina Building Information Modeling (BIM) Market Opportunity Growth Analysis (US$ Bn) Forecast, 2022 – 2031
Copyright © Transparency Market Research, Inc. All Rights reserved
Trust Online


Building Information Modeling [BIM] Market