
Analysts’ Viewpoint on Oral Rehydration Solution (ORS) Market Scenario
Rise in burden of diarrhea, effective government ORS campaigns for diarrhea management, and increase in significance & adoption of ORS in sports are driving the global oral rehydration solution market size. Diarrhea is one of the prominent causes of morbidity and mortality across the globe, especially in children. A large proportion of diarrheal diseases can be treated through adequate sanitation and ORS. The World Health Organization (WHO) and UNICEF recommend ORS and zinc to treat diarrhea. Government institutions across the globe are coming up with effective campaigning programs to reduce childhood mortality. Manufacturers in the market are investing significantly in R&D activities to provide effective and safe ORS products.
Oral rehydration solution (ORS) is an oral formulation mixture of sodium chloride, glucose, sodium citrate, glucose-salt solution, and potassium chloride. Various forms of electral such as powder, liquid, and tablet are intended for the treatment or prevention of dehydration owing to diarrhea. ORS is inexpensive, allows people to be treated away from hospitals including the home, and is easy to consume. It helps bring energy levels back up to normal when an individual suffers from dehydration. The United Nations Children’s Education Fund (UNICEF) has proved that the ORS packet could be manufactured for as little as US$ 0.05 per life-saving packet and administered by someone with zero medical training whatsoever. It has significantly minimized the burden on healthcare professionals (HCPs) by providing a treatment that mothers or other caregivers could give to their children. The WHO adopted ORS in 1978 as its major diarrhea medication. ORS has proven to avert 93% of deaths due to diarrhea infection. Zinc supplementation can reduce deaths from diarrhea by 23%. Large number of studies have been undertaken over the last two decades to develop an ‘improved ORS’. The aim was to introduce a product that is effective and safe for treating/preventing dehydration from all types of diarrhea.
Request a sample to get extensive insights into the Oral Rehydration Solution (ORS) Market
The communal transmission of COVID-19 virus challenged international and national healthcare infrastructure. According to the WHO, as of August 2022, more than 585.0 million confirmed cases of COVID-19 have been reported globally, including around 6.4 million deaths. The outbreak has increased the demand for health-oriented products, including ORS in general. Some of the most common symptoms of COVID-19 are vomiting and diarrhea, even in relatively mild cases. The issue of dehydration brought on by the pandemic can be resolved efficiently with the proper use of ORS, which offers significant benefits over other rehydration methods. ORS is non-invasive, does not require any special equipment to administer, and can be combined with other essential nutrients. It is quite effective in treating dehydration and related issues. Therefore, the COVID-19 pandemic is expected to present new opportunities for the global ORS market during the forecast period.
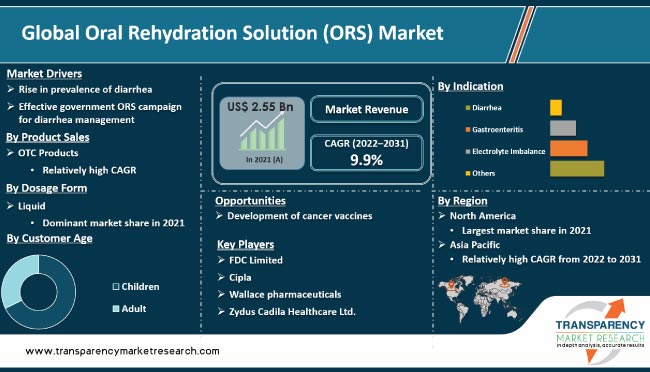
In terms of product sales, the OTC products segment dominated the global oral rehydration solution (ORS) market in 2021. The segment's dominance can be ascribed to the increase in availability of all forms of ORS products, including flavored liquid and effervescent tablets. Rise in trend among individuals to consume OTC ORS for mild diarrhea is projected to contribute to the growth of the OTC products segment during the forecast period. E-commerce is one of the larger and the rapidly-growing distribution segments for key manufacturers of ORS operating across the globe. The segment is driven by large third-party e-commerce platforms such as Amazon. The COVID-19 pandemic has led to a shift toward e-commerce for multiple health and wellness consumer products categories, and OTC ORS products are no exception, especially in developed countries.
Request a custom report on Oral Rehydration Solution (ORS) Market
Based on dosage form, the liquid segment dominated the global market in 2021. Energy drink and ORS consumption has risen significantly over the last two decades, particularly among adolescents and young adults. Dehydration is a common problem that many people face. Excessive stress, exercise, running, or usage of the body could cause sweating and breathing issues, resulting in the loss of essential body components and fluids.
In term of customer age, the adult segment accounted for major share of the global oral rehydration solution (ORS) market in 2021. ORS is promoted as the first line of treatment for dehydration and diarrhea among adults. It can also be consumed by healthy adults suffering from mild diarrhea. Furthermore, elderly adults with co-morbidities are as vulnerable to dehydration as children; therefore, ORS therapy plays a significant role in all such cases.
Based on indication, the diarrhea segment dominated the global oral rehydration solution (ORS) market in 2021. The trend is projected to continue during the forecast period. Oral rehydration solution (ORS) is the cornerstone of treatment for dehydration secondary to acute infectious diarrhea. The World Health Organization estimates that nearly 1.7 billion cases of pediatric diarrheal disease are recorded globally each year and oral rehydration therapy is the most rational tool in the fight against diarrheal diseases.
In terms of distribution channel, the retail pharmacies segment dominated the global market, with 45.8% share in 2021. The trend is projected to continue during the forecast period. Electrolyte imbalance (EI) is common in both hospitalized patients and general population. It is associated with increased morbidity and mortality. Retail pharmacies sell ORS powder and electrolyte drinks, which are OTC approved products. Moreover, oral rehydration solutions or electrolyte drinks fall under the OTC product sales; hence, local manufacturers or leading players introduce products with suitable packaging size. This is likely to drive the retail pharmacies segment.
As per global oral rehydration solution market trends, North America is projected to be a major region of the global ORS market during the forecast period. This can be ascribed to the presence of leading ORS hydration solution manufacturers such as Abbott, Gatorade, and SOS Hydration in the region.
The market in Asia Pacific is anticipated to grow at a high CAGR during the forecast period due to the rise in focus on malnutrition among children, increase in number of non-government organizations working for child health, and high investment in children’s healthcare programs in countries such as India. These factors are anticipated to augment the oral rehydration solution market growth in the region during the forecast period.
The oral rehydration solution (ORS) market report includes vital information about leading players in the global market. Companies are adopting product launch, divestiture, merger & acquisition, and partnership strategies to increase their market share. FDC Limited, Cipla, Wallace Pharmaceuticals, Liquid I.V., Zydus Cadila Healthcare Ltd., Shereya Life Sciences, Mankind Pharma, Intas Pharmaceuticals Ltd., Sun Pharma, Dr Reddy's, Alkem, Lupin, Cadila, RPG Life Sciences, Casca Remedies Pvt. Ltd., Halewood Laboratories Pvt. Ltd., Healthy Life Pharma Private Limited, and Okasa Pharma Pvt. Ltd. are prominent players operating in the global market.
Key players have been profiled in the oral rehydration solution (ORS) market report based on parameters such as company overview, financial overview, business strategies, product portfolio, business segments, and recent developments.
|
Attribute |
Detail |
|
Market Size Value in 2021 |
US$ 2.55 Bn |
|
Market Forecast Value in 2031 |
More than US$ 6.71 Bn |
|
Growth Rate (CAGR) for 2022–2031 |
9.9% |
|
Forecast Period |
2022–2031 |
|
Historical Data Available for |
2017–2021 |
|
Quantitative Units |
US$ Bn for Value |
|
Market Analysis |
It includes segment analysis as well as regional level analysis. Moreover, qualitative analysis includes drivers, restraints, opportunities, key trends, and parent industry overview. |
|
Competition Landscape |
|
|
Format |
Electronic (PDF) + Excel |
|
Market Segmentation |
|
|
Regions Covered |
|
|
Countries Covered |
|
|
Companies Profiled |
|
|
Customization Scope |
Available upon request |
|
Pricing |
Available upon request |
The global oral rehydration solution (ORS) market was valued at US$ 2.55 Bn in 2021
The global market is projected to reach more than US$ 6.71 Bn by 2031
The global oral rehydration solution (ORS) market is anticipated to advance at a CAGR of 9.9% from 2022 to 2031
Effective government ORS campaigns for diarrhea management and rise in prevalence of diarrhea
North America is expected to account for major share of the global oral rehydration solution (ORS) market during the forecast period
FDC Limited, Cipla, Wallace Pharmaceuticals, Liquid I.V., Zydus Cadila Healthcare Ltd., Shereya Life Sciences, Mankind Pharma, Intas Pharmaceuticals Ltd., Sun Pharma, Dr Reddy's, Alkem, Lupin, Cadila, RPG Life Sciences, Casca remedies Pvt. Ltd., Halewood Laboratories Pvt. Ltd., Healthy Life Pharma Private Limited, and Okasa Pharma Pvt. Ltd.
1. Preface
1.1. Market Definition and Scope
1.2. Market Segmentation
1.3. Key Research Objectives
1.4. Research Highlights
2. Assumptions and Research Methodology
3. Executive Summary: Global Oral Rehydration Solution (ORS) Market
4. Market Overview
4.1. Introduction
4.1.1. Product Sales Definition
4.1.2. Industry Evolution / Developments
4.2. Overview
4.3. Market Dynamics
4.3.1. Drivers
4.3.2. Restraints
4.3.3. Opportunities
4.4. Global Oral Rehydration Solution (ORS) Market Analysis and Forecast, 2017–2031
4.5. Porter’s Five Force Analysis
5. Key Insights
5.1. Raw material and Pricing trends
5.2. Regulatory Scenario by Region/globally
5.3. COVID-19 Impact Analysis
5.4. ORS campaigns by global institutions/NGOs
6. Global Oral Rehydration Solution (ORS) Market Analysis and Forecast, By Product Sales
6.1. Introduction & Definition
6.2. Key Findings / Developments
6.3. Market Value Forecast, by Product Sales, 2017–2031
6.3.1. OTC Products
6.3.2. Prescription
6.4. Market Attractiveness Analysis, By Product Sales
7. Global Oral Rehydration Solution (ORS) Market Analysis and Forecast, By Dosage Form
7.1. Introduction & Definition
7.2. Key Findings / Developments
7.3. Market Value Forecast, by Dosage Form, 2017–2031
7.3.1. Powder
7.3.2. Liquid
7.3.3. Tablet
7.4. Market Attractiveness Analysis, By Dosage Form
8. Global Oral Rehydration Solution (ORS) Market Analysis and Forecast, By Customer Age
8.1. Introduction & Definition
8.2. Key Findings / Developments
8.3. Market Value Forecast, by Customer Age, 2017–2031
8.3.1. Children
8.3.2. Adult
8.4. Market Attractiveness Analysis, By Customer Age
9. Global Oral Rehydration Solution (ORS) Market Analysis and Forecast, By Indication
9.1. Introduction & Definition
9.2. Key Findings / Developments
9.3. Market Value Forecast, by Indication, 2017–2031
9.3.1. Diarrhea
9.3.2. Gastroenteritis
9.3.3. Electrolyte Imbalance
9.3.4. Others
9.4. Market Attractiveness Analysis, By Indication
10. Global Oral Rehydration Solution (ORS) Market Analysis and Forecast, By Distribution Channel
10.1. Introduction & Definition
10.2. Key Findings / Developments
10.3. Market Value Forecast, by Distribution Channel, 2017–2031
10.3.1. Hospital Pharmacies
10.3.2. Retail Pharmacies
10.3.3. Online Pharmacies
10.4. Market Attractiveness Analysis, By Distribution Channel
11. Global Oral Rehydration Solution (ORS) Market Analysis and Forecast, By Region
11.1. Key Findings
11.2. Market Value Forecast, by Region
11.2.1. North America
11.2.2. Europe
11.2.3. Asia Pacific
11.2.4. Latin America
11.2.5. Middle East & Africa
11.3. Market Attractiveness Analysis, By Region
12. North America Oral Rehydration Solution (ORS) Market Analysis and Forecast
12.1. Introduction
12.1.1. Key Findings
12.2. Market Value Forecast, by Product Sales, 2017–2031
12.2.1. OTC Products
12.2.2. Prescription
12.3. Market Value Forecast, by Dosage Form, 2017–2031
12.3.1. Powder
12.3.2. Liquid
12.3.3. Tablet
12.4. Market Value Forecast, by Customer Age, 2017–2031
12.4.1. Children
12.4.2. Adult
12.5. Market Value Forecast, by Indication, 2017–2031
12.5.1. Diarrhea
12.5.2. Gastroenteritis
12.5.3. Electrolyte Imbalance
12.5.4. Others
12.6. Market Value Forecast, by Distribution Channel, 2017–2031
12.6.1. Hospital Pharmacies
12.6.2. Retail Pharmacies
12.6.3. Online Pharmacies
12.7. Market Value Forecast, by Country, 2017–2031
12.7.1. U.S.
12.7.2. Canada
12.8. Market Attractiveness Analysis
12.8.1. By Product Sales
12.8.2. By Dosage Form
12.8.3. By Customer Age
12.8.4. By Indication
12.8.5. By Distribution Channel
12.8.6. By Country
13. Europe Oral Rehydration Solution (ORS) Market Analysis and Forecast
13.1. Introduction
13.1.1. Key Findings
13.2. Market Value Forecast, by Product Sales, 2017–2031
13.2.1. OTC Products
13.2.2. Prescription
13.3. Market Value Forecast, by Dosage Form, 2017–2031
13.3.1. Powder
13.3.2. Liquid
13.3.3. Tablet
13.4. Market Value Forecast, by Customer Age, 2017–2031
13.4.1. Children
13.4.2. Adult
13.5. Market Value Forecast, by Indication, 2017–2031
13.5.1. Diarrhea
13.5.2. Gastroenteritis
13.5.3. Electrolyte Imbalance
13.5.4. Others
13.6. Market Value Forecast, by Distribution Channel, 2017–2031
13.6.1. Hospital Pharmacies
13.6.2. Retail Pharmacies
13.6.3. Online Pharmacies
13.7. Market Value Forecast, by Country/Sub-region, 2017–2031
13.7.1. Germany
13.7.2. U.K.
13.7.3. France
13.7.4. Spain
13.7.5. Italy
13.7.6. Rest of Europe
13.8. Market Attractiveness Analysis
13.8.1. By Product Sales
13.8.2. By Dosage Form
13.8.3. By Customer Age
13.8.4. By Indication
13.8.5. By Distribution Channel
13.8.6. By Country/Sub-region
14. Asia Pacific Oral Rehydration Solution (ORS) Market Analysis and Forecast
14.1. Introduction
14.1.1. Key Findings
14.2. Market Value Forecast, by Product Sales, 2017–2031
14.2.1. OTC Products
14.2.2. Prescription
14.3. Market Value Forecast, by Dosage Form, 2017–2031
14.3.1. Powder
14.3.2. Liquid
14.3.3. Tablet
14.4. Market Value Forecast, by Customer Age, 2017–2031
14.4.1. Children
14.4.2. Adult
14.5. Market Value Forecast, by Indication, 2017–2031
14.5.1. Diarrhea
14.5.2. Gastroenteritis
14.5.3. Electrolyte Imbalance
14.5.4. Others
14.6. Market Value Forecast, by Distribution Channel, 2017–2031
14.6.1. Hospital Pharmacies
14.6.2. Retail Pharmacies
14.6.3. Online Pharmacies
14.7. Market Value Forecast, by Country/Sub-region, 2017–2031
14.7.1. China
14.7.2. Japan
14.7.3. India
14.7.4. Australia & New Zealand
14.7.5. Rest of Asia Pacific
14.8. Market Attractiveness Analysis
14.8.1. By Product Sales
14.8.2. By Dosage Form
14.8.3. By Customer Age
14.8.4. By Indication
14.8.5. By Distribution Channel
14.8.6. By Country/Sub-region
15. Latin America Oral Rehydration Solution (ORS) Market Analysis and Forecast
15.1. Introduction
15.1.1. Key Findings
15.2. Market Value Forecast, by Product Sales, 2017–2031
15.2.1. OTC Products
15.2.2. Prescription
15.3. Market Value Forecast, by Dosage Form, 2017–2031
15.3.1. Powder
15.3.2. Liquid
15.3.3. Tablet
15.4. Market Value Forecast, by Customer Age, 2017–2031
15.4.1. Children
15.4.2. Adult
15.5. Market Value Forecast, by Indication, 2017–2031
15.5.1. Diarrhea
15.5.2. Gastroenteritis
15.5.3. Electrolyte Imbalance
15.5.4. Others
15.6. Market Value Forecast, by Distribution Channel, 2017–2031
15.6.1. Hospital Pharmacies
15.6.2. Retail Pharmacies
15.6.3. Online Pharmacies
15.7. Market Value Forecast, by Country/Sub-region, 2017–2031
15.7.1. Brazil
15.7.2. Mexico
15.7.3. Rest of Latin America
15.8. Market Attractiveness Analysis
15.8.1. By Product Sales
15.8.2. By Dosage Form
15.8.3. By Customer Age
15.8.4. By Indication
15.8.5. By Distribution Channel
15.8.6. By Country/Sub-region
16. Middle East & Africa Oral Rehydration Solution (ORS) Market Analysis and Forecast
16.1. Introduction
16.1.1. Key Findings
16.2. Market Value Forecast, by Product Sales, 2017–2031
16.2.1. OTC Products
16.2.2. Prescription
16.3. Market Value Forecast, by Dosage Form, 2017–2031
16.3.1. Powder
16.3.2. Liquid
16.3.3. Tablet
16.4. Market Value Forecast, by Customer Age, 2017–2031
16.4.1. Children
16.4.2. Adult
16.5. Market Value Forecast, by Indication, 2017–2031
16.5.1. Diarrhea
16.5.2. Gastroenteritis
16.5.3. Electrolyte Imbalance
16.5.4. Others
16.6. Market Value Forecast, by Distribution Channel, 2017–2031
16.6.1. Hospital Pharmacies
16.6.2. Retail Pharmacies
16.6.3. Online Pharmacies
16.7. Market Value Forecast, by Country/Sub-region, 2017–2031
16.7.1. GCC Countries
16.7.2. South Africa
16.7.3. Rest of Middle East & Africa
16.8. Market Attractiveness Analysis
16.8.1. By Product Sales
16.8.2. By Dosage Form
16.8.3. By Customer Age
16.8.4. By Indication
16.8.5. By Distribution Channel
16.8.6. By Country/Sub-region
17. Competition Landscape
17.1. Market Player – Competition Matrix (By Tier and Size of companies)
17.2. Market Share Analysis, by Company, 2021
17.3. Company Profiles
17.3.1. FDC Limited
17.3.1.1. Company Overview (HQ, Business Segments, Employee Strength)
17.3.1.2. Product Portfolio
17.3.1.3. SWOT Analysis
17.3.1.4. Strategic Overview
17.3.2. Cipla
17.3.2.1. Company Overview (HQ, Business Segments, Employee Strength)
17.3.2.2. Product Portfolio
17.3.2.3. SWOT Analysis
17.3.2.4. Strategic Overview
17.3.3. Wallace Pharmaceuticals
17.3.3.1. Company Overview (HQ, Business Segments, Employee Strength)
17.3.3.2. Product Portfolio
17.3.3.3. SWOT Analysis
17.3.3.4. Strategic Overview
17.3.4. Zydus Cadila Healthcare Ltd.
17.3.4.1. Company Overview (HQ, Business Segments, Employee Strength)
17.3.4.2. Product Portfolio
17.3.4.3. SWOT Analysis
17.3.4.4. Strategic Overview
17.3.5. Shereya Life Sciences
17.3.5.1. Company Overview (HQ, Business Segments, Employee Strength)
17.3.5.2. Product Portfolio
17.3.5.3. SWOT Analysis
17.3.5.4. Strategic Overview
17.3.6. Mankind Pharma
17.3.6.1. Company Overview (HQ, Business Segments, Employee Strength)
17.3.6.2. Product Portfolio
17.3.6.3. SWOT Analysis
17.3.6.4. Strategic Overview
17.3.7. Intas Pharmaceuticals Ltd.
17.3.7.1. Company Overview (HQ, Business Segments, Employee Strength)
17.3.7.2. Product Portfolio
17.3.7.3. SWOT Analysis
17.3.7.4. Strategic Overview
17.3.8. Sun Pharma
17.3.8.1. Company Overview (HQ, Business Segments, Employee Strength)
17.3.8.2. Product Portfolio
17.3.8.3. SWOT Analysis
17.3.8.4. Strategic Overview
17.3.9. Dr Reddy's
17.3.9.1. Company Overview (HQ, Business Segments, Employee Strength)
17.3.9.2. Product Portfolio
17.3.9.3. SWOT Analysis
17.3.9.4. Strategic Overview
17.3.10. Alkem
17.3.10.1. Company Overview (HQ, Business Segments, Employee Strength)
17.3.10.2. Product Portfolio
17.3.10.3. SWOT Analysis
17.3.10.4. Strategic Overview
17.3.11. Lupin
17.3.11.1. Company Overview (HQ, Business Segments, Employee Strength)
17.3.11.2. Product Portfolio
17.3.11.3. SWOT Analysis
17.3.11.4. Strategic Overview
17.3.12. Cadila
17.3.12.1. Company Overview (HQ, Business Segments, Employee Strength)
17.3.12.2. Product Portfolio
17.3.12.3. SWOT Analysis
17.3.12.4. Strategic Overview
17.3.13. RPG Life Sciences
17.3.13.1. Company Overview (HQ, Business Segments, Employee Strength)
17.3.13.2. Product Portfolio
17.3.13.3. SWOT Analysis
17.3.13.4. Strategic Overview
17.3.14. Casca remedies Pvt. Ltd.
17.3.14.1. Company Overview (HQ, Business Segments, Employee Strength)
17.3.14.2. Product Portfolio
17.3.14.3. SWOT Analysis
17.3.14.4. Strategic Overview
17.3.15. Halewood Laboratories Pvt. Ltd.
17.3.15.1. Company Overview (HQ, Business Segments, Employee Strength)
17.3.15.2. Product Portfolio
17.3.15.3. SWOT Analysis
17.3.15.4. Strategic Overview
17.3.16. Liquid I.V.
17.3.16.1. Company Overview (HQ, Business Segments, Employee Strength)
17.3.16.2. Product Portfolio
17.3.16.3. SWOT Analysis
17.3.16.4. Strategic Overview
List of Table
Table 01: Global Oral Rehydration Solution (ORS) Market Value (US$ Mn) Forecast, by Product Sales, 2017–2031
Table 02: Global Oral Rehydration Solution (ORS) Market Value (US$ Mn) Forecast, by OTC Products, 2017–2031
Table 03: Global Oral Rehydration Solution (ORS) Market Value (US$ Mn) Forecast, by Dosage Form, 2017–2031
Table 04: Global Oral Rehydration Solution (ORS) Market Value (US$ Mn) Forecast, by Customer Age, 2017–2031
Table 05: Global Oral Rehydration Solution (ORS) Market Value (US$ Mn) Forecast, by Indication, 2017–2031
Table 06: Global Oral Rehydration Solution (ORS) Market Value (US$ Mn) Forecast, by Distribution Channel, 2017–2031
Table 07: Global Oral Rehydration Solution (ORS) Market Value (US$ Mn) Forecast, by Region, 2017–2031
Table 08: North America Oral Rehydration Solution (ORS) Market Value (US$ Mn) Forecast, by Product Sales, 2017–2031
Table 09: North America Oral Rehydration Solution (ORS) Market Value (US$ Mn) Forecast, by OTC Products, 2017–2031
Table 10: North America Oral Rehydration Solution (ORS) Market Value (US$ Mn) Forecast, by Dosage Form, 2017–2031
Table 11: North America Oral Rehydration Solution (ORS) Market Volume (No. of Units) Forecast, by Dosage Form, 2017–2031
Table 12: North America Oral Rehydration Solution (ORS) Market Value (US$ Mn) Forecast, by Customer Age, 2017–2031
Table 13: North America Oral Rehydration Solution (ORS) Market Value (US$ Mn) Forecast, by Indication, 2017–2031
Table 14: North America Oral Rehydration Solution (ORS) Market Value (US$ Mn) Forecast, by Distribution Channel, 2017–2031
Table 15: North America Oral Rehydration Solution (ORS) Market Value (US$ Mn) Forecast, by Country, 2017–2031
Table 16: Europe Oral Rehydration Solution (ORS) Market Value (US$ Mn) Forecast, by Product Sales, 2017–2031
Table 17: Europe Oral Rehydration Solution (ORS) Market Value (US$ Mn) Forecast, by OTC Products, 2017–2031
Table 18: Europe Oral Rehydration Solution (ORS) Market Value (US$ Mn) Forecast, by Dosage Form, 2017–2031
Table 19: Europe Oral Rehydration Solution (ORS) Market Volume (No. of Units) Forecast, by Dosage Form, 2017–2031
Table 20: Europe Oral Rehydration Solution (ORS) Market Value (US$ Mn) Forecast, by Customer Age, 2017–2031
Table 21: Europe Oral Rehydration Solution (ORS) Market Value (US$ Mn) Forecast, by Indication, 2017–2031
Table 22: Europe Oral Rehydration Solution (ORS) Market Value (US$ Mn) Forecast, by Distribution Channel, 2017–2031
Table 23: Europe Oral Rehydration Solution (ORS) Market Value (US$ Mn) Forecast, by Country/Sub-region, 2017–2031
Table 24: Asia Pacific Oral Rehydration Solution (ORS) Market Value (US$ Mn) Forecast, by Product Sales, 2017–2031
Table 25: Asia Pacific Oral Rehydration Solution (ORS) Market Value (US$ Mn) Forecast, by OTC Products, 2017–2031
Table 26: Asia Pacific Oral Rehydration Solution (ORS) Market Value (US$ Mn) Forecast, by Dosage Form, 2017–2031
Table 27: Asia Pacific Oral Rehydration Solution (ORS) Market Volume (No. of Units) Forecast, by Dosage Form, 2017–2031
Table 28: Asia Pacific Oral Rehydration Solution (ORS) Market Value (US$ Mn) Forecast, by Customer Age, 2017–2031
Table 29: Asia Pacific Oral Rehydration Solution (ORS) Market Value (US$ Mn) Forecast, by Indication, 2017–2031
Table 30: Asia Pacific Oral Rehydration Solution (ORS) Market Value (US$ Mn) Forecast, by Distribution Channel, 2017–2031
Table 31: Asia Pacific Oral Rehydration Solution (ORS) Market Value (US$ Mn) Forecast, by Country/Sub-region, 2017–2031
Table 32: Latin America Oral Rehydration Solution (ORS) Market Value (US$ Mn) Forecast, by Product Sales, 2017–2031
Table 33: Latin America Oral Rehydration Solution (ORS) Market Value (US$ Mn) Forecast, by OTC Products, 2017–2031
Table 34: Latin America Oral Rehydration Solution (ORS) Market Value (US$ Mn) Forecast, by Dosage Form, 2017–2031
Table 35: Latin America Oral Rehydration Solution (ORS) Market Volume (No. of Units) Forecast, by Dosage Form, 2017–2031
Table 36: Latin America Oral Rehydration Solution (ORS) Market Value (US$ Mn) Forecast, by Customer Age, 2017–2031
Table 37: Latin America Oral Rehydration Solution (ORS) Market Value (US$ Mn) Forecast, by Indication, 2017–2031
Table 38: Latin America Oral Rehydration Solution (ORS) Market Value (US$ Mn) Forecast, by Distribution Channel, 2017–2031
Table 39: Latin America Oral Rehydration Solution (ORS) Market Value (US$ Mn) Forecast, by Country/Sub-region, 2017–2031
Table 40: Middle East & Africa Oral Rehydration Solution (ORS) Market Value (US$ Mn) Forecast, by Product Sales, 2017–2031
Table 41: Middle East & Africa Oral Rehydration Solution (ORS) Market Value (US$ Mn) Forecast, by OTC Products, 2017–2031
Table 42: Middle East & Africa Oral Rehydration Solution (ORS) Market Value (US$ Mn) Forecast, by Dosage Form, 2017–2031
Table 43: Middle East & Africa Oral Rehydration Solution (ORS) Market Volume (No. of Units) Forecast, by Dosage Form, 2017–2031
Table 44: Middle East & Africa Oral Rehydration Solution (ORS) Market Value (US$ Mn) Forecast, by Customer Age, 2017–2031
Table 45: Middle East & Africa Oral Rehydration Solution (ORS) Market Value (US$ Mn) Forecast, by Indication, 2017–2031
Table 46: Middle East & Africa Oral Rehydration Solution (ORS) Market Value (US$ Mn) Forecast, by Distribution Channel, 2017–2031
Table 47: Middle East & Africa Oral Rehydration Solution (ORS) Market Value (US$ Mn) Forecast, by Country/Sub-region, 2017–2031
List of Figures
Figure 01: Global Oral Rehydration Solution (ORS) (CKD) Market Value (US$ Mn) Forecast, 2017–2031
Figure 02: Global Oral Rehydration Solution (ORS) Market Value Share, by Product Sales (2021)
Figure 03: Global Oral Rehydration Solution (ORS) Market Value Share, by Dosage Form (2021)
Figure 04: Global Oral Rehydration Solution (ORS) Market Value Share, by Customer Age (2021)
Figure 05: Global Oral Rehydration Solution (ORS) Market Value Share, by Indication (2021)
Figure 06: Global Oral Rehydration Solution (ORS) Market Value Share, by Distribution Channel (2021)
Figure 07: Global Oral Rehydration Solution (ORS) Market Value Share, by End-user (2021)
Figure 08: Global Oral Rehydration Solution (ORS) Market Analysis and Forecast, by Product Sales, 2021 and 2031
Figure 09: Global Oral Rehydration Solution (ORS) Market Attractiveness Analysis, by Product Sales, 2022–2031
Figure 10: Global Oral Rehydration Solution (ORS) Market (US$ Mn), by OTC Products, 2017–2031
Figure 11: Global Oral Rehydration Solution (ORS) Market (US$ Mn), by Prescription, 2017-2031
Figure 12: Global Oral Rehydration Solution (ORS) Market Analysis and Forecast, by Dosage Form, 2021 and 2031
Figure 13: Global Oral Rehydration Solution (ORS) Market Attractiveness Analysis, by Dosage Form, 2022–2031
Figure 14: Global Oral Rehydration Solution (ORS) Market (US$ Mn), by Powder, 2017–2031
Figure 15: Global Oral Rehydration Solution (ORS) Market (US$ Mn), by Liquid, 2017-2031
Figure 16: Global Oral Rehydration Solution (ORS) Market (US$ Mn), by Tablet, 2017-2031
Figure 17: Global Oral Rehydration Solution (ORS) Market Analysis and Forecast, by Customer Age, 2021 and 2031
Figure 18: Global Oral Rehydration Solution (ORS) Market Attractiveness Analysis, by Customer Age, 2022–2031
Figure 19: Global Oral Rehydration Solution (ORS) Market (US$ Mn), by Children, 2017–2031
Figure 20: Global Oral Rehydration Solution (ORS) Market (US$ Mn), by Adult, 2017-2031
Figure 21: Global Oral Rehydration Solution (ORS) Market Analysis and Forecast, by Indication, 2021 and 2031
Figure 22: Global Oral Rehydration Solution (ORS) Market Attractiveness Analysis, by Indication, 2022–2031
Figure 23: Global Oral Rehydration Solution (ORS) Market (US$ Mn), by Diarrhea, 2017–2031
Figure 24: Global Oral Rehydration Solution (ORS) Market (US$ Mn), by Gastroenteritis, 2017-2031
Figure 25: Global Oral Rehydration Solution (ORS) Market (US$ Mn), by Electrolyte Imbalance, 2017–2031
Figure 26: Global Oral Rehydration Solution (ORS) Market (US$ Mn), by Others, 2017-2031
Figure 27: Global Oral Rehydration Solution (ORS) Market Analysis and Forecast, by Distribution Channel, 2021 and 2031
Figure 28: Global Oral Rehydration Solution (ORS) Market Attractiveness Analysis, by Distribution Channel, 2022–2031
Figure 29: Global Oral Rehydration Solution (ORS) Market (US$ Mn), by Hospital Pharmacies, 2017–2031
Figure 30: Global Oral Rehydration Solution (ORS) Market (US$ Mn), by Retail Pharmacies, 2017-2031
Figure 31: Global Oral Rehydration Solution (ORS) Market (US$ Mn), by Online Pharmacies, 2017-2031
Figure 32: Global Oral Rehydration Solution (ORS) Market Value Share Analysis, by Region, 2021 and 2031
Figure 33: Global Oral Rehydration Solution (ORS) Market Attractiveness, by Region, 2022-2031
Figure 34: North America Oral Rehydration Solution (ORS) Market Value (US$ Mn) Forecast, 2017–2031
Figure 35: North America Oral Rehydration Solution (ORS) Market Analysis and Forecast, by Product Sales, 2021 and 2031
Figure 36: North America Oral Rehydration Solution (ORS) Market Attractiveness Analysis, by Product Sales, 2022–2031
Figure 37: North America Oral Rehydration Solution (ORS) Market Analysis and Forecast, by Dosage Form, 2021 and 2031
Figure 38: North America Oral Rehydration Solution (ORS) Market Attractiveness Analysis, by Dosage Form, 2022–2031
Figure 39: North America Oral Rehydration Solution (ORS) Market Analysis and Forecast, by Customer Age, 2021 and 2031
Figure 40: North America Oral Rehydration Solution (ORS) Market Attractiveness Analysis, by Customer Age, 2022–2031
Figure 41: North America Oral Rehydration Solution (ORS) Market Analysis and Forecast, by Indication, 2021 and 2031
Figure 42: North America Oral Rehydration Solution (ORS) Market Attractiveness Analysis, by Indication, 2022–2031
Figure 43: North America Oral Rehydration Solution (ORS) Market Analysis and Forecast, by Distribution Channel, 2021 and 2031
Figure 44: North America Oral Rehydration Solution (ORS) Market Attractiveness Analysis, by Distribution Channel, 2022–2031
Figure 45: North America Oral Rehydration Solution (ORS) Market Analysis and Forecast, by Country, 2021 and 2031
Figure 46: North America Oral Rehydration Solution (ORS) Market Attractiveness Analysis, by Country, 2022–2031
Figure 47: Europe Oral Rehydration Solution (ORS) Market Value (US$ Mn) Forecast, 2017–2031
Figure 48: Europe Oral Rehydration Solution (ORS) Market Analysis and Forecast, by Product Sales, 2021 and 2031
Figure 49: Europe Oral Rehydration Solution (ORS) Market Attractiveness Analysis, by Product Sales, 2022–2031
Figure 50: Europe Oral Rehydration Solution (ORS) Market Analysis and Forecast, by Dosage Form, 2021 and 2031
Figure 51: Europe Oral Rehydration Solution (ORS) Market Attractiveness Analysis, by Dosage Form, 2022–2031
Figure 52: Europe Oral Rehydration Solution (ORS) Market Analysis and Forecast, by Customer Age, 2021 and 2031
Figure 53: Europe Oral Rehydration Solution (ORS) Market Attractiveness Analysis, by Customer Age, 2022–2031
Figure 54: Europe Oral Rehydration Solution (ORS) Market Analysis and Forecast, by Indication, 2021 and 2031
Figure 55: Europe Oral Rehydration Solution (ORS) Market Attractiveness Analysis, by Indication, 2022–2031
Figure 56: Europe Oral Rehydration Solution (ORS) Market Analysis and Forecast, by Distribution Channel, 2021 and 2031
Figure 57: Europe Oral Rehydration Solution (ORS) Market Attractiveness Analysis, by Distribution Channel, 2022–2031
Figure 58: Europe Oral Rehydration Solution (ORS) Market Analysis and Forecast, Country/Sub-region, 2021 and 2031
Figure 59: Europe Oral Rehydration Solution (ORS) Market Attractiveness Analysis, by Country/Sub-region, 2022–2031
Figure 60: Asia Pacific Oral Rehydration Solution (ORS) Market Value (US$ Mn) Forecast, 2017–2031
Figure 61: Asia Pacific Oral Rehydration Solution (ORS) Market Analysis and Forecast, by Product Sales, 2021 and 2031
Figure 62: Asia Pacific Oral Rehydration Solution (ORS) Market Attractiveness Analysis, by Product Sales, 2022–2031
Figure 63: Asia Pacific Oral Rehydration Solution (ORS) Market Analysis and Forecast, by Dosage Form, 2021 and 2031
Figure 64: Asia Pacific Oral Rehydration Solution (ORS) Market Attractiveness Analysis, by Dosage Form, 2022–2031
Figure 65: Asia Pacific Oral Rehydration Solution (ORS) Market Analysis and Forecast, by Customer Age, 2021 and 2031
Figure 66: Asia Pacific Oral Rehydration Solution (ORS) Market Attractiveness Analysis, by Customer Age, 2022–2031
Figure 67: Asia Pacific Oral Rehydration Solution (ORS) Market Analysis and Forecast, by Indication, 2021 and 2031
Figure 68: Asia Pacific Oral Rehydration Solution (ORS) Market Attractiveness Analysis, by Indication, 2022–2031
Figure 69: Asia Pacific Oral Rehydration Solution (ORS) Market Analysis and Forecast, by Distribution Channel, 2021 and 2031
Figure 70: Asia Pacific Oral Rehydration Solution (ORS) Market Attractiveness Analysis, by Distribution Channel, 2022–2031
Figure 71: Asia Pacific Oral Rehydration Solution (ORS) Market Analysis and Forecast, by Country/Sub-region, 2021 and 2031
Figure 72: Asia Pacific Oral Rehydration Solution (ORS) Market Attractiveness Analysis, by Country/Sub-region, 2022–2031
Figure 73: Latin America Oral Rehydration Solution (ORS) Market Value (US$ Mn) Forecast, 2017–2031
Figure 74: Latin America Oral Rehydration Solution (ORS) Market Analysis and Forecast, by Product Sales, 2021 and 2031
Figure 75; Latin America Oral Rehydration Solution (ORS) Market Attractiveness Analysis, by Product Sales, 2022–2031
Figure 76: Latin America Oral Rehydration Solution (ORS) Market Analysis and Forecast, by Dosage Form, 2021 and 2031
Figure 77: Latin America Oral Rehydration Solution (ORS) Market Attractiveness Analysis, by Dosage Form, 2022–2031
Figure 78: Latin America Oral Rehydration Solution (ORS) Market Analysis and Forecast, by Customer Age, 2021 and 2031
Figure 79: Latin America Oral Rehydration Solution (ORS) Market Attractiveness Analysis, by Customer Age, 2022–2031
Figure 80: Latin America Oral Rehydration Solution (ORS) Market Analysis and Forecast, by Indication, 2021 and 2031
Figure 81: Latin America Oral Rehydration Solution (ORS) Market Attractiveness Analysis, by Indication, 2022–2031
Figure 82: Latin America Oral Rehydration Solution (ORS) Market Analysis and Forecast, by Distribution Channel, 2021 and 2031
Figure 83: Latin America Oral Rehydration Solution (ORS) Market Attractiveness Analysis, by Distribution Channel, 2022–2031
Figure 84: Latin America Oral Rehydration Solution (ORS) Market Analysis and Forecast, by Country/Sub-region, 2021 and 2031
Figure 85: Latin America Oral Rehydration Solution (ORS) Market Attractiveness Analysis, by Country/Sub-region, 2022–2031
Figure 86: Middle East & Africa Oral Rehydration Solution (ORS) Market Value (US$ Mn) Forecast, 2017–2031
Figure 87: Middle East & Africa Oral Rehydration Solution (ORS) Market Analysis and Forecast, by Product Sales, 2021 and 2031
Figure 88: Middle East & Africa Oral Rehydration Solution (ORS) Market Attractiveness Analysis, by Product Sales, 2022–2031
Figure 89: Middle East & Africa Oral Rehydration Solution (ORS) Market Analysis and Forecast, by Dosage Form, 2021 and 2031
Figure 90: Middle East & Africa Oral Rehydration Solution (ORS) Market Attractiveness Analysis, by Dosage Form, 2022–2031
Figure 91: Middle East & Africa Oral Rehydration Solution (ORS) Market Analysis and Forecast, by Customer Age, 2021 and 2031
Figure 92: Middle East & Africa Oral Rehydration Solution (ORS) Market Attractiveness Analysis, by Customer Age, 2022–2031
Figure 93: Middle East & Africa Oral Rehydration Solution (ORS) Market Analysis and Forecast, by Indication, 2021 and 2031
Figure 94: Middle East & Africa Oral Rehydration Solution (ORS) Market Attractiveness Analysis, by Indication, 2022–2031
Figure 95; Middle East & Africa Oral Rehydration Solution (ORS) Market Analysis and Forecast, by Distribution Channel, 2021 and 2031
Figure 96: Middle East & Africa Oral Rehydration Solution (ORS) Market Attractiveness Analysis, by Distribution Channel, 2022–2031
Figure 97: Middle East & Africa Oral Rehydration Solution (ORS) Market Analysis and Forecast, by Country/Sub-region, 2021 and 2031
Figure 98: Middle East & Africa Oral Rehydration Solution (ORS) Market Attractiveness Analysis, by Country/Sub-region, 2022–2031
Copyright © Transparency Market Research, Inc. All Rights reserved
Trust Online


Oral Rehydration Solution [ORS] Market