

2022 U.S. RETAIL SALES DATA FOR THE PLANT-BASED FOODS INDUSTRY
Plant-based foods dollar sales grew 6.6% to $8 billion with units mirroring total food and animal-based food, declining 3%.
Coming off a year of rising inflation rates and continued supply network disruptions for all retail industries, with food being one of the hardest hit, plant-based foods performed well overall, despite the very real challenges unique to the plant-based foods industry. Plant-based food companies continued to adapt by bolstering their ingredient sourcing, securing funding, and innovating in a way that is meaningful to consumers. 2022 also saw growing scrutiny for the plant-based foods industry and speculation around whether the future for our nascent industry was as strong as initially predicted.
With this all in mind, we are proud to share the results of our 2022 U.S. retail sales data report for the plant-based foods industry. The topline takeaway from the report findings is: Consumer demand for plant-based food is strong, and the sales performance of plant-based foods has outpaced all speculation, demonstrating the utmost resiliency.
Our most recent data set, expanded, analyzed and categorized from SPINS data by the Plant Based Foods Association and The Good Food Institute, shows that plant-based food dollar sales grew 6.6% in 2022 to $8 billion, with unit sales mirroring the 3% decline also seen in total food and beverage, and animal-based foods. Despite inflation, lack of scale, subsidies, and shrinking retail space, consumers are making it clear that they desire plant-based foods.
TOTAL GROWTH OF PLANT-BASED FOODS
$8B
in dollar sales
6.6%
one-year growth
44.5%
three-year growth
“The plant-based foods industry has proven its resilience, weathering unprecedented challenges to maintain cross-category market shares and achieve $8 billion in U.S. retail sales. This success is a testament to the dedication of consumers who are looking for plant-based options for every eating occasion, and the innovative brands and marketplace partners who are working to meet growing demand for sustainable, healthy, and delicious options.”
Rising inflation impacted every segment of the food industry in 2022, leading to higher dollar sales for plant-based foods, as well as animal-based and total food: Across the board, these three sectors saw declining unit sales by 3% over 2021. Our pricing analysis revealed that the overall average retail price of animal-based foods increased by 15%, which is reflected in the category’s 11% sales growth.
Plant-based foods, however, maintained 6.6% sales growth in 2022, up from 5.9% in 2021, with only a 10% increase in average retail price. While there is still a retail price gap between plant-based and animal-based foods, due primarily to lack of scale, subsidies, and lack of expanded space in retail stores, the consistent plant-based growth and lower inflation bubble signal the overall health of the category. Importantly, plant-based dollar market share has also remained relatively stable at 4.5%, and unit share has also held firm at 4.5%.¹

The resilience of plant-based foods
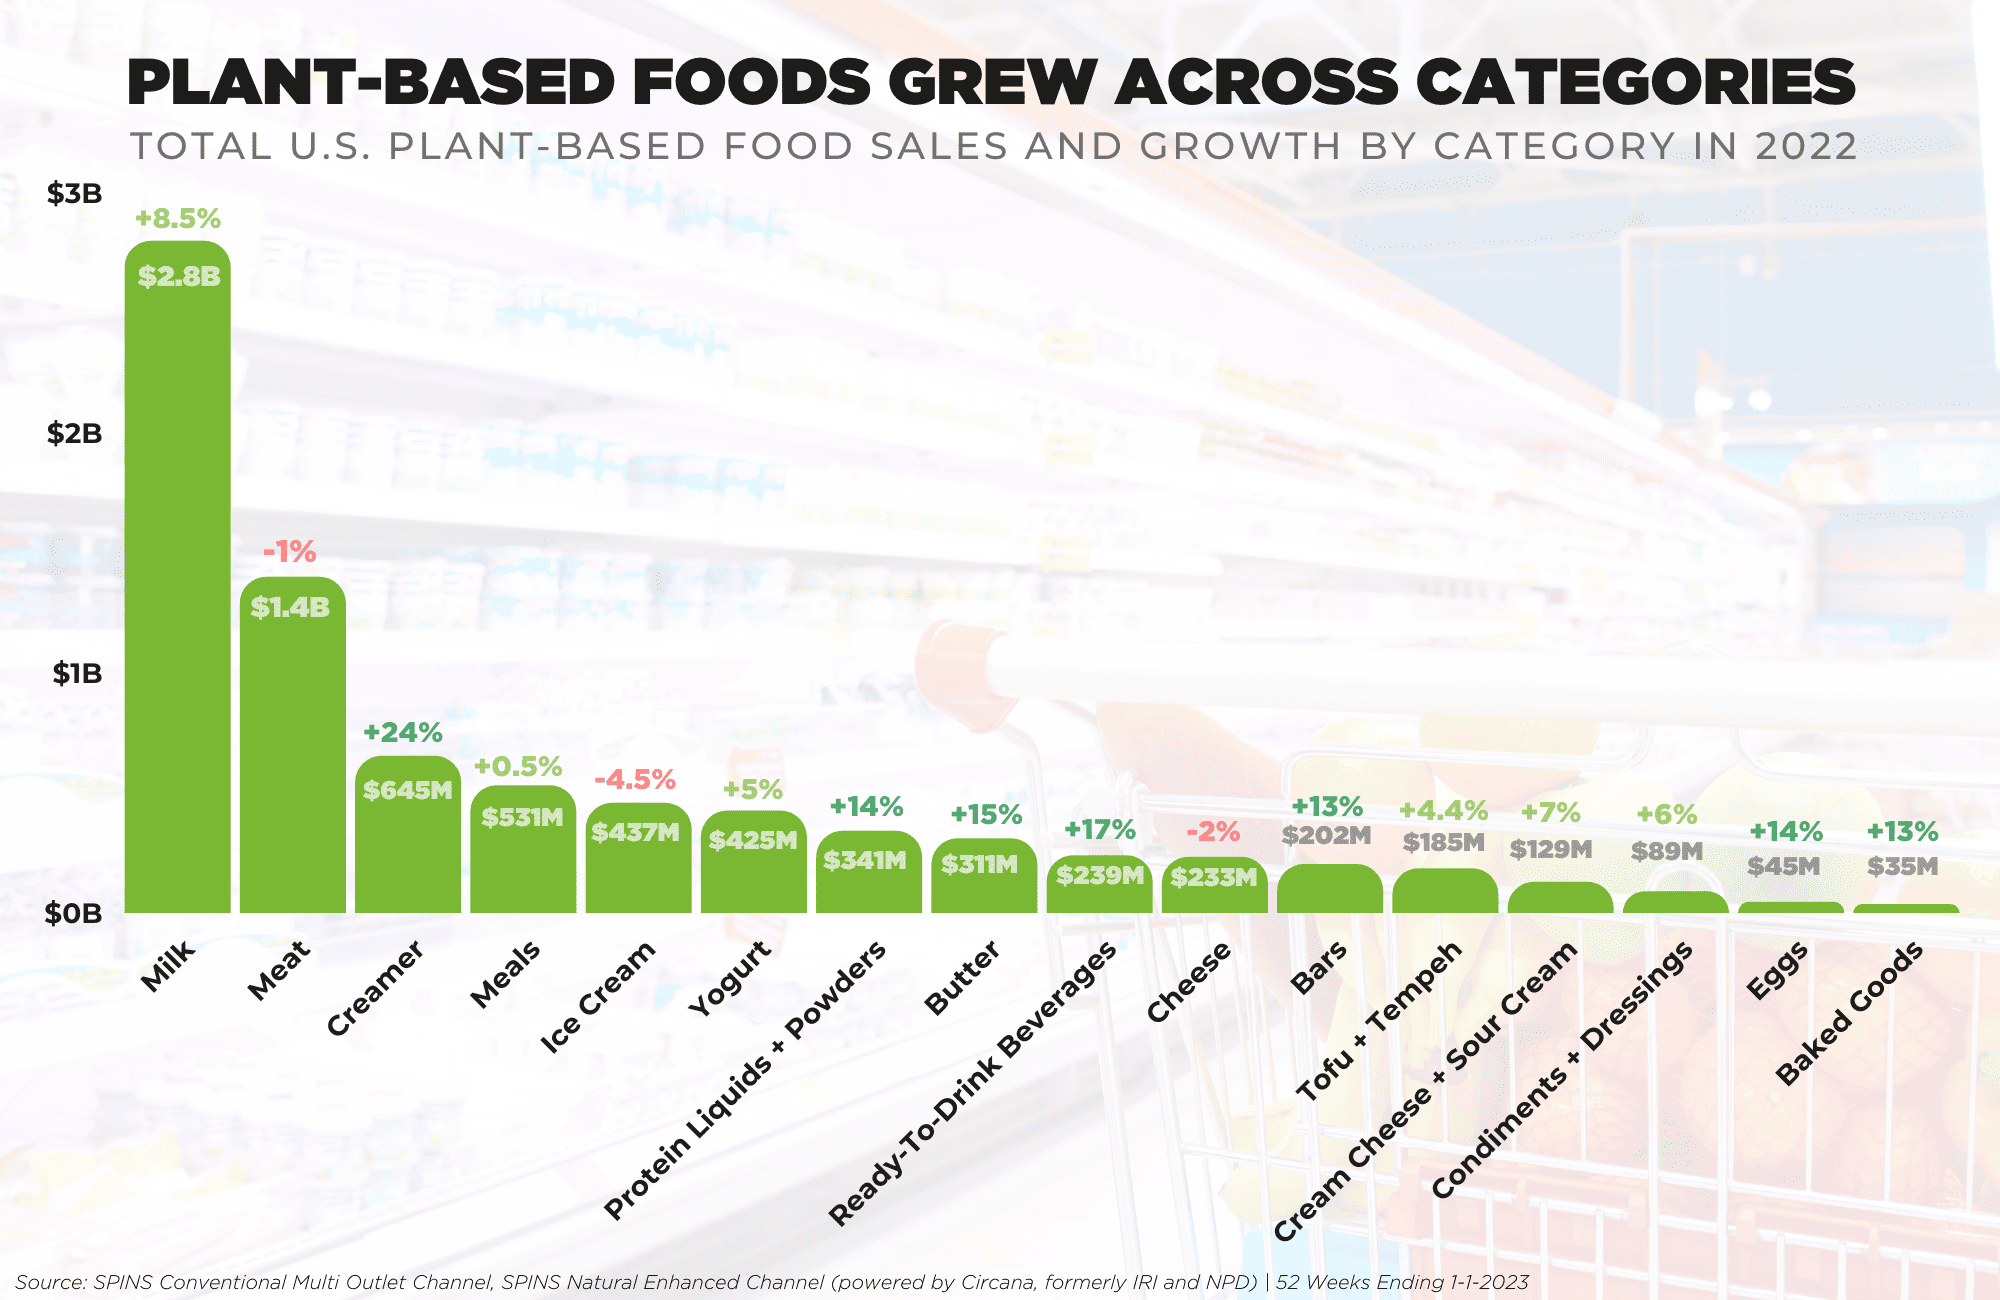
While all animal-based categories declined in units, plant-based categories saw marked unit growth in the following five categories: plant-based creamers, eggs, protein powders, ready-to-drink beverages, and dips and spreads. The variety of standout categories speaks to the expansion of consumer interest in plant-based options for every eating occasion, from post-workout smoothies to morning coffee to indulgent meals. Consumers are now seeking out plant-based options in even the most nascent categories, with consistent annual growth despite persistent industry challenges. This growth is directly connected to continued innovation and increasing distribution to meet evolving consumer needs.
While the growth of plant-based foods may not reach double-digit heights every single year, there is a larger underlying story unfolding: When scrutinizing grocery sales unit growth over the last four years since 2019, we see that animal-based foods and total food and beverage unit sales remain virtually flat at 1%, while plant-based foods unit growth is up 23%. This trajectory makes it clear that plant-based foods remain the growth engine for the food industry.
“The plant-based foods industry’s momentum and resilience–built on robust consumer demand– is evident across 2022 retail and e-commerce sales, and foodservice performance. PBFA is dedicated to working with retailers, foodservice providers, and brands to optimize their engagement with plant-based consumers and help shift food environments in favor of plant-based. We know consumer interest is strong, now it’s a matter of continuing to increase access and awareness for existing and future innovative plant-based options and furthering the exciting potential of this industry.”
Consumer interest remains strong
The plant-based shopper spans all generations and socioeconomic backgrounds, driven by motivations ranging from health to the environment to animal welfare—all insights that have remained clear and consistent over time. From our consumer research, we found 70% of the total U.S. population is consuming plant-based foods, up from 66% one year ago.

PLANT-BASED MILK
Plant-based milk remains the largest segment in the plant-based foods industry. With 40.6% of U.S. households purchasing plant-based milks—and an astounding 75.7% of consumers repeating their purchases—plant-based milk has become a household staple and a category powerhouse.

In 2022, the plant-based milk category grew 9% to $2.8 billion. Against a backdrop of heavy inflation, plant-based milk units declined by 2%. As consumers stretched their dollar across total food sales, the price gap between plant-based milk and animal-based milk impacted overall purchasing. In comparison, animal-based milk was also down 2% in units, but saw a 12% increase in dollar sales, illustrating the outsized role of inflated pricing in growing sales figures for animal-based milk.

PLANT-BASED MEAT
The landscape for plant-based meat is evolving as more products and varieties emerge in this category. After hitting a record 46% sales growth in 2020 over 2019, plant-based meat has held firm in dollar sales: In 2022, plant-based meat dollar sales remained remarkably stable at $1.4 billion, decreasing slightly by 1.2%. While overall units have declined by 8.2% in plant-based meat, this category continues to hold a steady 2.5% market share of all packaged meat.

Repeat buying rates for plant-based meat demonstrate consistent consumer interest in this category and offer insight into the potential growth opportunities to expand this developing segment.
Trends show that consumers are committed to incorporating plant-based meat into their diets, with 17.5% of households purchasing plant-based meat and a hefty 62.5% repeating their purchases.

Plant-based meat is diversifying
Frozen plant-based meat represents 63% of total plant-based meat sales, growing 5% in dollar sales, while shelf-stable meat—including plant-based jerky snacks and canned meat products—grew 3% in share, 83% in dollars, and 80% in units.
T total number of plant-based meat items grew by 5.1%, and many of those items were new such as different chicken types, pork, wings, and seafood, so the sales of the existing burgers were proliferated among a greater number of products, which consumers are adopting so the velocities are not as established yet. The plant-based meat category is diversifying in line with consumer interest in a growing variety of options—from plant-based chicken types, more categories of seafood, innovation in crumbles, deli slices, meatballs, and more. Ingredients are also getting more unique as brands hone in on trends in clean label options and promoting more vegetable-forward plant-based meats, along with the advancements in innovation to deliver plant-based meats that mimic the taste and texture of animal-based foods.

We know the number one thing that motivates consumers to purchase plant-based meats is their health benefits. Our primary research shows that 67% of the total U.S. population still believe that plant-based foods are healthier than animal-based foods, 42% plan to add more plant-based foods to substitute for animal-based foods, and 27% plan to eat less animal-based food in the future. Additionally, plant-based brands can stand out by incorporating bold global flavors, and hit consumer desire for more taste with less sodium. Frozen meats and meals featuring plant-based meats are also big trends we expect to bolster this developing category.
PLANT-BASED DAIRY
Plant-Based Creamer
Plant-based creamer, the third largest plant-based category after milk and meat, grew by 24% in dollars and 12% in units, while animal-based creamer units declined by 1.4%.
Brands innovated like never before, providing indulgent flavors like crème brulee, dark chocolate truffle, and toasted marshmallow, all of which can be found in the broader creamer section next to animal-based counterparts. We’re also seeing a growing variety of ingredients introduced to boost the functionality and nutrition of plant-based creamer options: Some of the most popular ingredients are oat, almond, soy, and coconut, with rising interest in blends.

Plant-Based Cheese, Yogurt, Butter, and Ice Cream
Plant-based cheese sales reached $230 million in 2022, declining by 1.71% since 2021. Household penetration of plant-based cheese stands at 5%; however, the repeat buying rate is an exceptionally strong 49.9%. In comparison, household penetration for animal-based cheese fell by 0.3%.
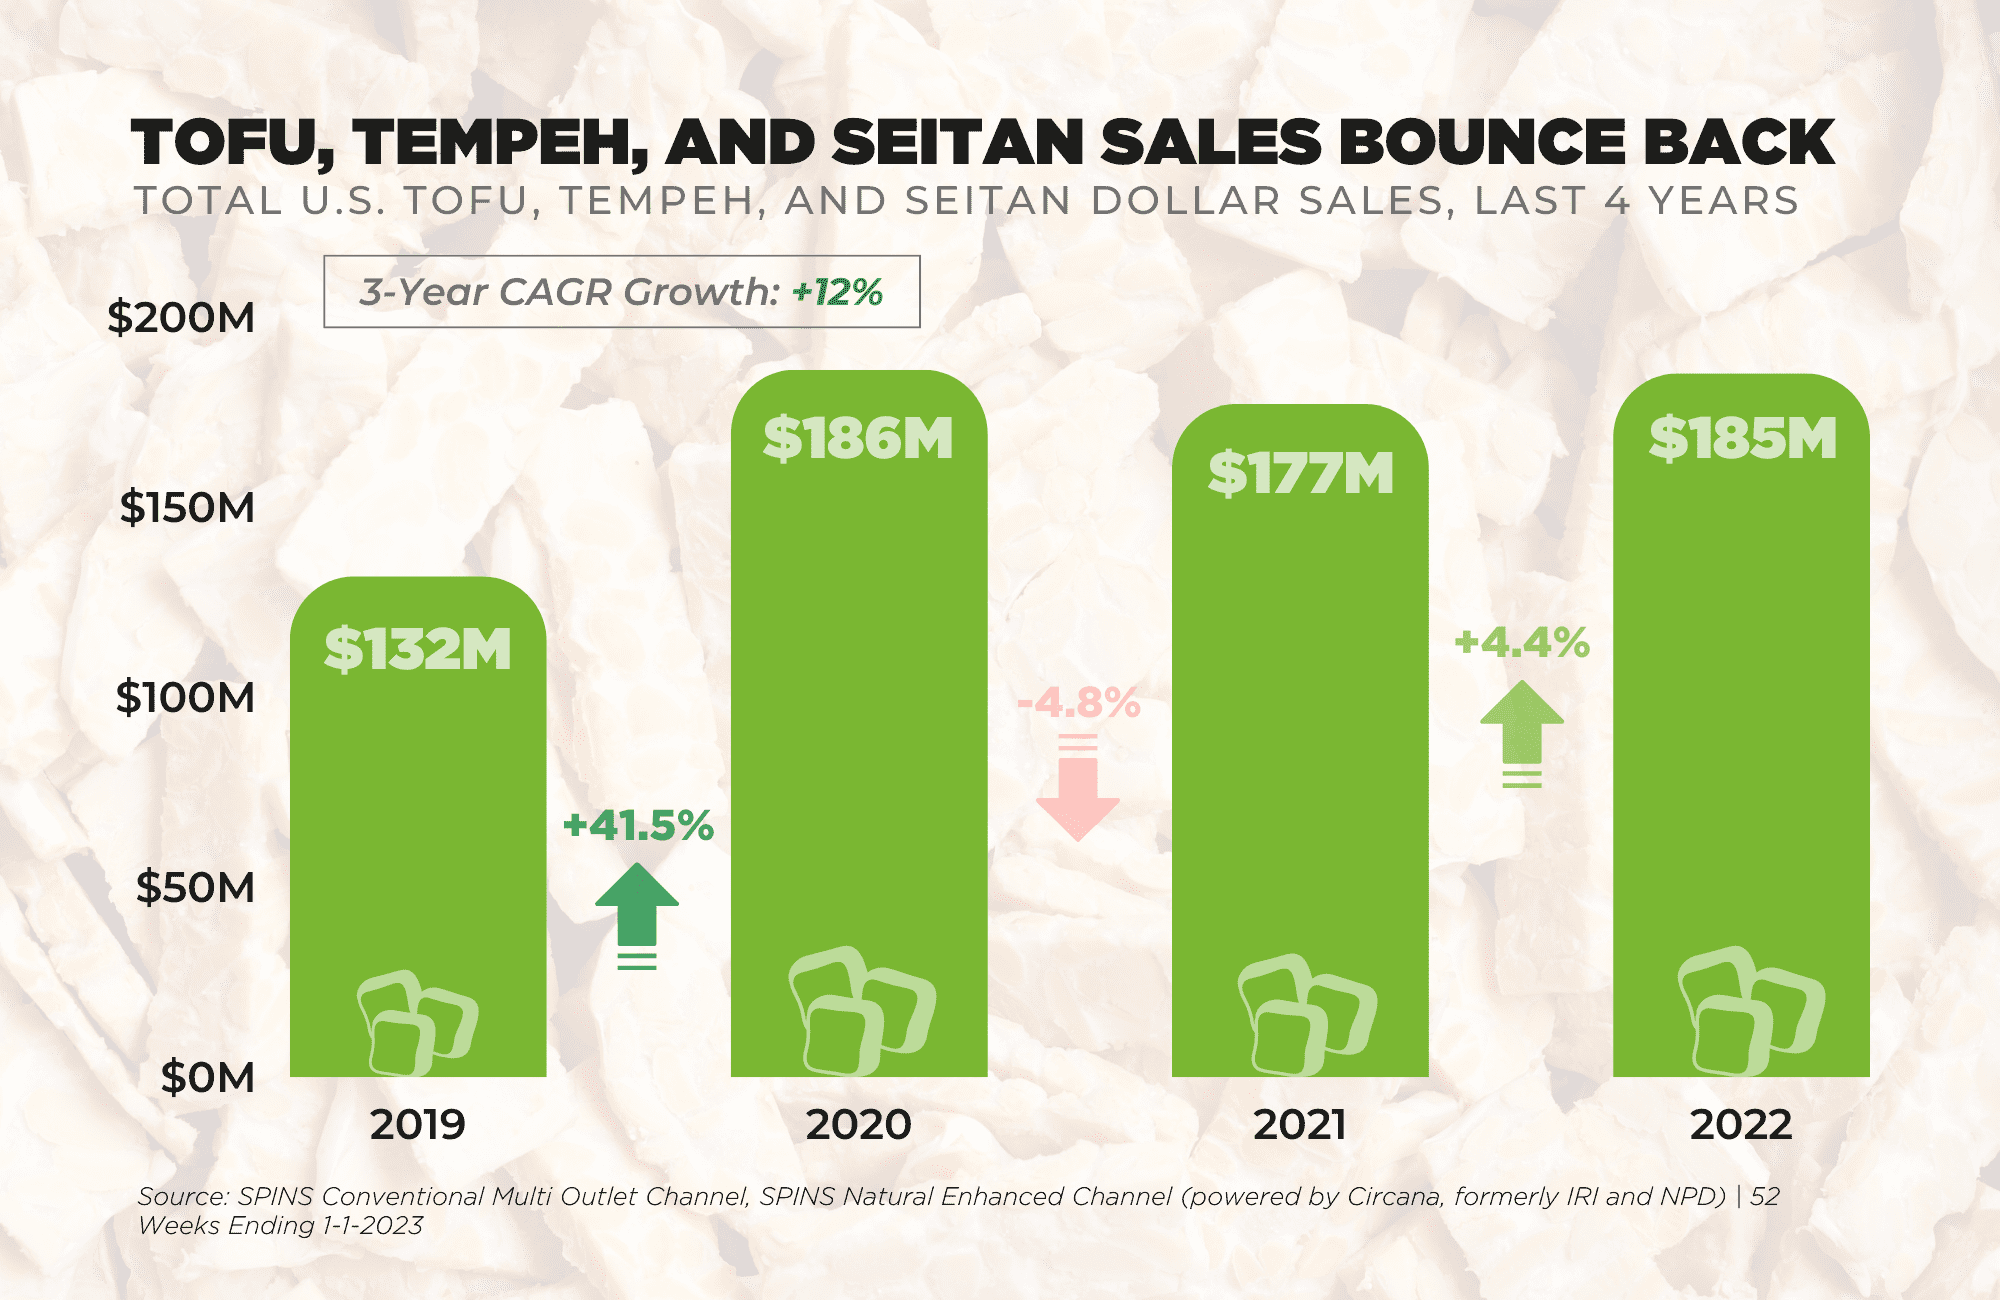
Sales growth for plant-based dairy categories remain strong, however there was a slight decline in unit sales across all except plant-based creamers illustrating shifting consumer shopping behaviors in context of inflation. Similar to plant-based creamer, the top reason consumers are switching to plant-based dairy options is primarily due to health considerations. While plant-based butter unit sales declined by 11% in 2022, dollar sales increased by15% to $310 million. Plant-based yogurt dollar sales increased by 5% to hit $425 million, and unit sales declined by 5%. Plant-based ice cream experienced unit sales declines of 9% as well as dollar sales declines of 4%, however this category still represents one of the largest in terms of plant-based food sales, bringing in $436 million in 2022.
PLANT-BASED EGGS
This category continues to experience eggs-ponential growth as consumer adoption, availability of options, and innovation grows. In 2022, plant-based eggs grew 14% in dollars and 21% in units. Comparatively, animal-based eggs grew 46% in dollars, yet declined by 1% in units. Pricing increases for animal-based eggs fueled by Avian flu and subsequent shortages reflect the increase in dollar growth paired with declining unit sales.

More to come
Tracking the momentum of the plant-based foods industry across the full breadth of channels illuminates an increasingly bright and hopeful outlook for the future of our industry. Our growing body of consumer and market insights show that there is an undeniable, long-term path forward for plant-based foods to continue to make inroads and that the strength and momentum of this industry have never been more apparent at every level.

METHODOLOGY
Point-of-sale data:
To size the U.S. retail market for plant-based foods, PBFA and GFI commissioned retail sales data from the market research firm SPINS. The firm built the dataset by first pulling in all products with the SPINS “plant-based positioned” product attribute. The dataset was further edited by adding plant-based private label categories and subcategories, and categories not coded, and refining the plant-based eggs category. Inherently plantbased foods, such as chickpeas and kale, are not included. Due to the nature of these categories, the retail data presented in this report may not align with standard SPINS categories. Additionally, SPINS pulled in relevant animal-based subcategories (excluding plant-based positioned products) in order to create the conventional categories discussed above. SPINS obtained the data over the 52-week, 104-week, 156-week, and 208-week periods ending December 26, 2022, from the SPINS Natural Enhanced and Conventional Multi Outlet (powered by Circana, formerly IRI & NPD) grocery channels. SPINS defines these channels as follows:
Conventional Multi Outlet (MULO): More than 111,000 retail locations spanning the grocery outlet, the drug outlet, and selected retailers across mass merchandisers, including Walmart, club, dollar, and military.
Natural Enhanced: Almost 2,000 full-format stores with $2 million+ in annual sales and 40 percent or more of UPC coded sales from natural/organic/specialty products.
This is generally considered the broadest available view of retail food sales, although not all retailers are represented. Some companies, such as Whole Foods Market, Trader Joe’s, and Costco, do not report their scan data to SPINS or Circana (formerly IRI & NPD).
Consumer panel data:
To understand consumer purchasing dynamics and demographics, PBFA and GFI also commissioned consumer panel data from SPINS. The process for pulling the panel data was separate from that for the POS data, which may result in minor category differences. SPINS acquires its panel data through the National Consumer Panel, a Nielsen and Circana (formerly IRI & NPD) joint venture composed of roughly 100,000 households. SPINS obtained the data over the 52-week, 104-week, 156-week, and 208-week periods ending January 1, 2023, from all U.S. outlets
