
Analysts’ Viewpoint on Market Scenario
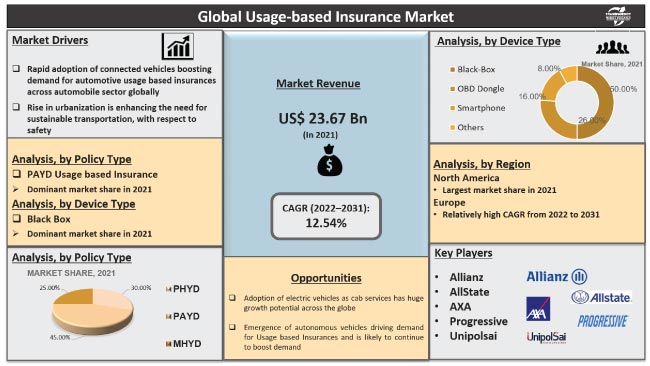
Rise in demand for connected vehicles and electric/hybrid vehicles is a key factor driving the user-based insurance market.
Increase in focus on highly precise products, which meet regulatory requirements or different legal aspects to ensure safety and reduce the chances of any malpractice, is also augmenting the demand for usage-based motor insurance. Furthermore, growth in demand for SUVs among the young population is boosting the demand for usage-based auto insurance. Key players such as Allianz, AllState, Aviva, AXA, Generalli, Gropama, and Insure the Box are focusing on upgrading policies for automotive such as Pay How You Drive (PHYD), Pay As You Drive (PAYD), and Manage How You Drive (MHYD) in order to offer their clients a product portfolio that is innovative, cost effective and diverse.
Manufacturers are also offering cutting-edge benefits and tapping into incremental opportunities to broaden their revenue streams.
Usage-based insurance is a vehicle insurance created to calculate the premium for the vehicle by observing how the drivers operate the vehicle. A wireless device is installed in the car to follow the vehicle's behavior. It transmits information to the insurance provider each time the premium is due. Increase in demand for automobiles across the globe is a key factor propelling the demand for usage-based car insurance. Real-time car monitoring and rise in interest in linked automobiles are also fueling the demand for car insurance based on usage.
The global usage-based insurance market is projected to grow at a rapid pace during the forecast period, owing to the increase in adoption of IoT, ADAS, as well as electric vehicles, and hybrid electric vehicles across the globe. The market is also estimated to grow significantly owing to the rise in purchasing power of the people and high demand for real-time data evaluation across the globe.
Request a sample to get extensive insights into the Market
Telematics has become commonplace in the automotive industry. Through usage-based insurance, vehicle telematics helps align insurance prices, and enhance driving behavior and road safety. The telematics sector has been growing, as governments across the globe, especially in the European Union and Russia, are planning to impose telematics regulations.
Rise in need for automobiles to be more connected and intelligent is also driving the demand for usage-based insurance telematics. According to a whitepaper from LexisNexis Risk Solutions, 85%–92% of people who bought automobile insurance in 2020 had a telematics-enabled coverage.
Electrification of vehicles is structurally transforming the transportation industry. Usage-based insurance works on real time data collection. It ensures the authenticity of insurance premiums so that insurance authorities can get accurate information of vehicle operation.
Rise in production of electric and hybrid electric vehicles across the globe is driving the demand for electric vehicle UBI. Additionally, government authorities are introducing various policies and initiatives to minimize the dependence on crude oils and boost the adoption rate of electric vehicles. This is also augmenting the user-based car insurance market size.
Increase in adoption of smart and connected technologies such as sensor-based detection systems and infrared sensors is a major factor driving the usage-based insurance market. These new technologies help enhance the on-road driving experience and safety.
Urbanization is likely to support sustainable growth by boosting productivity and encouraging the emergence of new concepts and innovations. Urban population accounts for major share of electric and autonomous vehicles. Increase in purchasing power of the people is also driving the market for safety features-enabled vehicles and services. In turn, this is likely to boost the market.
In terms of policy type, the pay as you drive (PAYD) segment held significant share of the global usage-based insurance market in 2021. Under the PAYD model, the premium amount is determined by the number of miles covered by the customer's vehicle. Odometers mounted in the car and connected to wireless devices are typically used to track the number of miles driven.
The pay how you drive (PHYD) segment is also anticipated to grow significantly during the forecast period. Here, the premium is assessed using information gathered by monitoring an individual’s driving habits. These include aspects such as acceleration, braking, location, and driving time.
Based on device type, the black box segment held dominant share of the global usage-based insurance market in 2021. The segment is expected to maintain its dominance during the forecast period. Higher accuracy is the primary factor driving the black box segment. Black box also captures large amount of data. Most car owner desire the conventional UBI technology known as the black box. Thus, demand for black box is likely to rise in the near future.
Europe, especially Italy, has the highest penetration rate of black box. The initial cost of the service is expected to be higher, as these gadgets are costly and need professional installment. The UBI market is also observing a transition from black box to an embedded system. As a result, the UBI technology is anticipated to be used widely in the near future.
In terms of volume, North America held around 50% share of the global usage-based insurance market in 2021, owing to the rise in interest in Mobility as a Service and expanding partnerships between telematics and insurance providers in the region.
The market for usage-based insurance in North America is also anticipated to be driven by the presence of top UBI firms such as Progressive Casualty Insurance Company, Allstate Insurance Company, State Farm Automobile Mutual Insurance Company, and Liberty Mutual Insurance Company in the U.S.
Europe is also a prominent market for automotive insurance. The region held around 37% share of the global market in 2021. Rise in demand for passenger vehicles and presence of key vehicle manufacturers are factors boosting the demand for usage-based insurance in the region.
Asia Pacific accounts for a considerable share of the market, owing to the presence of highly populated countries such as China and India, which are also the fastest growing economies in the world.
The global usage-based insurance market is fairly consolidated, with the largest players controlling a majority of the share. Most usage-based insurance companies are investing significantly in comprehensive research and development activities.
Expansion of product portfolios and mergers & acquisitions are the key strategies adopted by major players. Allianz, AllState, Aviva, AXA, Generalli, Gropama, Insure the Box, Liberty Mutual, MAIF, The Progressive Corporation, State Farm, Octo Telematics, CoverBox, TrueMotion, Nexar, MyDrive Solutions, Zendrive, Dash, and Cobra Automotive Technologies are the prominent entities operating in the market.
Request a custom report on Usage-based Insurance Market
Each of these players has been profiled in the usage-based insurance market report based on parameters such as company overview, financial overview, business strategies, product portfolio, business segments, and recent developments.
|
Attribute |
Detail |
|
Market Size Value in 2021 (Base Year) |
US$ 23.67 Bn |
|
Market Forecast Value in 2031 |
US$ 77.14 Bn |
|
Growth Rate (CAGR) |
12.54% |
|
Forecast Period |
2022-2031 |
|
Quantitative Units |
Units for Volume US$ Bn for Value |
|
Market Analysis |
It includes cross segment analysis at global as well as regional level. Furthermore, qualitative analysis includes drivers, restraints, opportunities, key trends, Porters Five Forces analysis, Value chain analysis, industry trend analysis, etc. |
|
Competition Landscape |
|
|
Format |
Electronic (PDF) + Excel |
|
Market Segmentation |
|
|
Regions Covered |
|
|
Countries Covered |
|
|
Companies Profiled |
|
|
Customization Scope |
Available upon Request |
|
Pricing |
Available upon Request |
The market was valued at US$ 23.67 Bn in 2021.
The industry is expected to grow at a CAGR of 12.54% by 2031.
The market would be worth US$ 77.14 Bn in 2031.
The U.S. is a prominent market for usage-based insurance due to high demand for advanced transport infrastructure in the country.
Pay as you drive (PAYD) is expected to be the fastest-growing segment of the global usage-based insurance market.
North America is the most lucrative region of the global usage-based insurance market and holds dominant market share.
Allianz, AllState, Aviva, AXA, Generalli, Gropama, Insure the Box, Liberty Mutual, MAIF, Progressive, State Farm, Octo Telematics, and CoverBox.
1. Executive Summary
1.1. Global Market Outlook
1.1.1. Market Value US$ Bn, 2017-2031
1.2. Competitive Dashboard Analysis
2. Market Overview
2.1. TMR Analysis and Recommendations
2.2. Market Coverage / Taxonomy
2.3. Market Definition / Scope / Limitations
2.4. Macro-Economic Factors
2.5. Market Dynamics
2.5.1. Drivers
2.5.2. Restraints
2.5.3. Opportunity
2.6. Market Factor Analysis
2.6.1. Porter’s Five Force Analysis
2.6.2. SWOT Analysis
2.7. Regulatory Scenario
2.8. Key Trend Analysis
3. Industry Ecosystem Analysis
3.1. Value Chain Analysis
3.2. Gross Margin Analysis
4. COVID-19 Impact Analysis – Usage-based Insurance Market
5. Pricing Analysis
5.1. Cost Structure Analysis
5.2. Profit Margin Analysis
6. Global Usage-based Insurance Market, By Policy Type
6.1. Market Snapshot
6.1.1. Introduction, Definition, and Key Findings
6.1.2. Market Growth & Y-o-Y Projections
6.1.3. Base Point Share Analysis
6.2. Global Usage-based Insurance Market Size Analysis & Forecast, 2017-2031, By Policy Type
6.2.1. Pay How You Drive (PHYD)
6.2.2. Pay As You Drive (PAYD)
6.2.3. Manage How You Drive (MHYD)
7. Global Usage-based Insurance Market, By Device Type
7.1. Market Snapshot
7.1.1. Introduction, Definition, and Key Findings
7.1.2. Market Growth & Y-o-Y Projections
7.1.3. Base Point Share Analysis
7.2. Global Usage-based Insurance Market Size Analysis & Forecast, 2017-2031, By Device Type
7.2.1. Black Box
7.2.2. OBD Dongle
7.2.3. Smartphone
7.2.4. Others
8. Global Usage-based Insurance Market, By Vehicle Type
8.1. Market Snapshot
8.1.1. Introduction, Definition, and Key Findings
8.1.2. Market Growth & Y-o-Y Projections
8.1.3. Base Point Share Analysis
8.2. Global Usage-based Insurance Market Size Analysis & Forecast, 2017-2031, By Vehicle Type
8.2.1. Passenger Vehicle
8.2.2. Commercial Vehicle
9. Global Usage-based Insurance Market, By Region
9.1. Market Snapshot
9.1.1. Introduction, Definition, and Key Findings
9.1.2. Market Growth & Y-o-Y Projections
9.1.3. Base Point Share Analysis
9.2. Global Usage-based Insurance Market Size Analysis & Forecast, 2017-2031, By Region
9.2.1. North America
9.2.2. Europe
9.2.3. Asia Pacific
9.2.4. Middle East & Africa
9.2.5. South America
10. North America Usage-based Insurance Market
10.1. Market Snapshot
10.2. North America Usage-based Insurance Market Size Analysis & Forecast, 2017-2031, By Policy Type
10.2.1. Pay How You Drive (PHYD)
10.2.2. Pay As You Drive (PAYD)
10.2.3. Manage How You Drive (MHYD)
10.3. North America Usage-based Insurance Market Size Analysis & Forecast, 2017-2031, By Device Type
10.3.1. Black Box
10.3.2. OBD Dongle
10.3.3. Smartphone
10.3.4. Others
10.4. North America Usage-based Insurance Market Size Analysis & Forecast, 2017-2031, By Vehicle Type
10.4.1. Passenger Vehicle
10.4.2. Commercial Vehicle
10.5. Key Country Analysis – North America Usage-based Insurance Market Size Analysis & Forecast, 2017-2031
10.5.1. U.S.
10.5.2. Canada
10.5.3. Mexico
11. Europe Usage-based Insurance Market
11.1. Market Snapshot
11.2. Europe Usage-based Insurance Market Size Analysis & Forecast, 2017-2031, By Policy Type
11.2.1. Pay How You Drive (PHYD)
11.2.2. Pay As You Drive (PAYD)
11.2.3. Manage How You Drive (MHYD)
11.3. Europe Usage-based Insurance Market Size Analysis & Forecast, 2017-2031, By Device Type
11.3.1. Black Box
11.3.2. OBD Dongle
11.3.3. Smartphone
11.3.4. Others
11.4. Europe Usage-based Insurance Market Size Analysis & Forecast, 2017-2031, By Vehicle Type
11.4.1. Passenger Vehicle
11.4.2. Commercial Vehicle
11.5. Key Country Analysis – Europe Usage-based Insurance Market Size Analysis & Forecast, 2017-2031
11.5.1. Germany
11.5.2. U. K.
11.5.3. France
11.5.4. Italy
11.5.5. Spain
11.5.6. Nordic Countries
11.5.7. Russia & CIS
11.5.8. Rest of Europe
12. Asia Pacific Usage-based Insurance Market
12.1. Market Snapshot
12.2. Asia Pacific Usage-based Insurance Market Size Analysis & Forecast, 2017-2031, By Policy Type
12.2.1. Pay How You Drive (PHYD)
12.2.2. Pay As You Drive (PAYD)
12.2.3. Manage How You Drive (MHYD)
12.3. Asia Pacific Usage-based Insurance Market Size Analysis & Forecast, 2017-2031, By Device Type
12.3.1. Black Box
12.3.2. OBD Dongle
12.3.3. Smartphone
12.3.4. Others
12.4. Asia Pacific Usage-based Insurance Market Size Analysis & Forecast, 2017-2031, By Vehicle Type
12.4.1. Passenger Vehicle
12.4.2. Commercial Vehicle
12.5. Key Country Analysis – Asia Pacific Usage-based Insurance Market Size Analysis & Forecast, 2017-2031
12.5.1. China
12.5.2. India
12.5.3. Japan
12.5.4. ASEAN Countries
12.5.5. South Korea
12.5.6. ANZ
12.5.7. Rest of Asia Pacific
13. Middle East & Africa Usage-based Insurance Market
13.1. Market Snapshot
13.2. Middle East & Africa Usage-based Insurance Market Size Analysis & Forecast, 2017-2031, By Policy Type
13.2.1. Pay How You Drive (PHYD)
13.2.2. Pay As You Drive (PAYD)
13.2.3. Manage How You Drive (MHYD)
13.3. Middle East & Africa Usage-based Insurance Market Size Analysis & Forecast, 2017-2031, By Device Type
13.3.1. Black Box
13.3.2. OBD Dongle
13.3.3. Smartphone
13.3.4. Others
13.4. Middle East & Africa Usage-based Insurance Market Size Analysis & Forecast, 2017-2031, By Vehicle Type
13.4.1. Passenger Vehicle
13.4.2. Commercial Vehicle
13.5. Key Country Analysis – Middle East & Africa Usage-based Insurance Market Size Analysis & Forecast, 2017-2031
13.5.1. GCC
13.5.2. South Africa
13.5.3. Turkey
13.5.4. Rest of Middle East & Africa
14. South America Usage-based Insurance Market
14.1. Market Snapshot
14.2. South America Usage-based Insurance Market Size Analysis & Forecast, 2017-2031, By Policy Type
14.2.1. Pay How You Drive (PHYD)
14.2.2. Pay As You Drive (PAYD)
14.2.3. Manage How You Drive (MHYD)
14.3. South America Usage-based Insurance Market Size Analysis & Forecast, 2017-2031, By Device Type
14.3.1. Black Box
14.3.2. OBD Dongle
14.3.3. Smartphone
14.3.4. Others
14.4. South America Usage-based Insurance Market Size Analysis & Forecast, 2017-2031, By Vehicle Type
14.4.1. Passenger Vehicle
14.4.2. Commercial Vehicle
14.5. Key Country Analysis – South America Usage-based Insurance Market Size Analysis & Forecast, 2017-2031
14.5.1. Brazil
14.5.2. Argentina
14.5.3. Rest of South America
15. Competitive Landscape
15.1. Company Share Analysis/ Brand Share Analysis, 2021
15.2. Pricing comparison among Key Players
15.3. Company Analysis for Each Player (Company Overview, Company Footprints, Production Locations, Product Portfolio, Competitors & Customers, Subsidiaries & Parent Organization, Recent Developments, Financial Analysis, Profitability, Revenue Share)
16. Company Profile/ Key Players
16.1. Allianz
16.1.1. Company Overview
16.1.2. Company Footprints
16.1.3. Production Locations
16.1.4. Product Portfolio
16.1.5. Competitors & Customers
16.1.6. Subsidiaries & Parent Organization
16.1.7. Recent Developments
16.1.8. Financial Analysis
16.1.9. Profitability
16.1.10. Revenue Share
16.2. AllState
16.2.1. Company Overview
16.2.2. Company Footprints
16.2.3. Production Locations
16.2.4. Product Portfolio
16.2.5. Competitors & Customers
16.2.6. Subsidiaries & Parent Organization
16.2.7. Recent Developments
16.2.8. Financial Analysis
16.2.9. Profitability
16.2.10. Revenue Share
16.3. Aviva
16.3.1. Company Overview
16.3.2. Company Footprints
16.3.3. Production Locations
16.3.4. Product Portfolio
16.3.5. Competitors & Customers
16.3.6. Subsidiaries & Parent Organization
16.3.7. Recent Developments
16.3.8. Financial Analysis
16.3.9. Profitability
16.3.10. Revenue Share
16.4. AXA
16.4.1. Company Overview
16.4.2. Company Footprints
16.4.3. Production Locations
16.4.4. Product Portfolio
16.4.5. Competitors & Customers
16.4.6. Subsidiaries & Parent Organization
16.4.7. Recent Developments
16.4.8. Financial Analysis
16.4.9. Profitability
16.4.10. Revenue Share
16.5. Generalli
16.5.1. Company Overview
16.5.2. Company Footprints
16.5.3. Production Locations
16.5.4. Product Portfolio
16.5.5. Competitors & Customers
16.5.6. Subsidiaries & Parent Organization
16.5.7. Recent Developments
16.5.8. Financial Analysis
16.5.9. Profitability
16.5.10. Revenue Share
16.6. Gropama
16.6.1. Company Overview
16.6.2. Company Footprints
16.6.3. Production Locations
16.6.4. Product Portfolio
16.6.5. Competitors & Customers
16.6.6. Subsidiaries & Parent Organization
16.6.7. Recent Developments
16.6.8. Financial Analysis
16.6.9. Profitability
16.6.10. Revenue Share
16.7. Insure the Box
16.7.1. Company Overview
16.7.2. Company Footprints
16.7.3. Production Locations
16.7.4. Product Portfolio
16.7.5. Competitors & Customers
16.7.6. Subsidiaries & Parent Organization
16.7.7. Recent Developments
16.7.8. Financial Analysis
16.7.9. Profitability
16.7.10. Revenue Share
16.8. Liberty Mutual
16.8.1. Company Overview
16.8.2. Company Footprints
16.8.3. Production Locations
16.8.4. Product Portfolio
16.8.5. Competitors & Customers
16.8.6. Subsidiaries & Parent Organization
16.8.7. Recent Developments
16.8.8. Financial Analysis
16.8.9. Profitability
16.8.10. Revenue Share
16.9. MAIF
16.9.1. Company Overview
16.9.2. Company Footprints
16.9.3. Production Locations
16.9.4. Product Portfolio
16.9.5. Competitors & Customers
16.9.6. Subsidiaries & Parent Organization
16.9.7. Recent Developments
16.9.8. Financial Analysis
16.9.9. Profitability
16.9.10. Revenue Share
16.10. Progressive
16.10.1. Company Overview
16.10.2. Company Footprints
16.10.3. Production Locations
16.10.4. Product Portfolio
16.10.5. Competitors & Customers
16.10.6. Subsidiaries & Parent Organization
16.10.7. Recent Developments
16.10.8. Financial Analysis
16.10.9. Profitability
16.10.10. Revenue Share
16.11. State Farm
16.11.1. Company Overview
16.11.2. Company Footprints
16.11.3. Production Locations
16.11.4. Product Portfolio
16.11.5. Competitors & Customers
16.11.6. Subsidiaries & Parent Organization
16.11.7. Recent Developments
16.11.8. Financial Analysis
16.11.9. Profitability
16.11.10. Revenue Share
16.12. Uniposai
16.12.1. Company Overview
16.12.2. Company Footprints
16.12.3. Production Locations
16.12.4. Product Portfolio
16.12.5. Competitors & Customers
16.12.6. Subsidiaries & Parent Organization
16.12.7. Recent Developments
16.12.8. Financial Analysis
16.12.9. Profitability
16.12.10. Revenue Share
16.13. Uniqa
16.13.1. Company Overview
16.13.2. Company Footprints
16.13.3. Production Locations
16.13.4. Product Portfolio
16.13.5. Competitors & Customers
16.13.6. Subsidiaries & Parent Organization
16.13.7. Recent Developments
16.13.8. Financial Analysis
16.13.9. Profitability
16.13.10. Revenue Share
16.14. Other Key Players
16.14.1. Company Overview
16.14.2. Company Footprints
16.14.3. Production Locations
16.14.4. Product Portfolio
16.14.5. Competitors & Customers
16.14.6. Subsidiaries & Parent Organization
16.14.7. Recent Developments
16.14.8. Financial Analysis
16.14.9. Profitability
16.14.10. Revenue Share
List of Tables
Table 1: Global Usage-based Insurance Market Volume (Units) Forecast, by Policy Type, 2017‒2031
Table 2: Global Usage-based Insurance Market Value (US$ Bn) Forecast, by Policy Type, 2017‒2031
Table 3: Global Usage-based Insurance Market Volume (Units) Forecast, by Device Type, 2017‒2031
Table 4: Global Usage-based Insurance Market Value (US$ Bn) Forecast, by Device Type, 2017‒2031
Table 5: Global Usage-based Insurance Market Volume (Units) Forecast, by Vehicle Type, 2017‒2031
Table 6: Global Usage-based Insurance Market Value (US$ Bn) Forecast, by Vehicle Type, 2017‒2031
Table 7: Global Usage-based Insurance Market Volume (Units) Forecast, by Region, 2017‒2031
Table 8: Global Usage-based Insurance Market Value (US$ Bn) Forecast, by Region, 2017‒2031
Table 9: North America Usage-based Insurance Market Volume (Units) Forecast, by Policy Type, 2017‒2031
Table 10: North America Usage-based Insurance Market Value (US$ Bn) Forecast, by Policy Type, 2017‒2031
Table 11: North America Usage-based Insurance Market Volume (Units) Forecast, by Device Type, 2017‒2031
Table 12: North America Usage-based Insurance Market Value (US$ Bn) Forecast, by Device Type, 2017‒2031
Table 13: North America Usage-based Insurance Market Volume (Units) Forecast, by Vehicle Type, 2017‒2031
Table 14: North America Usage-based Insurance Market Value (US$ Bn) Forecast, by Vehicle Type, 2017‒2031
Table 15: North America Usage-based Insurance Market Volume (Units) Forecast, by Country, 2017‒2031
Table 16: North America Usage-based Insurance Market Value (US$ Bn) Forecast, by Country, 2017‒2031
Table 17: Europe Usage-based Insurance Market Volume (Units) Forecast, by Policy Type, 2017‒2031
Table 18: Europe Usage-based Insurance Market Value (US$ Bn) Forecast, by Policy Type, 2017‒2031
Table 19: Europe Usage-based Insurance Market Volume (Units) Forecast, by Device Type, 2017‒2031
Table 20: Europe Usage-based Insurance Market Value (US$ Bn) Forecast, by Device Type, 2017‒2031
Table 21: Europe Usage-based Insurance Market Volume (Units) Forecast, by Vehicle Type, 2017‒2031
Table 22: Europe Usage-based Insurance Market Value (US$ Bn) Forecast, by Vehicle Type, 2017‒2031
Table 23: Europe Usage-based Insurance Market Volume (Units) Forecast, by Country, 2017‒2031
Table 24: Europe Usage-based Insurance Market Value (US$ Bn) Forecast, by Country, 2017‒2031
Table 25: Asia Pacific Usage-based Insurance Market Volume (Units) Forecast, by Policy Type, 2017‒2031
Table 26: Asia Pacific Usage-based Insurance Market Value (US$ Bn) Forecast, by Policy Type, 2017‒2031
Table 27: Asia Pacific Usage-based Insurance Market Volume (Units) Forecast, by Device Type, 2017‒2031
Table 28: Asia Pacific Usage-based Insurance Market Value (US$ Bn) Forecast, by Device Type, 2017‒2031
Table 29: Asia Pacific Usage-based Insurance Market Volume (Units) Forecast, by Vehicle Type, 2017‒2031
Table 30: Asia Pacific Usage-based Insurance Market Value (US$ Bn) Forecast, by Vehicle Type, 2017‒2031
Table 31: Asia Pacific Usage-based Insurance Market Volume (Units) Forecast, by Country, 2017‒2031
Table 32: Asia Pacific Usage-based Insurance Market Value (US$ Bn) Forecast, by Country, 2017‒2031
Table 33: Middle East & Africa Usage-based Insurance Market Volume (Units) Forecast, by Policy Type, 2017‒2031
Table 34: Middle East & Africa Usage-based Insurance Market Value (US$ Bn) Forecast, by Policy Type, 2017‒2031
Table 35: Middle East & Africa Usage-based Insurance Market Volume (Units) Forecast, by Device Type, 2017‒2031
Table 36: Middle East & Africa Usage-based Insurance Market Value (US$ Bn) Forecast, by Device Type, 2017‒2031
Table 37: Middle East & Africa Usage-based Insurance Market Volume (Units) Forecast, by Vehicle Type, 2017‒2031
Table 38: Middle East & Africa Usage-based Insurance Market Value (US$ Bn) Forecast, by Vehicle Type, 2017‒2031
Table 39: Middle East & Africa Usage-based Insurance Market Volume (Units) Forecast, by Country, 2017‒2031
Table 40: Middle East & Africa Usage-based Insurance Market Value (US$ Bn) Forecast, by Country, 2017‒2031
Table 41: South America Usage-based Insurance Market Volume (Units) Forecast, by Policy Type, 2017‒2031
Table 42: South America Usage-based Insurance Market Value (US$ Bn) Forecast, by Policy Type, 2017‒2031
Table 43: South America Usage-based Insurance Market Volume (Units) Forecast, by Device Type, 2017‒2031
Table 44: South America Usage-based Insurance Market Value (US$ Bn) Forecast, by Device Type, 2017‒2031
Table 45: South America Usage-based Insurance Market Volume (Units) Forecast, by Vehicle Type, 2017‒2031
Table 46: South America Usage-based Insurance Market Value (US$ Bn) Forecast, by Vehicle Type, 2017‒2031
Table 47: South America Usage-based Insurance Market Volume (Units) Forecast, by Country, 2017‒2031
Table 48: South America Usage-based Insurance Market Value (US$ Bn) Forecast, by Country, 2017‒2031
List of Figures
Figure 1: Global Usage-based Insurance Market Volume (Units) Forecast, by Policy Type, 2017‒2031
Figure 2: Global Usage-based Insurance Market Value (US$ Bn) Forecast, by Policy Type, 2017‒2031
Figure 3: Global Usage-based Insurance Market, Incremental Opportunity, by Policy Type, Value (US$ Bn), 2022‒2031
Figure 4: Global Usage-based Insurance Market Volume (Units) Forecast, by Device Type, 2017‒2031
Figure 5: Global Usage-based Insurance Market Value (US$ Bn) Forecast, by Device Type, 2017‒2031
Figure 6: Global Usage-based Insurance Market, Incremental Opportunity, by Device Type, Value (US$ Bn), 2022‒2031
Figure 7: Global Usage-based Insurance Market Volume (Units) Forecast, by Vehicle Type, 2017‒2031
Figure 8: Global Usage-based Insurance Market Value (US$ Bn) Forecast, by Vehicle Type, 2017‒2031
Figure 9: Global Usage-based Insurance Market, Incremental Opportunity, by Vehicle Type, Value (US$ Bn), 2022‒2031
Figure 10: Global Usage-based Insurance Market Volume (Units) Forecast, by Region, 2017‒2031
Figure 11: Global Usage-based Insurance Market Value (US$ Bn) Forecast, by Region, 2017‒2031
Figure 12: Global Usage-based Insurance Market, Incremental Opportunity, by Region, Value (US$ Bn), 2022‒2031
Figure 13: North America Usage-based Insurance Market Volume (Units) Forecast, by Policy Type, 2017‒2031
Figure 14: North America Usage-based Insurance Market Value (US$ Bn) Forecast, by Policy Type, 2017‒2031
Figure 15: North America Usage-based Insurance Market, Incremental Opportunity, by Policy Type, Value (US$ Bn), 2022‒2031
Figure 16: North America Usage-based Insurance Market Volume (Units) Forecast, by Device Type, 2017‒2031
Figure 17: North America Usage-based Insurance Market Value (US$ Bn) Forecast, by Device Type, 2017‒2031
Figure 18: North America Usage-based Insurance Market, Incremental Opportunity, by Device Type, Value (US$ Bn), 2022‒2031
Figure 19: North America Usage-based Insurance Market Volume (Units) Forecast, by Vehicle Type, 2017‒2031
Figure 20: North America Usage-based Insurance Market Value (US$ Bn) Forecast, by Vehicle Type, 2017‒2031
Figure 21: North America Usage-based Insurance Market, Incremental Opportunity, by Vehicle Type, Value (US$ Bn), 2022‒2031
Figure 22: North America Usage-based Insurance Market Volume (Units) Forecast, by Country, 2017‒2031
Figure 23: North America Usage-based Insurance Market Value (US$ Bn) Forecast, by Country, 2017‒2031
Figure 24: North America Usage-based Insurance Market, Incremental Opportunity, by Country, Value (US$ Bn), 2022‒2031
Figure 25: Europe Usage-based Insurance Market Volume (Units) Forecast, by Policy Type, 2017‒2031
Figure 26: Europe Usage-based Insurance Market Value (US$ Bn) Forecast, by Policy Type, 2017‒2031
Figure 27: Europe Usage-based Insurance Market, Incremental Opportunity, by Policy Type, Value (US$ Bn), 2022‒2031
Figure 28: Europe Usage-based Insurance Market Volume (Units) Forecast, by Device Type, 2017‒2031
Figure 29: Europe Usage-based Insurance Market Value (US$ Bn) Forecast, by Device Type, 2017‒2031
Figure 30: Europe Usage-based Insurance Market, Incremental Opportunity, by Device Type, Value (US$ Bn), 2022‒2031
Figure 31: Europe Usage-based Insurance Market Volume (Units) Forecast, by Vehicle Type, 2017‒2031
Figure 32: Europe Usage-based Insurance Market Value (US$ Bn) Forecast, by Vehicle Type, 2017‒2031
Figure 33: Europe Usage-based Insurance Market, Incremental Opportunity, by Vehicle Type, Value (US$ Bn), 2022‒2031
Figure 34: Europe Usage-based Insurance Market Volume (Units) Forecast, by Country, 2017‒2031
Figure 35: Europe Usage-based Insurance Market Value (US$ Bn) Forecast, by Country, 2017‒2031
Figure 36: Europe Usage-based Insurance Market, Incremental Opportunity, by Country, Value (US$ Bn), 2022‒2031
Figure 37: Asia Pacific Usage-based Insurance Market Volume (Units) Forecast, by Policy Type, 2017‒2031
Figure 38: Asia Pacific Usage-based Insurance Market Value (US$ Bn) Forecast, by Policy Type, 2017‒2031
Figure 39: Asia Pacific Usage-based Insurance Market, Incremental Opportunity, by Policy Type, Value (US$ Bn), 2022‒2031
Figure 40: Asia Pacific Usage-based Insurance Market Volume (Units) Forecast, by Device Type, 2017‒2031
Figure 41: Asia Pacific Usage-based Insurance Market Value (US$ Bn) Forecast, by Device Type, 2017‒2031
Figure 42: Asia Pacific Usage-based Insurance Market, Incremental Opportunity, by Device Type, Value (US$ Bn), 2022‒2031
Figure 43: Asia Pacific Usage-based Insurance Market Volume (Units) Forecast, by Vehicle Type, 2017‒2031
Figure 44: Asia Pacific Usage-based Insurance Market Value (US$ Bn) Forecast, by Vehicle Type, 2017‒2031
Figure 45: Asia Pacific Usage-based Insurance Market, Incremental Opportunity, by Vehicle Type, Value (US$ Bn), 2022‒2031
Figure 46: Asia Pacific Usage-based Insurance Market Volume (Units) Forecast, by Country, 2017‒2031
Figure 47: Asia Pacific Usage-based Insurance Market Value (US$ Bn) Forecast, by Country, 2017‒2031
Figure 48: Asia Pacific Usage-based Insurance Market, Incremental Opportunity, by Country, Value (US$ Bn), 2022‒2031
Figure 49: Middle East & Africa Usage-based Insurance Market Volume (Units) Forecast, by Policy Type, 2017‒2031
Figure 50: Middle East & Africa Usage-based Insurance Market Value (US$ Bn) Forecast, by Policy Type, 2017‒2031
Figure 51: Middle East & Africa Usage-based Insurance Market, Incremental Opportunity, by Policy Type, Value (US$ Bn), 2022‒2031
Figure 52: Middle East & Africa Usage-based Insurance Market Volume (Units) Forecast, by Device Type, 2017‒2031
Figure 53: Middle East & Africa Usage-based Insurance Market Value (US$ Bn) Forecast, by Device Type, 2017‒2031
Figure 54: Middle East & Africa Usage-based Insurance Market, Incremental Opportunity, by Device Type, Value (US$ Bn), 2022‒2031
Figure 55: Middle East & Africa Usage-based Insurance Market Volume (Units) Forecast, by Vehicle Type, 2017‒2031
Figure 56: Middle East & Africa Usage-based Insurance Market Value (US$ Bn) Forecast, by Vehicle Type, 2017‒2031
Figure 57: Middle East & Africa Usage-based Insurance Market, Incremental Opportunity, by Vehicle Type, Value (US$ Bn), 2022‒2031
Figure 58: Middle East & Africa Usage-based Insurance Market Volume (Units) Forecast, by Country, 2017‒2031
Figure 59: Middle East & Africa Usage-based Insurance Market Value (US$ Bn) Forecast, by Country, 2017‒2031
Figure 60: Middle East & Africa Usage-based Insurance Market, Incremental Opportunity, by Country, Value (US$ Bn), 2022‒2031
Figure 61: South America Usage-based Insurance Market Volume (Units) Forecast, by Policy Type, 2017‒2031
Figure 62: South America Usage-based Insurance Market Value (US$ Bn) Forecast, by Policy Type, 2017‒2031
Figure 63: South America Usage-based Insurance Market, Incremental Opportunity, by Policy Type, Value (US$ Bn), 2022‒2031
Figure 64: South America Usage-based Insurance Market Volume (Units) Forecast, by Device Type, 2017‒2031
Figure 65: South America Usage-based Insurance Market Value (US$ Bn) Forecast, by Device Type, 2017‒2031
Figure 66: South America Usage-based Insurance Market, Incremental Opportunity, by Device Type, Value (US$ Bn), 2022‒2031
Figure 67: South America Usage-based Insurance Market Volume (Units) Forecast, by Vehicle Type, 2017‒2031
Figure 68: South America Usage-based Insurance Market Value (US$ Bn) Forecast, by Vehicle Type, 2017‒2031
Figure 69: South America Usage-based Insurance Market, Incremental Opportunity, by Vehicle Type, Value (US$ Bn), 2022‒2031
Figure 70: South America Usage-based Insurance Market Volume (Units) Forecast, by Country, 2017‒2031
Figure 71: South America Usage-based Insurance Market Value (US$ Bn) Forecast, by Country, 2017‒2031
Figure 72: South America Usage-based Insurance Market, Incremental Opportunity, by Country, Value (US$ Bn), 2022‒2031
Copyright © Transparency Market Research, Inc. All Rights reserved
Trust Online


Usage based Insurance Market