
Analysts’ Viewpoint on Market Scenario
Rise in adoption of molybdenum trioxide nanoparticles in optical, electronic, catalytic, and energy systems is fueling market expansion. Molybdenum trioxide (MoO3) nanopowder is used in various applications due to its unique layered structure and high oxidation state. It possesses desirable electronic and optical properties.
R&D in usage of MoO3 nanopowders in various catalytic applications such as oil refineries, petroleum cracking, and photocatalysis is expected to augment the global market size during the forecast period. Molybdenum powder suppliers are investing significantly in expansion of their manufacturing capabilities in order to stay competitive in the market. They are also developing cost-effective manufacturing procedures for inorganic nanomaterials.
MoO3 nanopowder is a high-purity molybdenum oxide. Molybdenum trioxide properties such as better thermal stability and higher mechanical strength than its bulk counterpart make MoO3 an ideal material for usage in catalysis such as cracking catalysis, electrocatalysis, photocatalysis, and hydrogenation catalysis. Molybdenum trioxide structure is uniquely layered, with an edge- and vertex-sharing MoO3 octahedra, which forms a puckered-layered unit.
Molybdenum trioxide uses primarily involve catalysis and energy storage. It is employed for electrocatalysis in fuel cells and Li-ion batteries. It is also utilized in the photocatalytic evolution of hydrogen and photodegradation of organic pollutants, especially in the selective catalytic reduction of NOx with NH3. In ceramics, MoO3 is used as a colorant to produce various colors.
Molybdenum trioxide nanopowder offers immense potential in the development of high-energy capacitors. Graphene can be decorated with MoO3 nanoparticles for usage in high-energy lithium-ion capacitors with an organic electrolyte. It is used in the manufacture of supercapacitors for energy storage in the renewable sector. MoO3 nanorods are employed as electrodes in supercapacitor devices with as high as 82.4% capacitance retention even after 1,000 cycles.
Request a sample to get extensive insights into the Molybdenum Trioxide Nanopowder Market
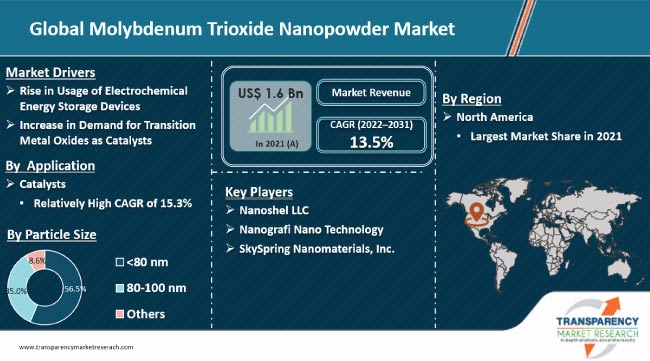
Increase in investment in the renewable sector is expected to help meet the surge in demand for global energy. Energy storage systems play a key role in storing renewable energy. They also aid in the effective integration of renewable resources in the grid. Electrochemical energy storage systems have the potential to make a significant contribution in achieving sustainable energy. They absorb, store, and release energy in the form of electricity. This has led to an increase in development of flexible, portable electronics and energy storage devices, mainly fuel cells and supercapacitors.
Energy storage systems can eliminate the difference between peaks and valleys in power demand between day and night. They also facilitate smooth power output, peak and frequency regulation, and reserve capacity. Hence, several companies in the energy sector are investing significantly in energy storage systems, thereby fueling market development.
Transition metal oxides are extensively employed in energy and environmental catalysis due to their relatively low cost, high activity, and stability. MoO3 is a transition metal oxide with n-type semiconducting, nontoxic nature, and high stability. Thus, MoO3 nanopowder is widely used in electrocatalysis, photocatalysis, and redox chemistry. It is also utilized as a hydrogenation catalyst and in catalytic cracking, electrocatalytic hydrogen evolution, photocatalytic hydrogen evolution, and ammonia borane dehydrogenation.
Catalysts play a key role in manufacture of various chemicals. They help reduce pollution, toxicity, and the time required in a reaction to produce chemicals. Thus, expansion in the catalyst industry is estimated to boost the molybdenum trioxide nanopowder market statistics during the forecast period.
Request a custom report on Molybdenum Trioxide Nanopowder Market
Based on particle size, the <80 nm segment accounted for 56.5% share of the global market in 2021. According to the latest molybdenum trioxide nanopowder market analysis, the segment is estimated to grow at a CAGR of 14.1% during the forecast period.
Particle size impacts the performance of nanomaterials in catalysis and reaction kinetics. Smaller particle size of the nanoparticle confers greater circulation, biodistribution, and clearance. This enables nanoparticles to possess unexpected optical, physical, and chemical properties. This indicates that nanoparticles are most effective in smaller particle sizes.
In terms of application, the catalysts segment held 34.7% share of the global market in 2021. According to the latest molybdenum trioxide nanopowder market forecast, the segment is estimated to grow at an above-average CAGR of 15.3% during 2022 to 2031. MoO3 nanopowder is used as a catalyst in various catalytic reactions. Increase in concerns regarding pollution is likely to propel the usage of MoO3 nanopowder to reduce the emission of NOx gases in the environment.
MoO3 is used as a catalyst for electrocatalytic hydrogen evolution. This results in the production of hydrogen. High calorific values and clean properties make hydrogen one of the most promising energy carriers. Photocatalytic hydrogen evolution reaction plays a vital role in producing hydrogen from water. It also convenient, as solar energy is easily accessible.
Based on end-use industry, the electronics segment constituted 38.9% share of the global market in 2021. The segment is estimated to grow at a CAGR of 13.5% during the forecast period. As catalyst, MoO3 nanopowder is widely employed in electrocatalysis and redox reactions. These reactions play an important role in manufacture of fuel cells and lithium-ion batteries. MoO3 nanopowder is also used in optoelectronics, supercapacitors, and gas sensors. Doped MoO3 is an electrocatalyst and effective composite electrode made of MoO3/carbon nanotubes for electrochemical supercapacitors.
North America dominated the global market for molybdenum trioxide nanopowder with 35.6% value share in 2021. The market in the region is expected to remain highly lucrative and grow at a CAGR of 14.2% during the forecast period.
Asia Pacific is estimated to record significant market progress in the next few years due to the expansion in electronics and automotive industries in the region.
The global molybdenum trioxide nanopowder business is fragmented, with a large number of small players operating across the world. The top few molybdenum trioxide manufacturers cumulatively accounted for approximately 35% to 40% share in 2021. Vendors in the business are focusing on technological innovation and capacity expansion to increase their global presence and maintain a competitive edge.
Nanoshel LLC, Nanografi Nano Technology, SkySpring Nanomaterials, Inc., Edgetech Industries LLC, Novarials Corporation, Nano Research Elements Inc., SAT Nano Technology Material Co., Ltd., Hunan Fushel Technology Ltd., Shanghai Theorem Chemical Technology Co., Ltd., US Research Nanomaterials, Inc., American Elements, and Merck KGaA are prominent market entities.
|
Attribute |
Detail |
|
Market Size Value in 2021 |
US$ 1.6 Bn |
|
Market Forecast Value in 2031 |
US$ 5.3 Bn |
|
Growth Rate (CAGR) |
13.5% |
|
Forecast Period |
2022–2031 |
|
Historical Data Available for |
2020 |
|
Quantitative Units |
US$ Bn For Value and Tons For Volume |
|
Market Analysis |
It includes cross segment analysis at Europe as well as country level. Furthermore, qualitative analysis includes drivers, restraints, opportunities, key trends, Porter’s Five Forces analysis, value chain analysis, and key trend analysis. |
|
Competition Landscape |
|
|
Format |
Electronic (PDF) + Excel |
|
Market Segmentation |
|
|
Regions Covered |
|
|
Countries Covered |
|
|
Companies Profiled |
|
|
Customization Scope |
Available upon request |
|
Pricing |
Available upon request |
The industry stood at US$ 1.6 Bn in 2021.
It is expected to advance at a CAGR of 13.5% from 2022 to 2031.
Rise in usage of electrochemical energy storage devices and increase in demand for transition metal oxides as catalysts.
The <80 nm particle size segment held the largest share of 56.5% in 2021.
North America was the most lucrative region of the global market with 35.6% share in 2021.
Nanoshel LLC, Nanografi Nano Technology, SkySpring Nanomaterials, Inc., Edgetech Industries LLC, Novarials Corporation, Nano Research Elements Inc., SAT Nano Technology Material Co., Ltd., Hunan Fushel Technology Ltd., Shanghai Theorem Chemical Technology Co., Ltd., US Research Nanomaterials, Inc., American Elements, and Merck KGaA.
1. Executive Summary
1.1. Molybdenum Trioxide Nanopowder Market Snapshot
1.2. Key Market Trends
1.3. Current Market and Future Potential
1.4. TMR’s Growth Opportunity Wheel
2. Market Overview
2.1. Market Segmentation
2.2. Market Indicators
2.3. Market Definitions
2.4. Market Dynamics
2.4.1. Drivers
2.4.2. Restraints
2.4.3. Opportunities
2.5. Porter’s Five Forces Analysis
2.6. Regulatory Landscape
2.7. Value Chain Analysis
2.7.1. List of Manufacturers
2.7.2. List of Potential Customers
2.8. Production Process/Route of Synthesis
2.9. Product Specification Analysis
3. COVID-19 Impact Analysis
3.1. Assessment of Impact of COVID-19
3.2. Impact of COVID-19 on Molybdenum Trioxide Nanopowder Market: Pre-crisis and Post-crisis
4. Impact of Current Geopolitical Scenario on the Market
5. Production Output Analysis, 2021
6. Price Trend Analysis and Forecast, 2020-2031
6.1. Price Trend Analysis and Forecast, by Particle Size
6.2. Price Trend Analysis and Forecast, by Region
7. Global Molybdenum Trioxide Nanopowder Market Analysis and Forecast, by Particle Size, 2020–2031
7.1. Introduction and Definitions
7.2. Global Molybdenum Trioxide Nanopowder Market Volume (Tons) and Value (US$ Mn) Forecast, by Particle Size, 2020–2031
7.2.1.1. <80 nm
7.2.1.2. 80-100 nm
7.2.1.3. Others
7.3. Global Molybdenum Trioxide Nanopowder Market Attractiveness, by Particle Size
8. Global Molybdenum Trioxide Nanopowder Market Analysis and Forecast, by Purity, 2020–2031
8.1. Introduction and Definitions
8.2. Global Molybdenum Trioxide Nanopowder Market Volume (Tons) and Value (US$ Mn) Forecast, by Purity,
8.2.1. >99.99%
8.2.2. ≥99.94%-99.99%
8.2.3. ≥99.5%-99.94%
8.2.4. Others
8.3. Global Molybdenum Trioxide Nanopowder Market Attractiveness, by Purity
9. Global Molybdenum Trioxide Nanopowder Market Analysis and Forecast, by Application, 2020–2031
9.1. Introduction and Definitions
9.2. Global Molybdenum Trioxide Nanopowder Market Volume (Tons) and Value (US$ Mn) Forecast, by Application
9.2.1. Catalysts
9.2.2. Electrochemical Capacitors
9.2.3. Nanofibers
9.2.4. Nanowires
9.2.5. Optoelectronic Components
9.2.6. Gas Sensors
9.2.7. Lithium-ion Batteries
9.2.8. Others
9.3. Global Molybdenum Trioxide Nanopowder Market Attractiveness, by Application
10. Global Molybdenum Trioxide Nanopowder Market Analysis and Forecast, by End-use Industry, 2020–2031
10.1. Introduction and Definitions
10.2. Global Molybdenum Trioxide Nanopowder Market Volume (Tons) and Value (US$ Mn) Forecast, by End-use Industry,
10.2.1. Electronics
10.2.2. Automotive and Transportation
10.2.3. Chemicals
10.2.4. Textiles
10.2.5. Ceramics
10.2.6. Glass
10.2.7. Others
10.3. Global Molybdenum Trioxide Nanopowder Market Attractiveness, by End-use Industry
11. Global Molybdenum Trioxide Nanopowder Market Analysis and Forecast, by Region, 2020–2031
11.1. Key Findings
11.2. Global Molybdenum Trioxide Nanopowder Market Volume (Tons) and Value (US$ Mn) Forecast, by Region, 2020–2031
11.2.1. North America
11.2.2. Europe
11.2.3. Asia Pacific
11.2.4. Latin America
11.2.5. Middle East & Africa
11.3. Global Molybdenum Trioxide Nanopowder Market Attractiveness, by Region
12. North America Molybdenum Trioxide Nanopowder Market Analysis and Forecast, 2020–2031
12.1. Key Findings
12.2. North America Molybdenum Trioxide Nanopowder Market Volume (Tons) and Value (US$ Mn) Forecast, by Particle Size, 2020–2031
12.3. North America Molybdenum Trioxide Nanopowder Market Volume (Tons) and Value (US$ Mn) Forecast, by Purity, 2020–2031
12.4. North America Molybdenum Trioxide Nanopowder Market Volume (Tons) and Value (US$ Mn) Forecast, by Application, 2020–2031
12.5. North America Molybdenum Trioxide Nanopowder Market Volume (Tons) and Value (US$ Mn) Forecast, by End-use Industry, 2020–2031
12.6. North America Molybdenum Trioxide Nanopowder Market Volume (Tons) and Value (US$ Mn) Forecast, by Country, 2020–2031
12.6.1. U.S. Molybdenum Trioxide Nanopowder Market Volume (Tons) and Value (US$ Mn) Forecast, by Particle Size, 2020–2031
12.6.2. U.S. Molybdenum Trioxide Nanopowder Market Volume (Tons) and Value (US$ Mn) Forecast, by Purity, 2020–2031
12.6.3. U.S. Molybdenum Trioxide Nanopowder Market Volume (Tons) and Value (US$ Mn) Forecast, by Application, 2020–2031
12.6.4. U.S. Molybdenum Trioxide Nanopowder Market Volume (Tons) and Value (US$ Mn) Forecast, by End-use Industry, 2020–2031
12.6.5. Canada Molybdenum Trioxide Nanopowder Market Volume (Tons) and Value (US$ Mn) Forecast, by Particle Size, 2020–2031
12.6.6. Canada Molybdenum Trioxide Nanopowder Market Volume (Tons) and Value (US$ Mn) Forecast, by Purity, 2020–2031
12.6.7. Canada Molybdenum Trioxide Nanopowder Market Volume (Tons) and Value (US$ Mn) Forecast, by Application, 2020–2031
12.6.8. Canada Molybdenum Trioxide Nanopowder Market Volume (Tons) and Value (US$ Mn) Forecast, by End-use Industry, 2020–2031
12.7. North America Molybdenum Trioxide Nanopowder Market Attractiveness Analysis
13. Europe Molybdenum Trioxide Nanopowder Market Analysis and Forecast, 2020–2031
13.1. Key Findings
13.2. Europe Molybdenum Trioxide Nanopowder Market Volume (Tons) and Value (US$ Mn) Forecast, by Particle Size, 2020–2031
13.3. Europe Molybdenum Trioxide Nanopowder Market Volume (Tons) and Value (US$ Mn) Forecast, by Purity, 2020–2031
13.4. Europe Molybdenum Trioxide Nanopowder Market Volume (Tons) and Value (US$ Mn) Forecast, by Application, 2020–2031
13.5. Europe Molybdenum Trioxide Nanopowder Market Volume (Tons) and Value (US$ Mn) Forecast, by End-use Industry, 2020–2031
13.6. Europe Molybdenum Trioxide Nanopowder Market Volume (Tons) and Value (US$ Mn) Forecast, by Country, 2020–2031
13.6.1. Italy Molybdenum Trioxide Nanopowder Market Volume (Tons) and Value (US$ Mn) Forecast, by Particle Size, 2020–2031
13.6.2. Italy Molybdenum Trioxide Nanopowder Market Volume (Tons) and Value (US$ Mn) Forecast, by Purity, 2020–2031
13.6.3. Italy Molybdenum Trioxide Nanopowder Market Volume (Tons) and Value (US$ Mn) Forecast, by Application, 2020–2031
13.6.4. Italy Molybdenum Trioxide Nanopowder Market Volume (Tons) and Value (US$ Mn) Forecast, by End-use Industry, 2020–2031
13.6.5. France Molybdenum Trioxide Nanopowder Market Volume (Tons) and Value (US$ Mn) Forecast, by Particle Size, 2020–2031
13.6.6. France Molybdenum Trioxide Nanopowder Market Volume (Tons) and Value (US$ Mn) Forecast, by Purity, 2020–2031
13.6.7. France Molybdenum Trioxide Nanopowder Market Volume (Tons) and Value (US$ Mn) Forecast, by Application, 2020–2031
13.6.8. France Molybdenum Trioxide Nanopowder Market Volume (Tons) and Value (US$ Mn) Forecast, by End-use Industry, 2020–2031
13.6.9. U.K. Molybdenum Trioxide Nanopowder Market Volume (Tons) and Value (US$ Mn) Forecast, by Particle Size, 2020–2031
13.6.10. U.K. Molybdenum Trioxide Nanopowder Market Volume (Tons) and Value (US$ Mn) Forecast, by Purity, 2020–2031
13.6.11. U.K. Molybdenum Trioxide Nanopowder Market Volume (Tons) and Value (US$ Mn) Forecast, by Application, 2020–2031
13.6.12. U.K. Molybdenum Trioxide Nanopowder Market Volume (Tons) and Value (US$ Mn) Forecast, by End-use Industry, 2020–2031Italy Molybdenum Trioxide Nanopowder Market Volume (Tons) and Value (US$ Mn) Forecast, by Particle Size, 2020–2031
13.6.13. Russia & CIS Molybdenum Trioxide Nanopowder Market Volume (Tons) and Value (US$ Mn) Forecast, by Particle Size, 2020–2031
13.6.14. Russia & CIS Molybdenum Trioxide Nanopowder Market Volume (Tons) and Value (US$ Mn) Forecast, by Purity, 2020–2031
13.6.15. Russia & CIS Molybdenum Trioxide Nanopowder Market Volume (Tons) and Value (US$ Mn) Forecast, by Application, 2020–2031
13.6.16. Russia & CIS Molybdenum Trioxide Nanopowder Market Volume (Tons) and Value (US$ Mn) Forecast, by End-use Industry, 2020–2031
13.6.17. Rest of Europe Molybdenum Trioxide Nanopowder Market Volume (Tons) and Value (US$ Mn) Forecast, by Particle Size, 2020–2031
13.6.18. Rest of Europe Molybdenum Trioxide Nanopowder Market Volume (Tons) and Value (US$ Mn) Forecast, by Purity, 2020–2031
13.6.19. Rest of Europe Molybdenum Trioxide Nanopowder Market Volume (Tons) and Value (US$ Mn) Forecast, by Application, 2020–2031
13.6.20. Rest of Europe Molybdenum Trioxide Nanopowder Market Volume (Tons) and Value (US$ Mn) Forecast, by End-use Industry, 2020–2031
13.7. Europe Molybdenum Trioxide Nanopowder Market Attractiveness Analysis
14. Asia Pacific Molybdenum Trioxide Nanopowder Market Analysis and Forecast, 2020–2031
14.1. Key Findings
14.2. Asia Pacific Molybdenum Trioxide Nanopowder Market Volume (Tons) and Value (US$ Mn) Forecast, by Particle Size, 2020–2031
14.3. Asia Pacific Molybdenum Trioxide Nanopowder Market Volume (Tons) and Value (US$ Mn) Forecast, by Purity, 2020–2031
14.4. Asia Pacific Molybdenum Trioxide Nanopowder Market Volume (Tons) and Value (US$ Mn) Forecast, by Application, 2020–2031
14.5. Asia Pacific Molybdenum Trioxide Nanopowder Market Volume (Tons) and Value (US$ Mn) Forecast, by End-use Industry, 2020–2031
14.6. Asia Pacific Molybdenum Trioxide Nanopowder Market Volume (Tons) and Value (US$ Mn) Forecast, by Country, 2020–2031
14.6.1. China Molybdenum Trioxide Nanopowder Market Volume (Tons) and Value (US$ Mn) Forecast, by Particle Size, 2020–2031
14.6.2. China Molybdenum Trioxide Nanopowder Market Volume (Tons) and Value (US$ Mn) Forecast, by Purity, 2020–2031
14.6.3. China Molybdenum Trioxide Nanopowder Market Volume (Tons) and Value (US$ Mn) Forecast, by Application, 2020–2031
14.6.4. China Molybdenum Trioxide Nanopowder Market Volume (Tons) and Value (US$ Mn) Forecast, by End-use Industry, 2020–2031
14.6.5. Japan Molybdenum Trioxide Nanopowder Market Volume (Tons) and Value (US$ Mn) Forecast, by Particle Size, 2020–2031
14.6.6. Japan Molybdenum Trioxide Nanopowder Market Volume (Tons) and Value (US$ Mn) Forecast, by Purity, 2020–2031
14.6.7. Japan Molybdenum Trioxide Nanopowder Market Volume (Tons) and Value (US$ Mn) Forecast, by Application, 2020–2031
14.6.8. Japan Molybdenum Trioxide Nanopowder Market Volume (Tons) and Value (US$ Mn) Forecast, by End-use Industry, 2020–2031
14.6.9. India Molybdenum Trioxide Nanopowder Market Volume (Tons) and Value (US$ Mn) Forecast, by Particle Size, 2020–2031
14.6.10. India Molybdenum Trioxide Nanopowder Market Volume (Tons) and Value (US$ Mn) Forecast, by Purity, 2020–2031
14.6.11. India Molybdenum Trioxide Nanopowder Market Volume (Tons) and Value (US$ Mn) Forecast, by Application, 2020–2031
14.6.12. India Molybdenum Trioxide Nanopowder Market Volume (Tons) and Value (US$ Mn) Forecast, by End-use Industry, 2020–2031
14.6.13. ASEAN Molybdenum Trioxide Nanopowder Market Volume (Tons) and Value (US$ Mn) Forecast, by Particle Size, 2020–2031
14.6.14. ASEAN Molybdenum Trioxide Nanopowder Market Volume (Tons) and Value (US$ Mn) Forecast, by Purity, 2020–2031
14.6.15. ASEAN Molybdenum Trioxide Nanopowder Market Volume (Tons) and Value (US$ Mn) Forecast, by Application, 2020–2031
14.6.16. ASEAN Molybdenum Trioxide Nanopowder Market Volume (Tons) and Value (US$ Mn) Forecast, by End-use Industry, 2020–2031
14.6.17. Rest of Asia Pacific Molybdenum Trioxide Nanopowder Market Volume (Tons) and Value (US$ Mn) Forecast, by Particle Size, 2020–2031
14.6.18. Rest of Asia Pacific Molybdenum Trioxide Nanopowder Market Volume (Tons) and Value (US$ Mn) Forecast, by Purity, 2020–2031
14.6.19. Rest of Asia Pacific Molybdenum Trioxide Nanopowder Market Volume (Tons) and Value (US$ Mn) Forecast, by Application, 2020–2031
14.6.20. Rest of Asia Pacific Molybdenum Trioxide Nanopowder Market Volume (Tons) and Value (US$ Mn) Forecast, by End-use Industry, 2020–2031
14.7. Asia Pacific Molybdenum Trioxide Nanopowder Market Attractiveness Analysis
15. Latin America Molybdenum Trioxide Nanopowder Market Analysis and Forecast, 2020–2031
15.1. Key Findings
15.2. Latin America Molybdenum Trioxide Nanopowder Market Volume (Tons) and Value (US$ Mn) Forecast, by Particle Size, 2020–2031
15.3. Latin America Molybdenum Trioxide Nanopowder Market Volume (Tons) and Value (US$ Mn) Forecast, by Purity, 2020–2031
15.4. Latin America Molybdenum Trioxide Nanopowder Market Volume (Tons) and Value (US$ Mn) Forecast, by Application, 2020–2031
15.5. Latin America Molybdenum Trioxide Nanopowder Market Volume (Tons) and Value (US$ Mn) Forecast, by End-use Industry, 2020–2031
15.6. Latin America Molybdenum Trioxide Nanopowder Market Volume (Tons) and Value (US$ Mn) Forecast, by Country, 2020–2031
15.6.1. Brazil Molybdenum Trioxide Nanopowder Market Volume (Tons) and Value (US$ Mn) Forecast, by Particle Size, 2020–2031
15.6.2. Brazil Molybdenum Trioxide Nanopowder Market Volume (Tons) and Value (US$ Mn) Forecast, by Purity, 2020–2031
15.6.3. Brazil Molybdenum Trioxide Nanopowder Market Volume (Tons) and Value (US$ Mn) Forecast, by Application, 2020–2031
15.6.4. Brazil Molybdenum Trioxide Nanopowder Market Volume (Tons) and Value (US$ Mn) Forecast, by End-use Industry, 2020–2031
15.6.5. Mexico Molybdenum Trioxide Nanopowder Market Volume (Tons) and Value (US$ Mn) Forecast, by Particle Size, 2020–2031
15.6.6. Mexico Molybdenum Trioxide Nanopowder Market Volume (Tons) and Value (US$ Mn) Forecast, by Purity, 2020–2031
15.6.7. Mexico Molybdenum Trioxide Nanopowder Market Volume (Tons) and Value (US$ Mn) Forecast, by Application, 2020–2031
15.6.8. Mexico Molybdenum Trioxide Nanopowder Market Volume (Tons) and Value (US$ Mn) Forecast, by End-use Industry, 2020–2031
15.6.9. Rest of Latin America Molybdenum Trioxide Nanopowder Market Volume (Tons) and Value (US$ Mn) Forecast, by Particle Size, 2020–2031
15.6.10. Rest of Latin America Molybdenum Trioxide Nanopowder Market Volume (Tons) and Value (US$ Mn) Forecast, by Purity, 2020–2031
15.6.11. Rest of Latin America Molybdenum Trioxide Nanopowder Market Volume (Tons) and Value (US$ Mn) Forecast, by Application, 2020–2031
15.6.12. Rest of Latin America Molybdenum Trioxide Nanopowder Market Volume (Tons) and Value (US$ Mn) Forecast, by End-use Industry, 2020–2031
15.7. Latin America Molybdenum Trioxide Nanopowder Market Attractiveness Analysis
16. Middle East & Africa Molybdenum Trioxide Nanopowder Market Analysis and Forecast, 2020–2031
16.1. Key Findings
16.2. Middle East & Africa Molybdenum Trioxide Nanopowder Market Volume (Tons) and Value (US$ Mn) Forecast, by Particle Size, 2020–2031
16.3. Middle East & Africa Molybdenum Trioxide Nanopowder Market Volume (Tons) and Value (US$ Mn) Forecast, by Purity, 2020–2031
16.4. Middle East & Africa Molybdenum Trioxide Nanopowder Market Volume (Tons) and Value (US$ Mn) Forecast, by Application, 2020–2031
16.5. Middle East & Africa Molybdenum Trioxide Nanopowder Market Volume (Tons) and Value (US$ Mn) Forecast, by End-use Industry, 2020–2031
16.6. Middle East & Africa Molybdenum Trioxide Nanopowder Market Volume (Tons) and Value (US$ Mn) Forecast, by Country, 2020–2031
16.6.1. GCC Molybdenum Trioxide Nanopowder Market Volume (Tons) and Value (US$ Mn) Forecast, by Particle Size, 2020–2031
16.6.2. GCC Molybdenum Trioxide Nanopowder Market Volume (Tons) and Value (US$ Mn) Forecast, by Purity, 2020–2031
16.6.3. GCC Molybdenum Trioxide Nanopowder Market Volume (Tons) and Value (US$ Mn) Forecast, by Application, 2020–2031
16.6.4. GCC Molybdenum Trioxide Nanopowder Market Volume (Tons) and Value (US$ Mn) Forecast, by End-use Industry, 2020–2031
16.6.5. South Africa Molybdenum Trioxide Nanopowder Market Volume (Tons) and Value (US$ Mn) Forecast, by Particle Size, 2020–2031
16.6.6. South Africa Molybdenum Trioxide Nanopowder Market Volume (Tons) and Value (US$ Mn) Forecast, by Purity, 2020–2031
16.6.7. South Africa Molybdenum Trioxide Nanopowder Market Volume (Tons) and Value (US$ Mn) Forecast, by Application, 2020–2031
16.6.8. South Africa Molybdenum Trioxide Nanopowder Market Volume (Tons) and Value (US$ Mn) Forecast, by End-use Industry, 2020–2031
16.6.9. Rest of Middle East & Africa Molybdenum Trioxide Nanopowder Market Volume (Tons) and Value (US$ Mn) Forecast, by Particle Size, 2020–2031
16.6.10. Rest of Middle East & Africa Molybdenum Trioxide Nanopowder Market Volume (Tons) and Value (US$ Mn) Forecast, by Purity, 2020–2031
16.6.11. Rest of Middle East & Africa Molybdenum Trioxide Nanopowder Market Volume (Tons) and Value (US$ Mn) Forecast, by Application, 2020–2031
16.6.12. Rest of Middle East & Africa Molybdenum Trioxide Nanopowder Market Volume (Tons) and Value (US$ Mn) Forecast, by End-use Industry, 2020–2031
16.7. Middle East & Africa Molybdenum Trioxide Nanopowder Market Attractiveness Analysis
17. Global Molybdenum Trioxide Nanopowder Market Share Analysis, 2021
17.1. Competition Matrix
17.2. Market Footprint Analysis
17.2.1. By Particle Size
17.2.2. By End-use Industry
17.3. Company Profiles (Details – Overview, Financials, Recent Developments, and Strategy)
17.3.1. Nanoshel LLC
17.3.1.1. Company Description
17.3.1.2. Business Overview
17.3.1.3. Financial Details
17.3.1.4. Strategic Overview
17.3.2. Nanografi Nano Technology
17.3.2.1. Company Description
17.3.2.2. Business Overview
17.3.2.3. Financial Details
17.3.2.4. Strategic Overview
17.3.3. SkySpring Nanomaterials, Inc.
17.3.3.1. Company Description
17.3.3.2. Business Overview
17.3.3.3. Financial Details
17.3.3.4. Strategic Overview
17.3.4. Edgetech Industries LLC
17.3.4.1. Company Description
17.3.4.2. Business Overview
17.3.4.3. Financial Details
17.3.4.4. Strategic Overview
17.3.5. Novarials Corporation
17.3.5.1. Company Description
17.3.5.2. Business Overview
17.3.5.3. Financial Details
17.3.5.4. Strategic Overview
17.3.6. Nano Research Elements Inc.
17.3.6.1. Company Description
17.3.6.2. Business Overview
17.3.6.3. Financial Details
17.3.6.4. Strategic Overview
17.3.7. SAT Nano Technology Material Co., Ltd.
17.3.7.1. Company Description
17.3.7.2. Business Overview
17.3.7.3. Financial Details
17.3.7.4. Strategic Overview
17.3.8. Hunan Fushel Technology Ltd.
17.3.8.1. Company Description
17.3.8.2. Business Overview
17.3.8.3. Financial Details
17.3.8.4. Strategic Overview
17.3.9. Shanghai Theorem Chemical Technology Co., Ltd.
17.3.9.1. Company Description
17.3.9.2. Business Overview
17.3.9.3. Financial Details
17.3.9.4. Strategic Overview
17.3.10. US Research Nanomaterials, Inc.
17.3.10.1. Company Description
17.3.10.2. Business Overview
17.3.10.3. Financial Details
17.3.10.4. Strategic Overview
17.3.11. American Elements
17.3.11.1. Company Description
17.3.11.2. Business Overview
17.3.11.3. Financial Details
17.3.11.4. Strategic Overview
17.3.12. Merck KGaA
17.3.12.1. Company Description
17.3.12.2. Business Overview
17.3.12.3. Financial Details
17.3.12.4. Strategic Overview
18. Primary Research: Key Insights
19. Appendix
List of Tables
Table 1: Global Molybdenum Trioxide Nanopowder Market Volume (Tons) Forecast, by Particle Size, 2022–2031
Table 2: Global Molybdenum Trioxide Nanopowder Market Value (US$ Mn) Forecast, by Particle Size, 2022–2031
Table 3: Global Molybdenum Trioxide Nanopowder Market Volume (Tons) Forecast, by Purity, 2022–2031
Table 4: Global Molybdenum Trioxide Nanopowder Market Value (US$ Mn) Forecast, by Purity, 2022–2031
Table 5: Global Molybdenum Trioxide Nanopowder Market Volume (Tons) Forecast, by Application, 2022–2031
Table 6: Global Molybdenum Trioxide Nanopowder Market Value (US$ Mn) Forecast, by Application, 2022–2031
Table 7: Global Molybdenum Trioxide Nanopowder Market Volume (Tons) Forecast, by End-use Industry, 2022–2031
Table 8: Global Molybdenum Trioxide Nanopowder Market Value (US$ Mn) Forecast, by End-use Industry, 2022–2031
Table 9: Global Molybdenum Trioxide Nanopowder Market Volume (Tons) Forecast, by Region, 2022–2031
Table 10: Global Molybdenum Trioxide Nanopowder Market Value (US$ Mn) Forecast, by Region, 2022–2031
Table 11: North America Molybdenum Trioxide Nanopowder Market Volume (Tons) Forecast, by Particle Size, 2022–2031
Table 12: North America Molybdenum Trioxide Nanopowder Market Value (US$ Mn) Forecast, by Particle Size, 2022–2031
Table 13: North America Molybdenum Trioxide Nanopowder Market Volume (Tons) Forecast, by Purity, 2022–2031
Table 14: North America Molybdenum Trioxide Nanopowder Market Value (US$ Mn) Forecast, by Purity, 2022–2031
Table 15: North America Molybdenum Trioxide Nanopowder Market Volume (Tons) Forecast, by Application, 2022–2031
Table 16: North America Molybdenum Trioxide Nanopowder Market Value (US$ Mn) Forecast, by Application, 2022–2031
Table 17: North America Molybdenum Trioxide Nanopowder Market Volume (Tons) Forecast, by End-use Industry, 2022–2031
Table 18: North America Molybdenum Trioxide Nanopowder Market Value (US$ Mn) Forecast, by End-use Industry, 2022–2031
Table 19: North America Molybdenum Trioxide Nanopowder Market Volume (Tons) Forecast, by Country, 2022–2031
Table 20: North America Molybdenum Trioxide Nanopowder Market Value (US$ Mn) Forecast, by Country, 2022–2031
Table 21: U.S. Molybdenum Trioxide Nanopowder Market Volume (Tons) Forecast, by Particle Size, 2022–2031
Table 22: U.S. Molybdenum Trioxide Nanopowder Market Value (US$ Mn) Forecast, by Particle Size, 2022–2031
Table 23: U.S. Molybdenum Trioxide Nanopowder Market Volume (Tons) Forecast, by Purity, 2022–2031
Table 24: U.S. Molybdenum Trioxide Nanopowder Market Value (US$ Mn) Forecast, by Purity, 2022–2031
Table 25: U.S. Molybdenum Trioxide Nanopowder Market Volume (Tons) Forecast, by Application, 2022–2031
Table 26: U.S. Molybdenum Trioxide Nanopowder Market Value (US$ Mn) Forecast, by Application, 2022–2031
Table 27: U.S. Molybdenum Trioxide Nanopowder Market Volume (Tons) Forecast, by End-use Industry, 2022–2031
Table 28: U.S. Molybdenum Trioxide Nanopowder Market Value (US$ Mn) Forecast, by End-use Industry, 2022–2031
Table 29: Canada Molybdenum Trioxide Nanopowder Market Volume (Tons) Forecast, by Particle Size, 2022–2031
Table 30: Canada Molybdenum Trioxide Nanopowder Market Value (US$ Mn) Forecast, by Particle Size, 2022–2031
Table 31: Canada Molybdenum Trioxide Nanopowder Market Volume (Tons) Forecast, by Purity, 2022–2031
Table 32: Canada Molybdenum Trioxide Nanopowder Market Value (US$ Mn) Forecast, by Purity, 2022–2031
Table 33: Canada Molybdenum Trioxide Nanopowder Market Volume (Tons) Forecast, by Application, 2022–2031
Table 34: Canada Molybdenum Trioxide Nanopowder Market Value (US$ Mn) Forecast, by Application, 2022–2031
Table 35: Canada Molybdenum Trioxide Nanopowder Market Volume (Tons) Forecast, by End-use Industry, 2022–2031
Table 36: Canada Molybdenum Trioxide Nanopowder Market Value (US$ Mn) Forecast, by End-use Industry 2022–2031
Table 37: Europe Molybdenum Trioxide Nanopowder Market Volume (Tons) Forecast, by Particle Size, 2022–2031
Table 38: Europe Molybdenum Trioxide Nanopowder Market Value (US$ Mn) Forecast, by Particle Size, 2022–2031
Table 39: Europe Molybdenum Trioxide Nanopowder Market Volume (Tons) Forecast, by Purity, 2022–2031
Table 40: Europe Molybdenum Trioxide Nanopowder Market Value (US$ Mn) Forecast, by Purity, 2022–2031
Table 41: Europe Molybdenum Trioxide Nanopowder Market Volume (Tons) Forecast, by Application, 2022–2031
Table 42: Europe Molybdenum Trioxide Nanopowder Market Value (US$ Mn) Forecast, by Application, 2022–2031
Table 43: Europe Molybdenum Trioxide Nanopowder Market Volume (Tons) Forecast, by End-use Industry, 2022–2031
Table 44: Europe Molybdenum Trioxide Nanopowder Market Value (US$ Mn) Forecast, by End-use Industry 2022–2031
Table 45: Europe Molybdenum Trioxide Nanopowder Market Volume (Tons) Forecast, by Country and Sub-region, 2022–2031
Table 46: Europe Molybdenum Trioxide Nanopowder Market Value (US$ Mn) Forecast, by Country and Sub-region, 2022–2031
Table 47: Germany Molybdenum Trioxide Nanopowder Market Volume (Tons) Forecast, by Particle Size, 2022–2031
Table 48: Germany Molybdenum Trioxide Nanopowder Market Value (US$ Mn) Forecast, by Particle Size, 2022–2031
Table 49: Germany Molybdenum Trioxide Nanopowder Market Volume (Tons) Forecast, by Purity, 2022–2031
Table 50: Germany Molybdenum Trioxide Nanopowder Market Value (US$ Mn) Forecast, by Purity, 2022–2031
Table 51: Germany Molybdenum Trioxide Nanopowder Market Volume (Tons) Forecast, by Application, 2022–2031
Table 52: Germany Molybdenum Trioxide Nanopowder Market Value (US$ Mn) Forecast, by Application, 2022–2031
Table 53: Germany Molybdenum Trioxide Nanopowder Market Volume (Tons) Forecast, by End-use Industry, 2022–2031
Table 54: Germany Molybdenum Trioxide Nanopowder Market Value (US$ Mn) Forecast, by End-use Industry 2022–2031
Table 55: France Molybdenum Trioxide Nanopowder Market Volume (Tons) Forecast, by Particle Size, 2022–2031
Table 56: France Molybdenum Trioxide Nanopowder Market Value (US$ Mn) Forecast, by Particle Size, 2022–2031
Table 57: France Molybdenum Trioxide Nanopowder Market Volume (Tons) Forecast, by Purity, 2022–2031
Table 58: France Molybdenum Trioxide Nanopowder Market Value (US$ Mn) Forecast, by Purity, 2022–2031
Table 59: France Molybdenum Trioxide Nanopowder Market Volume (Tons) Forecast, by Application, 2022–2031
Table 60: France Molybdenum Trioxide Nanopowder Market Value (US$ Mn) Forecast, by Application, 2022–2031
Table 61: France Molybdenum Trioxide Nanopowder Market Volume (Tons) Forecast, by End-use Industry, 2022–2031
Table 62: France Molybdenum Trioxide Nanopowder Market Value (US$ Mn) Forecast, by End-use Industry 2022–2031
Table 63: U.K. Molybdenum Trioxide Nanopowder Market Volume (Tons) Forecast, by Particle Size, 2022–2031
Table 64: U.K. Molybdenum Trioxide Nanopowder Market Value (US$ Mn) Forecast, by Particle Size, 2022–2031
Table 65: U.K. Molybdenum Trioxide Nanopowder Market Volume (Tons) Forecast, by Purity, 2022–2031
Table 66: U.K. Molybdenum Trioxide Nanopowder Market Value (US$ Mn) Forecast, by Purity, 2022–2031
Table 67: U.K. Molybdenum Trioxide Nanopowder Market Volume (Tons) Forecast, by Application, 2022–2031
Table 68: U.K. Molybdenum Trioxide Nanopowder Market Value (US$ Mn) Forecast, by Application, 2022–2031
Table 69: U.K. Molybdenum Trioxide Nanopowder Market Volume (Tons) Forecast, by End-use Industry, 2022–2031
Table 70: U.K. Molybdenum Trioxide Nanopowder Market Value (US$ Mn) Forecast, by End-use Industry 2022–2031
Table 71: Italy Molybdenum Trioxide Nanopowder Market Volume (Tons) Forecast, by Particle Size, 2022–2031
Table 72: Italy Molybdenum Trioxide Nanopowder Market Value (US$ Mn) Forecast, by Particle Size, 2022–2031
Table 73: Italy Molybdenum Trioxide Nanopowder Market Volume (Tons) Forecast, by Purity, 2022–2031
Table 74: Italy Molybdenum Trioxide Nanopowder Market Value (US$ Mn) Forecast, by Purity, 2022–2031
Table 75: Italy Molybdenum Trioxide Nanopowder Market Volume (Tons) Forecast, by Application, 2022–2031
Table 76: Italy Molybdenum Trioxide Nanopowder Market Value (US$ Mn) Forecast, by Application, 2022–2031
Table 77: Italy Molybdenum Trioxide Nanopowder Market Volume (Tons) Forecast, by End-use Industry, 2022–2031
Table 78: Italy Molybdenum Trioxide Nanopowder Market Value (US$ Mn) Forecast, by End-use Industry 2022–2031
Table 79: Spain Molybdenum Trioxide Nanopowder Market Volume (Tons) Forecast, by Particle Size, 2022–2031
Table 80: Spain Molybdenum Trioxide Nanopowder Market Value (US$ Mn) Forecast, by Particle Size, 2022–2031
Table 81: Spain Molybdenum Trioxide Nanopowder Market Volume (Tons) Forecast, by Purity, 2022–2031
Table 82: Spain Molybdenum Trioxide Nanopowder Market Value (US$ Mn) Forecast, by Purity, 2022–2031
Table 83: Spain Molybdenum Trioxide Nanopowder Market Volume (Tons) Forecast, by Application, 2022–2031
Table 84: Spain Molybdenum Trioxide Nanopowder Market Value (US$ Mn) Forecast, by Application, 2022–2031
Table 85: Spain Molybdenum Trioxide Nanopowder Market Volume (Tons) Forecast, by End-use Industry, 2022–2031
Table 86: Spain Molybdenum Trioxide Nanopowder Market Value (US$ Mn) Forecast, by End-use Industry 2022–2031
Table 87: Russia & CIS Molybdenum Trioxide Nanopowder Market Volume (Tons) Forecast, by Particle Size, 2022–2031
Table 88: Russia & CIS Molybdenum Trioxide Nanopowder Market Value (US$ Mn) Forecast, by Particle Size, 2022–2031
Table 89: Russia & CIS Molybdenum Trioxide Nanopowder Market Volume (Tons) Forecast, by Purity, 2022–2031
Table 90: Russia & CIS Molybdenum Trioxide Nanopowder Market Value (US$ Mn) Forecast, by Purity, 2022–2031
Table 91: Russia & CIS Molybdenum Trioxide Nanopowder Market Volume (Tons) Forecast, by Application, 2022–2031
Table 92: Russia & CIS Molybdenum Trioxide Nanopowder Market Value (US$ Mn) Forecast, by Application, 2022–2031
Table 93: Russia & CIS Molybdenum Trioxide Nanopowder Market Volume (Tons) Forecast, by End-use Industry, 2022–2031
Table 94: Russia & CIS Molybdenum Trioxide Nanopowder Market Value (US$ Mn) Forecast, by End-use Industry 2022–2031
Table 95: Rest of Europe Molybdenum Trioxide Nanopowder Market Volume (Tons) Forecast, by Particle Size, 2022–2031
Table 96: Rest of Europe Molybdenum Trioxide Nanopowder Market Value (US$ Mn) Forecast, by Particle Size, 2022–2031
Table 97: Rest of Europe Molybdenum Trioxide Nanopowder Market Volume (Tons) Forecast, by Purity, 2022–2031
Table 98: Rest of Europe Molybdenum Trioxide Nanopowder Market Value (US$ Mn) Forecast, by Purity, 2022–2031
Table 99: Rest of Europe Molybdenum Trioxide Nanopowder Market Volume (Tons) Forecast, by Application, 2022–2031
Table 100: Rest of Europe Molybdenum Trioxide Nanopowder Market Value (US$ Mn) Forecast, by Application, 2022–2031
Table 101: Rest of Europe Molybdenum Trioxide Nanopowder Market Volume (Tons) Forecast, by End-use Industry, 2022–2031
Table 102: Rest of Europe Molybdenum Trioxide Nanopowder Market Value (US$ Mn) Forecast, by End-use Industry 2022–2031
Table 103: Asia Pacific Molybdenum Trioxide Nanopowder Market Volume (Tons) Forecast, by Particle Size, 2022–2031
Table 104: Asia Pacific Molybdenum Trioxide Nanopowder Market Value (US$ Mn) Forecast, by Particle Size, 2022–2031
Table 105: Asia Pacific Molybdenum Trioxide Nanopowder Market Volume (Tons) Forecast, by Purity, 2022–2031
Table 106: Asia Pacific Molybdenum Trioxide Nanopowder Market Value (US$ Mn) Forecast, by Purity, 2022–2031
Table 107: Asia Pacific Molybdenum Trioxide Nanopowder Market Volume (Tons) Forecast, by Application, 2022–2031
Table 108: Asia Pacific Molybdenum Trioxide Nanopowder Market Value (US$ Mn) Forecast, by Application, 2022–2031
Table 109: Asia Pacific Molybdenum Trioxide Nanopowder Market Volume (Tons) Forecast, by End-use Industry, 2022–2031
Table 110: Asia Pacific Molybdenum Trioxide Nanopowder Market Value (US$ Mn) Forecast, by End-use Industry 2022–2031
Table 111: Asia Pacific Molybdenum Trioxide Nanopowder Market Volume (Tons) Forecast, by Country and Sub-region, 2022–2031
Table 112: Asia Pacific Molybdenum Trioxide Nanopowder Market Value (US$ Mn) Forecast, by Country and Sub-region, 2022–2031
Table 113: China Molybdenum Trioxide Nanopowder Market Volume (Tons) Forecast, by Particle Size, 2022–2031
Table 114: China Molybdenum Trioxide Nanopowder Market Value (US$ Mn) Forecast, by Particle Size 2022–2031
Table 115: China Molybdenum Trioxide Nanopowder Market Volume (Tons) Forecast, by Purity, 2022–2031
Table 116: China Molybdenum Trioxide Nanopowder Market Value (US$ Mn) Forecast, by Purity, 2022–2031
Table 117: China Molybdenum Trioxide Nanopowder Market Volume (Tons) Forecast, by Application, 2022–2031
Table 118: China Molybdenum Trioxide Nanopowder Market Value (US$ Mn) Forecast, by Application, 2022–2031
Table 119: China Molybdenum Trioxide Nanopowder Market Volume (Tons) Forecast, by End-use Industry, 2022–2031
Table 120: China Molybdenum Trioxide Nanopowder Market Value (US$ Mn) Forecast, by End-use Industry 2022–2031
Table 121: Japan Molybdenum Trioxide Nanopowder Market Volume (Tons) Forecast, by Particle Size, 2022–2031
Table 122: Japan Molybdenum Trioxide Nanopowder Market Value (US$ Mn) Forecast, by Particle Size, 2022–2031
Table 123: Japan Molybdenum Trioxide Nanopowder Market Volume (Tons) Forecast, by Purity, 2022–2031
Table 124: Japan Molybdenum Trioxide Nanopowder Market Value (US$ Mn) Forecast, by Purity, 2022–2031
Table 125: Japan Molybdenum Trioxide Nanopowder Market Volume (Tons) Forecast, by Application, 2022–2031
Table 126: Japan Molybdenum Trioxide Nanopowder Market Value (US$ Mn) Forecast, by Application, 2022–2031
Table 127: Japan Molybdenum Trioxide Nanopowder Market Volume (Tons) Forecast, by End-use Industry, 2022–2031
Table 128: Japan Molybdenum Trioxide Nanopowder Market Value (US$ Mn) Forecast, by End-use Industry 2022–2031
Table 129: India Molybdenum Trioxide Nanopowder Market Volume (Tons) Forecast, by Particle Size, 2022–2031
Table 130: India Molybdenum Trioxide Nanopowder Market Value (US$ Mn) Forecast, by Particle Size, 2022–2031
Table 131: India Molybdenum Trioxide Nanopowder Market Volume (Tons) Forecast, by Purity, 2022–2031
Table 132: India Molybdenum Trioxide Nanopowder Market Value (US$ Mn) Forecast, by Purity, 2022–2031
Table 133: India Molybdenum Trioxide Nanopowder Market Volume (Tons) Forecast, by Application, 2022–2031
Table 134: India Molybdenum Trioxide Nanopowder Market Value (US$ Mn) Forecast, by Application, 2022–2031
Table 135: India Molybdenum Trioxide Nanopowder Market Volume (Tons) Forecast, by End-use Industry, 2022–2031
Table 136: India Molybdenum Trioxide Nanopowder Market Value (US$ Mn) Forecast, by End-use Industry 2022–2031
Table 137: ASEAN Molybdenum Trioxide Nanopowder Market Volume (Tons) Forecast, by Particle Size, 2022–2031
Table 138: ASEAN Molybdenum Trioxide Nanopowder Market Value (US$ Mn) Forecast, by Particle Size, 2022–2031
Table 139: ASEAN Molybdenum Trioxide Nanopowder Market Volume (Tons) Forecast, by Purity, 2022–2031
Table 140: ASEAN Molybdenum Trioxide Nanopowder Market Value (US$ Mn) Forecast, by Purity, 2022–2031
Table 141: ASEAN Molybdenum Trioxide Nanopowder Market Volume (Tons) Forecast, by Application, 2022–2031
Table 142: ASEAN Molybdenum Trioxide Nanopowder Market Value (US$ Mn) Forecast, by Application, 2022–2031
Table 143: ASEAN Molybdenum Trioxide Nanopowder Market Volume (Tons) Forecast, by End-use Industry, 2022–2031
Table 144: ASEAN Molybdenum Trioxide Nanopowder Market Value (US$ Mn) Forecast, by End-use Industry 2022–2031
Table 145: Rest of Asia Pacific Molybdenum Trioxide Nanopowder Market Volume (Tons) Forecast, by Particle Size, 2022–2031
Table 146: Rest of Asia Pacific Molybdenum Trioxide Nanopowder Market Value (US$ Mn) Forecast, by Particle Size, 2022–2031
Table 147: Rest of Asia Pacific Molybdenum Trioxide Nanopowder Market Volume (Tons) Forecast, by Purity, 2022–2031
Table 148: Rest of Asia Pacific Molybdenum Trioxide Nanopowder Market Value (US$ Mn) Forecast, by Purity, 2022–2031
Table 149: Rest of Asia Pacific Molybdenum Trioxide Nanopowder Market Volume (Tons) Forecast, by Application, 2022–2031
Table 150: Rest of Asia Pacific Molybdenum Trioxide Nanopowder Market Value (US$ Mn) Forecast, by Application, 2022–2031
Table 151: Rest of Asia Pacific Molybdenum Trioxide Nanopowder Market Volume (Tons) Forecast, by End-use Industry, 2022–2031
Table 152: Rest of Asia Pacific Molybdenum Trioxide Nanopowder Market Value (US$ Mn) Forecast, by End-use Industry 2022–2031
Table 153: Latin America Molybdenum Trioxide Nanopowder Market Volume (Tons) Forecast, by Particle Size, 2022–2031
Table 154: Latin America Molybdenum Trioxide Nanopowder Market Value (US$ Mn) Forecast, by Particle Size, 2022–2031
Table 155: Latin America Molybdenum Trioxide Nanopowder Market Volume (Tons) Forecast, by Purity, 2022–2031
Table 156: Latin America Molybdenum Trioxide Nanopowder Market Value (US$ Mn) Forecast, by Purity, 2022–2031
Table 157: Latin America Molybdenum Trioxide Nanopowder Market Volume (Tons) Forecast, by Application, 2022–2031
Table 158: Latin America Molybdenum Trioxide Nanopowder Market Value (US$ Mn) Forecast, by Application, 2022–2031
Table 159: Latin America Molybdenum Trioxide Nanopowder Market Volume (Tons) Forecast, by End-use Industry, 2022–2031
Table 160: Latin America Molybdenum Trioxide Nanopowder Market Value (US$ Mn) Forecast, by End-use Industry 2022–2031
Table 161: Latin America Molybdenum Trioxide Nanopowder Market Volume (Tons) Forecast, by Country and Sub-region, 2022–2031
Table 162: Latin America Molybdenum Trioxide Nanopowder Market Value (US$ Mn) Forecast, by Country and Sub-region, 2022–2031
Table 163: Brazil Molybdenum Trioxide Nanopowder Market Volume (Tons) Forecast, by Particle Size, 2022–2031
Table 164: Brazil Molybdenum Trioxide Nanopowder Market Value (US$ Mn) Forecast, by Particle Size, 2022–2031
Table 165: Brazil Molybdenum Trioxide Nanopowder Market Volume (Tons) Forecast, by Purity, 2022–2031
Table 166: Brazil Molybdenum Trioxide Nanopowder Market Value (US$ Mn) Forecast, by Purity, 2022–2031
Table 167: Brazil Molybdenum Trioxide Nanopowder Market Volume (Tons) Forecast, by Application, 2022–2031
Table 168: Brazil Molybdenum Trioxide Nanopowder Market Value (US$ Mn) Forecast, by Application, 2022–2031
Table 169: Brazil Molybdenum Trioxide Nanopowder Market Volume (Tons) Forecast, by End-use Industry, 2022–2031
Table 170: Brazil Molybdenum Trioxide Nanopowder Market Value (US$ Mn) Forecast, by End-use Industry 2022–2031
Table 171: Mexico Molybdenum Trioxide Nanopowder Market Volume (Tons) Forecast, by Particle Size, 2022–2031
Table 172: Mexico Molybdenum Trioxide Nanopowder Market Value (US$ Mn) Forecast, by Particle Size, 2022–2031
Table 173: Mexico Molybdenum Trioxide Nanopowder Market Volume (Tons) Forecast, by Purity, 2022–2031
Table 174: Mexico Molybdenum Trioxide Nanopowder Market Value (US$ Mn) Forecast, by Purity, 2022–2031
Table 175: Mexico Molybdenum Trioxide Nanopowder Market Volume (Tons) Forecast, by Application, 2022–2031
Table 176: Mexico Molybdenum Trioxide Nanopowder Market Value (US$ Mn) Forecast, by Application, 2022–2031
Table 177: Mexico Molybdenum Trioxide Nanopowder Market Volume (Tons) Forecast, by End-use Industry, 2022–2031
Table 178: Mexico Molybdenum Trioxide Nanopowder Market Value (US$ Mn) Forecast, by End-use Industry 2022–2031
Table 179: Rest of Latin America Molybdenum Trioxide Nanopowder Market Volume (Tons) Forecast, by Particle Size, 2022–2031
Table 180: Rest of Latin America Molybdenum Trioxide Nanopowder Market Value (US$ Mn) Forecast, by Particle Size, 2022–2031
Table 181: Rest of Latin America Molybdenum Trioxide Nanopowder Market Volume (Tons) Forecast, by Purity, 2022–2031
Table 182: Rest of Latin America Molybdenum Trioxide Nanopowder Market Value (US$ Mn) Forecast, by Purity, 2022–2031
Table 183: Rest of Latin America Molybdenum Trioxide Nanopowder Market Volume (Tons) Forecast, by Application, 2022–2031
Table 184: Rest of Latin America Molybdenum Trioxide Nanopowder Market Value (US$ Mn) Forecast, by Application, 2022–2031
Table 185: Rest of Latin America Molybdenum Trioxide Nanopowder Market Volume (Tons) Forecast, by End-use Industry, 2022–2031
Table 186: Rest of Latin America Molybdenum Trioxide Nanopowder Market Value (US$ Mn) Forecast, by End-use Industry 2022–2031
Table 187: Middle East & Africa Molybdenum Trioxide Nanopowder Market Volume (Tons) Forecast, by Particle Size, 2022–2031
Table 188: Middle East & Africa Molybdenum Trioxide Nanopowder Market Value (US$ Mn) Forecast, by Particle Size, 2022–2031
Table 189: Middle East & Africa Molybdenum Trioxide Nanopowder Market Volume (Tons) Forecast, by Purity, 2022–2031
Table 190: Middle East & Africa Molybdenum Trioxide Nanopowder Market Value (US$ Mn) Forecast, by Purity, 2022–2031
Table 191: Middle East & Africa Molybdenum Trioxide Nanopowder Market Volume (Tons) Forecast, by Application, 2022–2031
Table 192: Middle East & Africa Molybdenum Trioxide Nanopowder Market Value (US$ Mn) Forecast, by Application, 2022–2031
Table 193: Middle East & Africa Molybdenum Trioxide Nanopowder Market Volume (Tons) Forecast, by End-use Industry, 2022–2031
Table 194: Middle East & Africa Molybdenum Trioxide Nanopowder Market Value (US$ Mn) Forecast, by End-use Industry 2022–2031
Table 195: Middle East & Africa Molybdenum Trioxide Nanopowder Market Volume (Tons) Forecast, by Country and Sub-region, 2022–2031
Table 196: Middle East & Africa Molybdenum Trioxide Nanopowder Market Value (US$ Mn) Forecast, by Country and Sub-region, 2022–2031
Table 197: GCC Molybdenum Trioxide Nanopowder Market Volume (Tons) Forecast, by Particle Size, 2022–2031
Table 198: GCC Molybdenum Trioxide Nanopowder Market Value (US$ Mn) Forecast, by Particle Size, 2022–2031
Table 199: GCC Molybdenum Trioxide Nanopowder Market Volume (Tons) Forecast, by Purity, 2022–2031
Table 200: GCC Molybdenum Trioxide Nanopowder Market Value (US$ Mn) Forecast, by Purity, 2022–2031
Table 201: GCC Molybdenum Trioxide Nanopowder Market Volume (Tons) Forecast, by Application, 2022–2031
Table 202: GCC Molybdenum Trioxide Nanopowder Market Value (US$ Mn) Forecast, by Application, 2022–2031
Table 203: GCC Molybdenum Trioxide Nanopowder Market Volume (Tons) Forecast, by End-use Industry, 2022–2031
Table 204: GCC Molybdenum Trioxide Nanopowder Market Value (US$ Mn) Forecast, by End-use Industry 2022–2031
Table 205: South Africa Molybdenum Trioxide Nanopowder Market Volume (Tons) Forecast, by Particle Size, 2022–2031
Table 206: South Africa Molybdenum Trioxide Nanopowder Market Value (US$ Mn) Forecast, by Particle Size, 2022–2031
Table 207: South Africa Molybdenum Trioxide Nanopowder Market Volume (Tons) Forecast, by Purity, 2022–2031
Table 208: South Africa Molybdenum Trioxide Nanopowder Market Value (US$ Mn) Forecast, by Purity, 2022–2031
Table 209: South Africa Molybdenum Trioxide Nanopowder Market Volume (Tons) Forecast, by Application, 2022–2031
Table 210: South Africa Molybdenum Trioxide Nanopowder Market Value (US$ Mn) Forecast, by Application, 2022–2031
Table 211: South Africa Molybdenum Trioxide Nanopowder Market Volume (Tons) Forecast, by End-use Industry, 2022–2031
Table 212: South Africa Molybdenum Trioxide Nanopowder Market Value (US$ Mn) Forecast, by End-use Industry 2022–2031
Table 213: Rest of Middle East & Africa Molybdenum Trioxide Nanopowder Market Volume (Tons) Forecast, by Particle Size, 2022–2031
Table 214: Rest of Middle East & Africa Molybdenum Trioxide Nanopowder Market Value (US$ Mn) Forecast, by Particle Size, 2022–2031
Table 215: Rest of Middle East & Africa Molybdenum Trioxide Nanopowder Market Volume (Tons) Forecast, by Purity, 2022–2031
Table 216: Rest of Middle East & Africa Molybdenum Trioxide Nanopowder Market Value (US$ Mn) Forecast, by Purity, 2022–2031
Table 217: Rest of Middle East & Africa Molybdenum Trioxide Nanopowder Market Volume (Tons) Forecast, by Application, 2022–2031
Table 218: Rest of Middle East & Africa Molybdenum Trioxide Nanopowder Market Value (US$ Mn) Forecast, by Application, 2022–2031
Table 219: Rest of Middle East & Africa Molybdenum Trioxide Nanopowder Market Volume (Tons) Forecast, by End-use Industry, 2022–2031
Table 220: Rest of Middle East & Africa Molybdenum Trioxide Nanopowder Market Value (US$ Mn) Forecast, by End-use Industry 2022–2031
List of Figures
Figure 1: Global Molybdenum Trioxide Nanopowder Market Volume Share Analysis, by Particle Size, 2021, 2027, and 2031
Figure 2: Global Molybdenum Trioxide Nanopowder Market Attractiveness, by Particle Size
Figure 3: Global Molybdenum Trioxide Nanopowder Market Volume Share Analysis, by Purity, 2021, 2027, and 2031
Figure 4: Global Molybdenum Trioxide Nanopowder Market Attractiveness, by Purity
Figure 5: Global Molybdenum Trioxide Nanopowder Market Volume Share Analysis, by Application, 2021, 2027, and 2031
Figure 6: Global Molybdenum Trioxide Nanopowder Market Attractiveness, by Application
Figure 7: Global Molybdenum Trioxide Nanopowder Market Volume Share Analysis, by End-use Industry, 2021, 2027, and 2031
Figure 8: Global Molybdenum Trioxide Nanopowder Market Attractiveness, by End-use Industry
Figure 9: Global Molybdenum Trioxide Nanopowder Market Volume Share Analysis, by Region, 2021, 2027, and 2031
Figure 10: Global Molybdenum Trioxide Nanopowder Market Attractiveness, by Region
Figure 11: North America Molybdenum Trioxide Nanopowder Market Volume Share Analysis, by Particle Size, 2021, 2027, and 2031
Figure 12: North America Molybdenum Trioxide Nanopowder Market Attractiveness, by Particle Size
Figure 13: North America Molybdenum Trioxide Nanopowder Market Attractiveness, by Particle Size
Figure 14: North America Molybdenum Trioxide Nanopowder Market Volume Share Analysis, by Purity, 2021, 2027, and 2031
Figure 15: North America Molybdenum Trioxide Nanopowder Market Attractiveness, by Purity
Figure 16: North America Molybdenum Trioxide Nanopowder Market Volume Share Analysis, by Application, 2021, 2027, and 2031
Figure 17: North America Molybdenum Trioxide Nanopowder Market Attractiveness, by Application
Figure 18: North America Molybdenum Trioxide Nanopowder Market Volume Share Analysis, by End-use Industry, 2021, 2027, and 2031
Figure 19: North America Molybdenum Trioxide Nanopowder Market Attractiveness, by End-use Industry
Figure 20: North America Molybdenum Trioxide Nanopowder Market Attractiveness, by Country and Sub-region
Figure 21: Europe Molybdenum Trioxide Nanopowder Market Volume Share Analysis, by Particle Size, 2021, 2027, and 2031
Figure 22: Europe Molybdenum Trioxide Nanopowder Market Attractiveness, by Particle Size
Figure 23: Europe Molybdenum Trioxide Nanopowder Market Volume Share Analysis, by Purity, 2021, 2027, and 2031
Figure 24: Europe Molybdenum Trioxide Nanopowder Market Attractiveness, by Purity
Figure 25: Europe Molybdenum Trioxide Nanopowder Market Volume Share Analysis, by Application, 2021, 2027, and 2031
Figure 26: Europe Molybdenum Trioxide Nanopowder Market Attractiveness, by Application
Figure 27: Europe Molybdenum Trioxide Nanopowder Market Volume Share Analysis, by End-use Industry, 2021, 2027, and 2031
Figure 28: Europe Molybdenum Trioxide Nanopowder Market Attractiveness, by End-use Industry
Figure 29: Europe Molybdenum Trioxide Nanopowder Market Volume Share Analysis, by Country and Sub-region, 2021, 2027, and 2031
Figure 30: Europe Molybdenum Trioxide Nanopowder Market Attractiveness, by Country and Sub-region
Figure 31: Asia Pacific Molybdenum Trioxide Nanopowder Market Volume Share Analysis, by Particle Size, 2021, 2027, and 2031
Figure 32: Asia Pacific Molybdenum Trioxide Nanopowder Market Attractiveness, by Particle Size
Figure 33: Asia Pacific Molybdenum Trioxide Nanopowder Market Volume Share Analysis, by Purity, 2021, 2027, and 2031
Figure 34: Asia Pacific Molybdenum Trioxide Nanopowder Market Attractiveness, by Purity
Figure 35: Asia Pacific Molybdenum Trioxide Nanopowder Market Volume Share Analysis, by Application, 2021, 2027, and 2031
Figure 36: Asia Pacific Molybdenum Trioxide Nanopowder Market Attractiveness, by Application
Figure 33: Asia Pacific Molybdenum Trioxide Nanopowder Market Volume Share Analysis, by End-use Industry, 2021, 2027, and 2031
Figure 34: Asia Pacific Molybdenum Trioxide Nanopowder Market Attractiveness, by End-use Industry
Figure 35: Asia Pacific Molybdenum Trioxide Nanopowder Market Volume Share Analysis, by Country and Sub-region, 2021, 2027, and 2031
Figure 36: Asia Pacific Molybdenum Trioxide Nanopowder Market Attractiveness, by Country and Sub-region
Figure 33: Latin America Molybdenum Trioxide Nanopowder Market Volume Share Analysis, by Particle Size, 2021, 2027, and 2031
Figure 34: Latin America Molybdenum Trioxide Nanopowder Market Attractiveness, by Particle Size
Figure 35: Latin America Molybdenum Trioxide Nanopowder Market Volume Share Analysis, by Purity, 2021, 2027, and 2031
Figure 36: Latin America Molybdenum Trioxide Nanopowder Market Attractiveness, by Purity
Figure 33: Latin America Molybdenum Trioxide Nanopowder Market Volume Share Analysis, by Application, 2021, 2027, and 2031
Figure 34: Latin America Molybdenum Trioxide Nanopowder Market Attractiveness, by Application
Figure 35: Latin America Molybdenum Trioxide Nanopowder Market Volume Share Analysis, by End-use Industry, 2021, 2027, and 2031
Figure 36: Latin America Molybdenum Trioxide Nanopowder Market Attractiveness, by End-use Industry
Figure 36: Latin America Molybdenum Trioxide Nanopowder Market Volume Share Analysis, by Country and Sub-region, 2021, 2027, and 2031
Figure 37: Latin America Molybdenum Trioxide Nanopowder Market Attractiveness, by Country and Sub-region
Figure 38: Middle East & Africa Molybdenum Trioxide Nanopowder Market Volume Share Analysis, by Particle Size, 2021, 2027, and 2031
Figure 39: Middle East & Africa Molybdenum Trioxide Nanopowder Market Attractiveness, by Particle Size
Figure 40: Middle East & Africa Molybdenum Trioxide Nanopowder Market Volume Share Analysis, by Purity, 2021, 2027, and 2031
Figure 41: Middle East & Africa Molybdenum Trioxide Nanopowder Market Attractiveness, by Purity
Figure 42: Middle East & Africa Molybdenum Trioxide Nanopowder Market Volume Share Analysis, by Application, 2021, 2027, and 2031
Figure 43: Middle East & Africa Molybdenum Trioxide Nanopowder Market Attractiveness, by Application
Figure 44: Middle East & Africa Molybdenum Trioxide Nanopowder Market Volume Share Analysis, by End-use Industry, 2021, 2027, and 2031
Figure 45: Middle East & Africa Molybdenum Trioxide Nanopowder Market Attractiveness, by End-use Industry
Figure 46: Middle East & Africa Molybdenum Trioxide Nanopowder Market Volume Share Analysis, by Country and Sub-region, 2021, 2027, and 2031
Figure 47: Middle East & Africa Molybdenum Trioxide Nanopowder Market Attractiveness, by Country and Sub-region
Copyright © Transparency Market Research, Inc. All Rights reserved
Trust Online


Molybdenum Trioxide Nanopowder Market