Antimony
Last updated:19 December 2023
Please note that this page is currently under review.
Resource figures are current as at 31 December 2019.
Antimony is a silverly, lustrous grey metal that exhibits poor heat and electrical conductivity. It is relatively soft, measuring only 3.25 on Moh's scale of mineral hardness. Known as "stibium" in classical Latin, antimony is represented by the chemical symbol Sb. A member of the arsenic group of elements, antimony is commonly found in association with gold mineralisation but it also occurs with some silver-lead-zinc deposits. Its average abundance in the Earth's crust ranges from 0.2 to 0.5 ppm, which is 10 times that of silver. Antimony is rarely found in its pure state and most commonly occurs in nature as the sulphide mineral stibnite (Sb2S3). It also occurs in more than 100 other minerals, usually as oxide, e.g., valentinite (Sb2O3), and as antimonies of heavy metal sulphides such as tetrahedrite ((Cu,Fe,Zn,Ag)12Sb4S13), livingstonite (HgSb4S7) and jamesonite (Pb4FeSb6S14).
Despite its potential toxicity, antimony is known to have been used for medicinal and cosmetic purposes in ancient times. In the modern era, antimony is rarely used in pure form owing to the metal's tendency to be brittle and flaky. It is most commonly used with other metals to form alloys or combined with oxygen to form antimony trioxide (ATO; Sb2O3). Metallic antimony is used as a hardening agent for lead and its use in lead storage batteries accounts for around one third of global use. Antimony alloys are also used for manufacturing solder, sheet and pipe metal, ammunition, bearings, castings and pewter. ATO is used in non-metallic products such as paint (pigment and fire retardant), ceramics (opacifier), enamels (fire retardant), rubber (fire retardant), glass (de-gassing), paper (fire retardant), plastics (fire retardant) and textiles (fire retardant). ATO's use as a fire retardant also accounts for about one third of global antimony use. In its purest forms, antimony is used in semiconductor technology, infrared detectors and diodes (two-terminal semiconductors that primarily conduct current in one direction only).
The bulk of secondary antimony is recovered at lead smelters from lead-acid batteries. The recycling rate for antimony is unclear but thought to be between 1 and 28% in the European Union1 and to account for around 18% of antimony supply in the United States of America2.
Antimony features highly on the critical minerals lists of many countries including Australia3, the United States of America4, Canada5, Japan6 and the European Union7. Critical minerals are those minerals (or elements) considered vital for the well-being of the world's economies, yet whose supply may be at risk of disruption.
JORC Ore Reserves
Proved and Probable Ore Reserves published in compliance with the Joint Ore Reserves Committee (JORC) Code8 amounted to 17.7 kilotonnes (kt) of antimony in 2019 (Table 1). As of 31 December 2019, 100% of Australia's Ore Reserves of antimony are attributable to the Costerfield mine in Victoria (Table 2). Costerfield produces antimony as a by-product to gold and is Australia's only antimony producer.
Ore Reserves were down 73% from 2018 levels owing to reclassification of the Hillgrove deposit in New South Wales. Hillgrove had been on care and maintenance since 2016 but recommenced production of gold, from Mineral Resources, at the Baker's Creek Stockpile in late 2020 with plans to reopen the underground mine at the Metz Mining Centre scheduled for mid to late 2021.
Table 1. Australia's Ore Reserves of antimony, production and potential reserve life, 2002-2019.
| Year | Proved and Probable Ore Reserves1 (kt Sb) | Production2 (kt Sb) | Reserve Life (years) |
|---|---|---|---|
| 2019 | 17.7 | 2.03 | 9 |
| 2018 | 64.6 | 3.57 | 18 |
| 2017 | 64.3 | 4.61 | 14 |
| 2016 | 65 | 5.5 | 12 |
| 2015 | 66.3 | 3.7 | 18 |
| 2014 | 62.6 | 5.8 | 11 |
| 2013 | 63 | 5.0 | 13 |
| 2012 | 55 | 3.9 | 14 |
| 2011 | 52 | 1.6 | 33 |
| 2010 | 54 | 1.1 | 49 |
| 2009 | 42 | 0.2 | 210 |
| 2008 | 96 | n.a | n.a. |
| 2007 | 96 | n.a | n.a |
| 2006 | 58 | n.a | n.a |
| 2005 | 58 | n.a | n.a |
| 2004 | 46.3 | n.a | n.a |
| 2003 | 50.8 | n.a | n.a |
| 2002 | 58.1 | n.a | n.a |
kt Sb = kilotonnes of antimony content; n.a. = not available. Reserve Life = Ore Reserves ÷ Production.
- The majority of Australian Ore Reserves are reported in compliance with the JORC Code, however there may be companies that report to foreign stock exchanges using other reporting codes, which are largely equivalent. In addition, Geoscience Australia may hold confidential information for some commodities.
- Antimony production from company reports.
Table 2. Ore Reserves and Mineral Resources of antimony reported in compliance with the JORC Code at operating mines in 2019.
| No. of Operating Mines1 | Ore Reserves2 (kt Sb) | Measured and Indicated Resources3 (kt Sb) | Inferred Resources4 (kt Sb) | Mine Production5 (kt Sb) | Reserve Life6 (years) | Resource Life 17 (years) | Resource Life 28 (years) |
|---|---|---|---|---|---|---|---|
| 1 | 17.7 | 36.8 | 9.1 | 2.03 | 9 | 23 | 27 |
kt Sb = kilotonnes of antimony content.
- The number of operating mines are those that operated for some period during 2019. Production in 2019 was entirely from Costerfield.
- The majority of Australian Ore Reserves and Mineral Resources are reported in compliance with the JORC Code, however there are a number of companies that report to foreign stock exchanges using other reporting codes, which are largely equivalent. In addition, Geoscience Australia may hold confidential information for some commodities. NB: Not all operating mines report Ore Reserves. Ore Reserves are as at 31 December 2019.
- Measured and Indicated Mineral Resources are inclusive of the Ore Reserves. NB: Not all operating mines report Mineral Resources. Mineral Resources are as at 31 December 2019.
- Inferred Mineral Resources are as at 31 December 2019. NB: Not all operating mines report Mineral Resources.
- Mine production is production from company reports (Mandalay Resources Ltd).
- Reserve Life* = Ore Reserves ÷ Production.
- Resource Life 1* = (Measured + Indicated Resources) ÷ Production.
- Resource Life 2* = (Measured + Indicated + Inferred Resources) ÷ Production.
*Reserve and resource life for each mineral commodity is calculated by dividing the inventory by production. The resulting ratio is a snapshot in time that can only be used for general impressions because it is an average and it assumes (1) that production rates in the future will remain the same as those used in the calculation, (2) deposits deemed economic/uneconomic remain so in the future and (3) that depleted resources are never replaced.
Identified Resources
More than 20 Australian deposits are known to contain antimony but mostly at subeconomic grades. It typically occurs in association with gold but, in Australia, is also known to occur in some zinc-lead-silver deposits. The bulk of Australia’s Economic Demonstrated Resources (EDR) of antimony occur at the Costerfield gold deposit in Victoria and at the Hillgrove deposit in New South Wales. Companies have also reported economic resources in Western Australia at the Spec deposits and at Eastern Hills (Figure 1).
Accessible EDR
Some resources are inaccessible for mining because of environmental restrictions, government policies or because they occur within military lands or national parks. All of Australia's EDR of antimony are considered to be accessible.
Production
Antimony is currently produced at the Costerfield gold deposit in Victoria (Table 2) and, until January 2016, was produced at the Hillgrove deposit in New South Wales until declining antimony prices forced its closure. Domestic mine production in Australia amounted to 2.03 kt in 2019, down from 3.57 kt in 2018 (Table 1; Table 2; Table 3).
Table 3. Australia's identified antimony resources and world figures for selected years from 1975–2019.
| Year | Demonstrated Resources (kt Sb) | Inferred Resources2 (kt Sb) | Accessible EDR3 (kt Sb) | Australian Mine Production4 (kt Sb) | World Economic Resources5 (kt Sb) | World Mine Production6 (kt Sb) | ||
|---|---|---|---|---|---|---|---|---|
| Economic (EDR)1 | Paramarginal | Submarginal | ||||||
| 2019 | 100.5 | 8.8 | 0 | 37.2 | 100.5 | 2.03 | 1,500 | 160 |
| 2018 | 142.7 | 8.8 | 0 | 61.1 | 142.7 | 3.57 | 1,500 | 140 |
| 2017 | 138.2 | 8.8 | 0 | 186.0 | 138.2 | 4.61 | 1,500 | 150 |
| 2016 | 138.9 | 8.8 | 0 | 190.6 | 138.9 | 5.5 | 1,500 | 130 |
| 2015 | 159.3 | 8.8 | 0 | 191.7 | 159.3 | 3.7 | 200 | 150 |
| 2014 | 138.8 | 8.8 | 0 | 62.8 | 138.8 | 5.8 | 1,800 | 160 |
| 2013 | 134 | 9 | 0 | 207 | 134 | 5.0 | 1,800 | 163 |
| 2012 | 107 | 9 | 0 | 203 | 107 | 3.9 | 1,800 | 180 |
| 2011 | 106 | 9 | 0 | 204 | 106 | 1.6 | 1,800 | 189 |
| 2010 | 95 | 10 | 0 | 198 | 95 | 1.1 | 1,800 | 135 |
| 2009 | 61 | 17 | 24 | 226 | 61 | 0.2 | 2,100 | 187 |
| 2008 | 136 | 43 | 36 | 60 | 136 | n.a | 2,100 | 135 |
| 2007 | 136 | 43 | 36 | 60 | 136 | n.a | 2,100 | 135 |
| 2006 | 93 | 31 | 53 | 52 | 93 | n.a | 1,800 | 117 |
| 2005 | 93 | 31 | 53 | 52 | 93 | n.a | 1,800 | 117 |
| 2004 | 80 | 31 | 52 | 54 | 80 | n.a | 1,800 | 112 |
| 2003 | 85 | 31 | 51 | 56 | 85 | n.a | 1,800 | 142 |
| 2002 | 90 | 34 | 50 | 58 | 90 | n.a | 1,800 | 141 |
| 2001 | 95 | 36 | 50 | 61 | n.a | 1.7 | 2,100 | 115 |
| 2000 | n.a | n.a | n.a | n.a | n.a | n.a | 2,100 | 121 |
| 1995 | 97.9 | 33.8 | 36.3 | 16.7 | n.a | 0.9 | n.a | 108 |
| 1990 | 14.5 | 4.1 | n.a | 87 | n.a | 1.3 | 4,200 | 69 |
| 1985 | 13.9 | 2 | 94 | 0 | n.a | 1.4 | 5,175 | 30 |
| 1980 | 42.6 | 26 | 28 | 14.7 | n.a | 1.38 | 4,717 | 78 |
| 1975 | 78 | 31 | 0 | 0 | n.a | 2.21 | 4,173 | 78 |
kt Sb = kilotonnes of antimony content; n.a. = not available.
- Economic Demonstrated Resources (EDR) predominantly comprise Ore Reserves and most Measured and Indicated Mineral Resources that have been reported in compliance with the Joint Ore Reserves Committee (JORC) Code to the Australian Securities Exchange (ASX). In addition, some reserves and resources may have been reported using other reporting codes to foreign stock exchanges and Geoscience Australia may hold confidential data for some commodities.
- Total Inferred Resources in economic, subeconomic and undifferentiated categories.
- Accessible Economic Demonstrated Resources (AEDR) is the portion of total EDR that is accessible for mining. AEDR does not include resources that are inaccessible for mining because of environmental restrictions, government policies or military lands.
- Australian antimony production from company reports.
- World economic resources from Mineral Commodity Summaries, published by the USGS and adjusted with Geoscience Australia data, unless otherwise stated.
- World production from Mineral Commodity Summaries, published by the USGS and adjusted with Geoscience Australia data, unless otherwise stated.
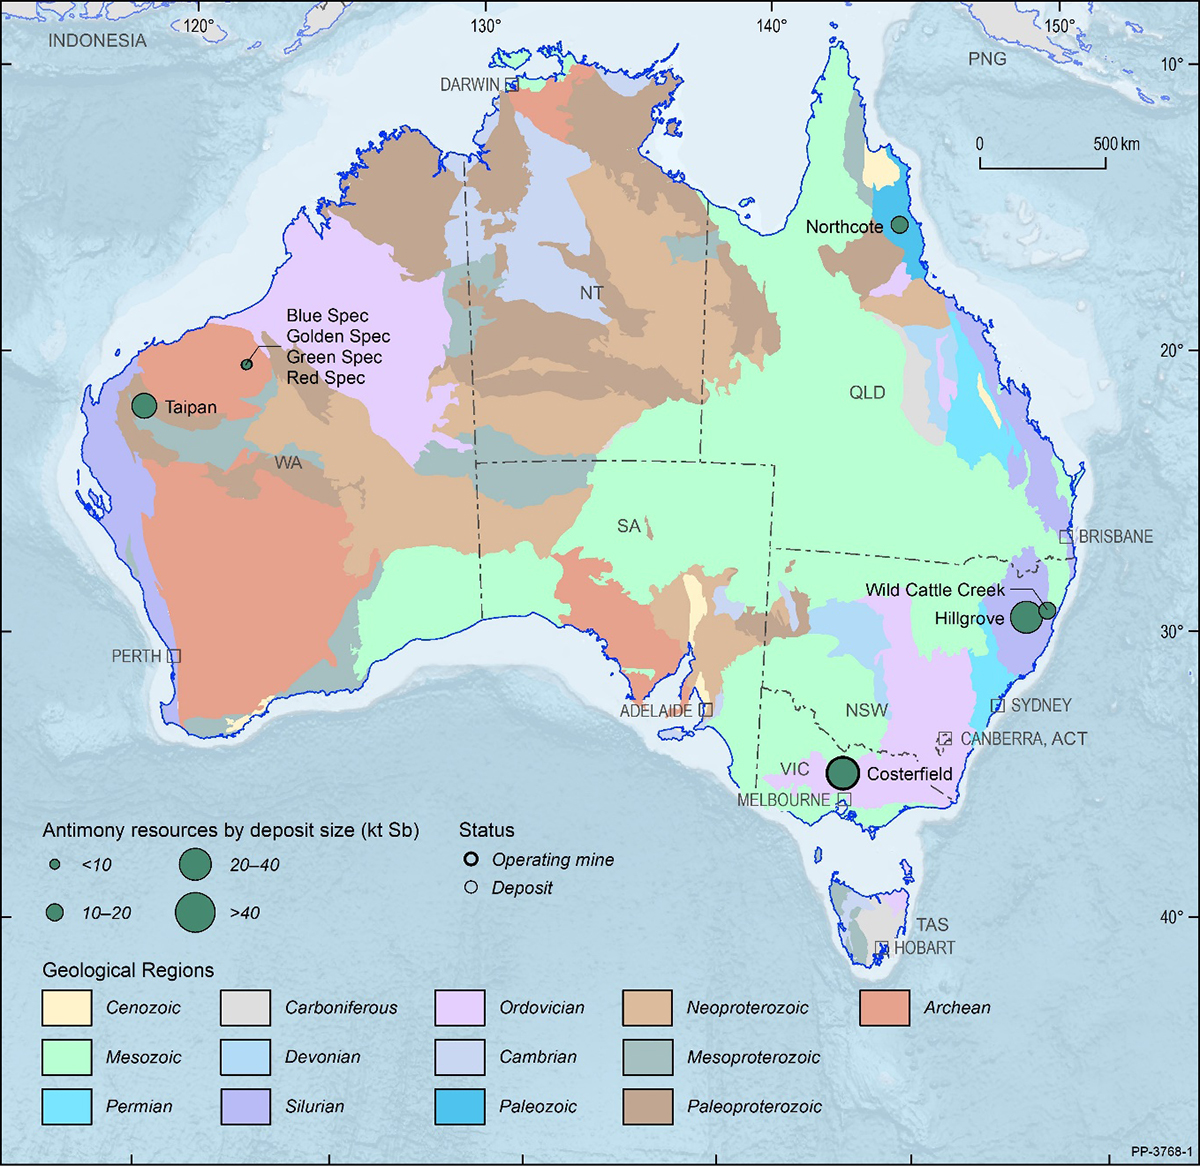
Figure 1. Australian antimony deposits and operating mines as at 31 December 2019. Deposit size is based on total resources (EDR + Subeconomic Demonstrated Resources + Inferred). For clarity, only major or significant deposits are labelled. kt Sb = kilotonnes of antimony content.
World Ranking
Based on estimates provided by the USGS and adjusted for Australia, world economic resources of antimony amounted to approximately 1,500 kt in 2019, unchanged from the previous year (Table 4). On the global stage, China dominates production, resources and demand. China's share of global antimony resources amounts to 32% followed by Russia (23%), Bolivia (21%) and Australia (7%; Table 4). Australia also ranks seventh for antimony production (Table 5), despite all production coming from a single source. China produces 63% of global antimony followed by Russia (19%), Tajikistan (10%) and Bolivia (2%; Table 5).
Table 4. World economic resources of antimony 2019.
| Rank | Country | Economic Resources1 (kt Sb) | Percentage of world total2 |
|---|---|---|---|
| 1 | China | 480 | 32% |
| 2 | Russia | 350 | 23% |
| 3 | Bolivia | 310 | 21% |
| 4 | Australia | 100.5 | 7% |
| 5 | Turkey | 100 | 7% |
| 6 | USA | 60 | 4% |
| 7 | Tajikistan | 50 | 3% |
| 8 | Pakistan | 26 | 2% |
| 9 | Mexico | 18 | 1% |
| Total | 1,500 |
kt Sb = kilotonnes of antimony content.
- Source: USGS9 and Geoscience Australia. National figures other than Australia are rounded.
- Percentages are also rounded and might not add up to 100% exactly.
Table 5. World production of antimony 2019.
| Rank | Country | Production1 (kt Sb) | Percentage of world total2 |
|---|---|---|---|
| 1 | China | 100 | 63% |
| 2 | Russia | 30 | 19% |
| 3 | Tajikistan | 16 | 10% |
| 4 | Bolivia | 3 | 2% |
| 5 | Burma | 3 | 2% |
| 6 | Turkey | 3 | 2% |
| 7 | Australia | 2.03 | 1% |
| Others | 2.3 | 1% | |
| Total | 160 |
kt Sb = kilotonnes of antimony content.
- Source: USGS10 and Geoscience Australia. National figures other than Australia are rounded.
- Percentages are rounded and might not add up to 100% exactly.
Industry Developments
Exploration
Published statistical data on exploration expenditure for antimony are not available. However, S&P Global Market Intelligence indicates that most drilling for antimony in 2019 and 2020 occurred at the Costerfield Operation as both extension and exploration drilling. Antimony results from exploration and extension drilling were also reported at the Hillgrove Gold Project and Lewis Ponds multi-commodity Project in New South Wales, the Tennant Creek Project in the Northern Territory, Agate Creek Gold Project in Queensland, Aurora Tank Gold Project in South Australia and the Mount Remarkable Project and Bardoc Tectonic Zone Gold Project, both located in Western Australia.
In the foreseeable future, antimony will continue to be recovered from the gold ore at Costerfield provided market demand is present. Recommencement of operations at Hillgrove in New South Wales could add additional antimony production and resource delineation going forward. Looking further into the future, higher antimony prices and/or technological advances may encourage the recovery of antimony at other gold deposits in Australia. There is also potential for antimony recovery from Australian zinc-lead-silver ores. The Cannington deposit in Queensland and the McArthur River deposit in the Northern Territory, for example, have substantial antimony content but mineralisation occurs at low concentrations, thus it is currently uneconomic to recover.
Hillgrove: The historic Hillgrove operation, located 23 km east of Armidale in northern New South Wales, began producing antimony in 1877, followed by gold production in 1881 and tungsten from the late 1930s and late 1950s. It is one of the largest known antimony deposits outside of China. More than 50 kt of antimony has been produced from multiple seams11 and there is still a substantial resource. It operated most recently from 1969–2002 and briefly again in 2009 and 2016.
The Hillgrove mineralisation is hosted in late Palaeozoic metasediments and Permo-Carboniferous granitoids of the New England Orogen. The antimony-gold-tungsten mineralisation occurs within vein and breccia systems in steeply dipping fissures that are strike extensive (more than 20 km of veining is known)12 . More than 204 individual occurrences have been identified in the district13.
After being placed on care and maintenance in 2009 by Straits Resources Ltd (now Aeris Resources Ltd), the project was acquired by Bracken Resources Pty Ltd in 2013 and then by Red River Resources Ltd in 2019.
Since its acquisition of the deposit, Red River has commenced operations at Hillgrove in a two-stage process. Stage 1 saw the commencement of processing the Bakers Creek Stockpile for gold production in December 202014. This resource comprises some 0.56 tonnes (t) of gold and has an expected operational life of 12 months15. Stage 2 will see the reopening on the underground operations at the Metz Mining Centre, which has a Mineral Resource amounting to 41 kt of antimony and 13.2 t of gold16. The company plans to produce gold doré, gold concentrate and antimony-gold concentrate and 1.0–1.5 t of gold equivalent per annum over five years.
The JORC-compliant resource at Hillgrove comprises a Measured Resource of 17 kt of antimony and 1.6 t of gold, an Indicated Resource of 37 kt antimony and 11.0 t gold and an Inferred Resource of 21 kt antimony and 8.9 t of gold17.
Wild Cattle Creek (Bielsdown): This historical mine is located 90 km northwest of Armidale in northern New South Wales, near the town of Dorrigo. The deposit was discovered in 1927 and mined intermittently for gold, tungsten and antimony. Mineralisation is contained within a silicified fault breccia hosted by steeply dipping, regional strike-slip faults adjacent to metasedimentary rocks, which are thought to be Late Carboniferous. Currently held by Anchor Resources Ltd, Wild Cattle Creek has a JORC-compliant Indicated Resource of 10.404 kt and an Inferred Resource of 5.238 kt of antimony18.
Northcote:The metasedimentary Hodgkinson Basin in north Queensland forms part of the Late Silurian to Late Devonian Tasman Fold Belt. It hosts widespread gold, tungsten, tin, copper and antimony mineralisation with several major centres of past production, such as the Palmer and Hodgkinson goldfields and the Herberton tin-field. Gold at Northcote generally occurs within epigenetic gold-quartz veins hosted within small fissures or larger reverse faults. Antimony, as stibnite, frequently occurs as a minor associate of gold19 .
In 2018, Bulletin Resources Ltd entered into an agreement with Territory Minerals Ltd to acquire an 80% interest in a number of tenements in the region including the Northcote antimony deposit. Previous owners, Republic Gold Ltd, had reported a JORC (2004) estimation of 5.18 kt Sb Measured, 2.82 kt Sb Indicated and 2.54 kt Sb Inferred in 200920. However, Bulletin Resources expressed caution about the modifying factors used to determine these estimates, including the lower cut-off grades, which the company considered possibly too low for practical economic consideration21. In January 2019, Bulletin withdrew from the proposed acquisition and terminated the sales agreement.
Costerfield: The Costerfield gold mine is Australia's only mine producing antimony as at June 2021. Located 50 km southeast of Bendigo in central Victoria, it has produced antimony and gold intermittently since its discovery in the 1860s.
Mineralisation in the Costerfield district occurs in the western portion of the Melbourne Zone and is hosted by Silurian siltstone. It occurs as steeply dipping quartz reefs exposed in the core of the Costerfield anticline22 . These reefs can be classified as auriferous quartz-stibnite veins, auriferous stibnite-quartz veins or barren veins23.
Historically, mining at Costerfield has taken place over a length of approximately 8 km, north to south, with the current focus of mining, the Augusta lodes, at the southern end. Mineralized zones can be several metres wide but are generally narrower. The reefs, though, tend to be persistent along strike and down dip, with some individual ore shoots having been traced over 800 m strike length and worked down to 300 m depth24.
In 2019, the modern workings, owned by Mandalay Resources, produced 2.03 kt of antimony25. Ore is trucked from the Augusta mine portal to the Brunswick plant 2 km away where it is stockpiled, blended, crushed, separated, flotated and filtered. The gravity gold concentrate is refined in Melbourne and the gold-antimony flotation concentrate is exported to smelters in China via the Port of Melbourne.
In 2019, the company conducted a deep hole drilling campaign beneath the high-grade Youle vein at 1,700 m below surface26, with depth extension exploration ongoing throughout 2020 and continuing into 2021. The aim of the program is to improve geological understanding of deep and highly prospective targets for future resource delineation and production.
In accordance with the JORC Code, the Costerfield operation has reported a Measured Resource of 12.74 kt (inclusive of a Proved Reserve of 5.47 kt), an Indicated Resource of 24.07 kt (inclusive of a Probable Reserve of 12.24 kt) and an Inferred Resource of 9.06 kt, alongside an estimate of 14.3 t of gold in these categories27.
Blue Spec, Golden Spec, Green Spec and Red Spec: These deposits occur in the Eastern Pilbara Granite-Greenstone Terrane of Western Australia. They are primarily gold deposits but Measured and Indicated Resources of antimony (totalling 3.4 kt) and Inferred Resources (2.8 kt) have also been reported28 . The gold-antimony mineralisation occurs along steeply dipping bifurcating shears within pelitic rocks of the metasedimentary, Archaean Mosquito Creek Formation29.
In 2013, Northwest Resources Ltd investigated the option of producing a gold-rich antimony concentrate to take advantage of attractive antimony prices and Chinese demand. However, further feasibility studies were deferred with the company citing the high volatility of the gold price and the difficulties for junior gold companies to acquire debt financing30. The project was acquired by Novo Resources Corp in 2016, who extended the area of mineralisation in their 2017 drilling campaign31.
In September 2020, Calidus Resources Ltd announced its plans to acquire the Blue Spec deposit, which is approximately 70 km from its Warrawoona Gold Project and suitable for trucking. Calidus has reviewed the metallurgical test work previously carried out by Northwest Resources for a gold-enriched antimony concentrate and confirmed that the ore will be suitable for treatment though its planned sulphide circuit at Warrawoona32.
Eastern Hills (Taipan): The Eastern Hills antimony deposit is part of the Mount Clement Gold Project, sold in 2020 to Northern Star Resources Ltd by Artemis Resources Ltd33. It is located approximately 165 km west of Paraburdoo in the Ashburton Region of Western Australia. The zone of antimony-lead mineralisation at Eastern Hills is up to 2 m wide and occurs as vein-hosted massive sulphides bound by disseminated sulphides within a fault structure. The sulphides comprise boulangerite (Pb5Sb4S11), pyrite, arsenopyrite and minor pyrrhotite, chalcopyrite and galena34.
The antimony content of the Eastern Hills deposit was reported in 2013 by Artemis, who estimated an Indicated Resource of 16.2 kt and an Inferred Resource of 6.5 kt35. However, the company had been concentrating on the gold content of the project deposits and regarded the antimony, arsenic and copper content in the oxide ore as deleterious36. They had been conducting metallurgical tests (cyanide heap leaching) that leave these elements behind in the waste rock. As at June 2021, Northern Star Resources have not published any updates on the antimony resource.
Citation
Bibliographical reference: Britt, A.F. and Senior, A.B., 2021. Australian Resource Reviews: Antimony 2020. Geoscience Australia, Canberra. http://dx.doi.org/10.11636/9781922446534
References
1 European Commission (2017). Study on the review of the list of Critical Raw Materials, Critical Materials Factsheets. European Commission. Publications Office of the European Union, 517pp.
2 United States Geological Survey, 2021. Mineral Commodity Summaries, Antimony 2021.
3Australia's Critical Mineral Strategy 2019, Australian Government, Canberra, 22pp.
4 United States Government Federal Register, 2018. Final List of Critical Minerals 2018. A Notice by the Interior Department on 05/18/2018. Document 83 FR 23295.
6 Nakano, J., 2021. The Geopolitics of Critical Mineral Supply Chains, Japan. Center for Strategic and International Studies.
8 The JORC Code is more correctly known as the Australasian Code for Reporting of Exploration Results, Mineral Resources and Ore Reserves. See: www.jorc.org.
9 United States Geological Survey, 2020. Mineral Commodity Summaries, Antimony 2020.
10 See Footnote 9.
11 Switzer, C.K., Ashley, P.M., Hooper, B. and Roach, B., 2004. The Hillgrove Gold-Antimony-Tungsten District, NSW, Australia. In PACRIM 2004. Australian Institute of Mining and Metallurgy.
12 Hooper, B., Ashley, P. and Shields, P., 2004. The Hillgrove Gold-Antimony-Tungsten District, NSW, Australia. Straits Resources Ltd, Perth, Australia.
13 See Footnote 12.
14 Red River Resources Ltd. ASX release 30 December 2020.
15 See Footnote 14.
16 See Footnote 14.
17 Red River Resources Ltd. Website: https://redriverresources.com.au/operations/hillgrove.html
18 Anchor Resources Ltd, 2013. Quarterly Activities Report September 2013.
19 Bulletin Resources Ltd. ASX Release 3 August 2018.
20 Republic Gold Ltd. ASX Release 29 April 2009.
21 See Footnote 16.
22 Mandalay Resources Corp. NI 43-101 Technical Report. TSX Release 29 March 2018.
23 Fisher, N.H., 1942. Geological report of the Costerfield gold-antimony mine. Bureau of Mineral Resources, Geology and Geophysics, Record 1942/29A, Canberra.
24 See Footnote 19.
25 Mandalay Resources Corp. TSX Release 16 January 2020.
26 See Footnote 23.
27 Australian Government. Australian Critical Minerals Prospectus 2020.
28 Northwest Resources Ltd. Annual Report 2013.
29 Huston, D., Blewett, R., Mernagh, T., Sun, S. and Kamprad, J., 2001. Gold Deposits of the Pilbara Craton: results of AGSO Research, 1998-2000. AGSO – Geoscience Australia, Record 2001/10, Canberra, 74pp.
30 See Footnote 25.
31 Novo Resources Corp. TSX Release 7 March 2017.
32 Calidus Resources Ltd. ASX Release 21 September 2020.
33 Artemis Resources Ltd. Annual Report 2020.
34 Artemis Resources Ltd. ASX Release 16 January 2013.
35 Artemis Resources Ltd. ASX Release 29 November 2013.
36 Artemis Resources Ltd. ASX Release 1 February 2017.