TDG Gold Corp. Publishes Third Set Of Historical Longitudinal And Cross Sections From Shasta Exploration Area Demonstrating Continuation Of Mineralization Along Strike Extending To 1.5 Kilometres.
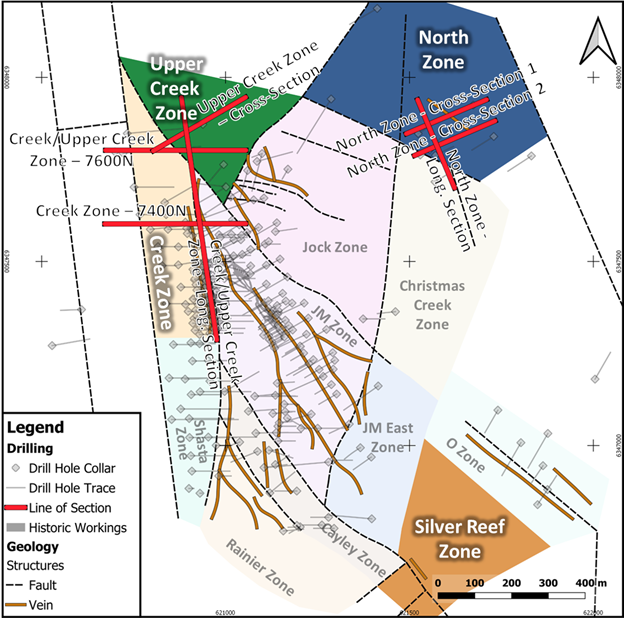
White Rock, British Columbia, February 10, 2021. TDG Gold Corp (TSXV: TDG) (the “Company” or “TDG”) is pleased to provide a third set of longitudinal sections and cross sections from its interpretation work of the historical drilling and exploration undertaken on the former producing high-grade gold and silver Shasta Mine located in the Toodoggone Region of north-central British Columbia. The sections presented in this news release cover the Upper Creek and North Zones (see Figure 1). TDG published the zone map of the Shasta Exploration Area within its news release of December 16, 2020 available via the TDG Gold website.
Upper Creek Zone
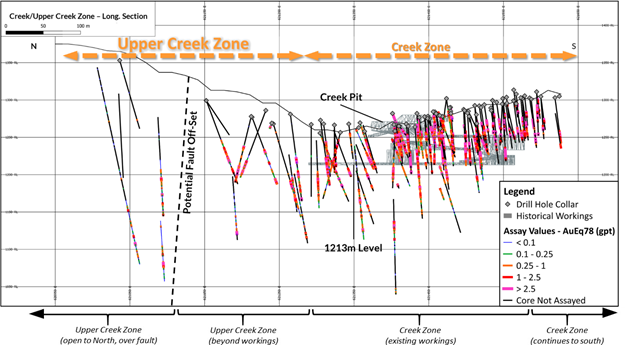
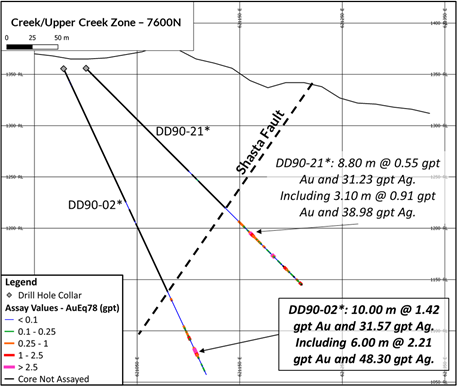
The Upper Creek Zone is defined as the area between the northern limit of underground workings and mineralization up to 350 metres (“m”) due north. The longitudinal sections show that the first 175 m is a continuation of the mineralization seen at the Creek Zone, plunging gently to the north. The mineralization is then truncated and downthrown along a fault and has been encountered at depth in nine holes drilled between 1987 and 1990 which intercepted mineralized quartz breccia at an approximate depth of 220 m to 300 m.
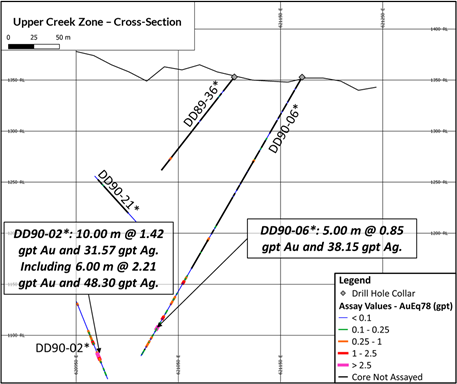
An interval in hole DD90-02 (270 m northwest of the historical workings) starting at 300.5 m returned 10.0 m at 1.42 grams per tonne (“gpt”) gold and 31.57 gpt silver. This appears to represent a continuation of the Creek Zone and is open at depth and along strike.
The continuation of the mineralization and the gentle plunge strengthen the interpretation that the ore forming events are stratigraphically constrained. These historical results suggest potential for continued vein occurrences along strike that lie under a cap of younger, unmineralized volcaniclastic sediments. The strike is consistent with regional northwest to southeast trends.
North Zone
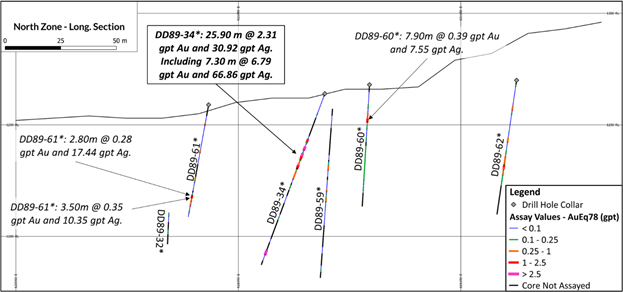
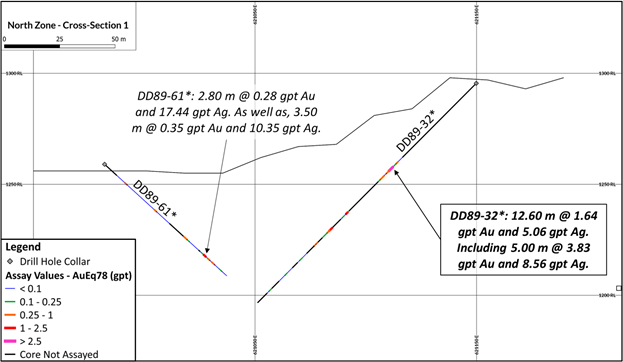
The North Zone is a separate vein system that occurs 750 m northeast of the main Creek and JM Zones and follows the same regional northwest to southeast trend. It was initially discovered in 1989 through the drilling of eight holes over a strike length of 300 m and is open along strike. All drilling was shallow with a maximum hole length of 100 m.
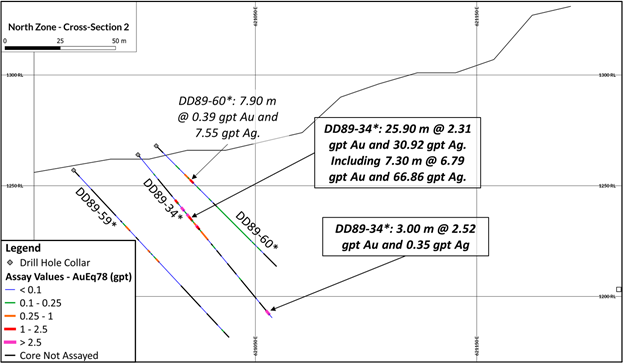
North Zone drill results are highlighted by an interval in hole DD89-34 that returned 25.9 m at 2.31 gpt gold and 30.92 gpt silver from a down hole depth of 26.90 m to 52.80 m.
Silver Reef Zone
The Silver Reef Zone is a mineral showing (MinFile Number 094E 145) located approximately one kilometre southeast of the Shasta Mine. The showing consists of quartz vein stockwork and silicified zones over an area of 200 m. The structure follows the regional trend along a northwest to southeast strike and could be an extension of the JM veins which lie 225 m to the northwest which is supported by historical anomalous soil sample results.
Silver Reef was first discovered in the early 1980s but has seen little work since. An assessment report (AR Number 9886, 1981) reports samples collected from a zone of altered volcanic rocks returned grades of 1.028 gpt silver and 0.27 gpt gold. TDG plans on mapping and sampling this zone in 2021.
The orientation and location of the Silver Reef outcrop indicates gold-silver mineralization in the Shasta Exploration Area extends a total of 1.5 kilometres from north to south.
Historical Drill Results and Sections
Figure 1 below shows the location of the two zones for which drill hole longitudinal sections and cross sections are included in this news release (Figures 2-7). All longitudinal sections and cross sections are available in the Shasta project area of the TDG website (https://tdggold.com/projects/shasta/).
Shasta Exploration Area Longitudinal Sections for Creek/Upper Creek and North Zones
Historical drilling and assay results show gold-silver mineralization continues to the north of the existing surface and underground Creek zone mine workings and remains open to the north, known as the Upper Creek Zone. Sections indicate that the Creek Zone mineralization continues to have gentle plunge to the north before being cut off by a fault and downthrown on the northern block. Significant sections of core were not sampled. The North Zone is an underexplored target zone on the Shasta project; historic drilling has highlighted gold-silver mineralization near-surface.
Figure 2. Longitudinal sections showing mineralized strike for the Creek/Upper Creek Zone and the North Zone.
Shasta Exploration Area Cross Sections (refer to Figure 1)
Creek/Upper Creek Zone Historical Results for the Upper Creek Zone (Figure 3), Creek/Upper Creek Zone (Figure 4) and Creek Zone (Figure 5) Cross Sections
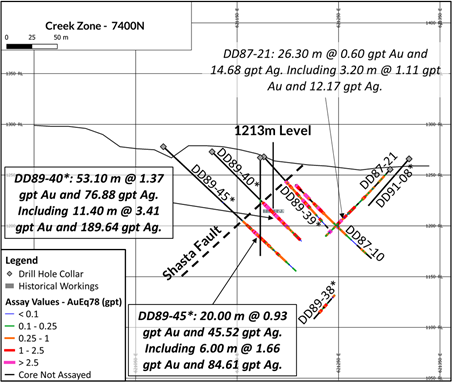
Table 1 shows historical drill assay results with mineralized widths up to 53.1 m of 1.37 gpt gold and 76.88 gpt silver including 11.4 m of 3.41 gpt gold and 189.64 gpt silver located immediately north of the former mine workings area. The records show that sections of core were not assayed, and sampling did not continue into vein “halo” mineralization.
Table 1
| Hole ID | From (m) | To (m) | Composite Length (m) | Au (gpt) | Ag (gpt) | Zone Section |
| DD89-40* | 70.00 | 123.10 | 53.10 | 1.37 | 76.88 | Creek Zone – 7400N. drilled into the most northern Underground Creek Workings – 1213 m Level. |
| including | 72.20 | 83.60 | 11.40 | 3.41 | 189.64 | |
| including | 86.60 | 89.70 | 3.10 | 1.79 | 87.22 | |
| including | 91.20 | 93.70 | 2.50 | 1.78 | 155.06 | |
| including | 96.70 | 99.50 | 2.80 | 1.46 | 59.09 | |
| DD89-45* | 108.60 | 117.60 | 9.00 | 0.41 | 17.89 | Creek Zone – 7400N. drilled below the most northern Underground Creek Workings – 1213 m Level. |
| including | 109.60 | 112.60 | 3.00 | 0.53 | 15.05 | |
| and | 120.10 | 140.10 | 20.00 | 0.93 | 45.52 | |
| including | 122.60 | 128.60 | 6.00 | 1.66 | 84.61 | |
| including | 132.70 | 136.20 | 3.50 | 0.90 | 33.00 | |
| DD90-02* | 300.50 | 310.50 | 10.00 | 1.42 | 31.57 | Creek/Upper Creek Zone – 7600N |
| including | 301.50 | 307.50 | 6.00 | 2.21 | 48.30 | |
| DD90-06* | 181.00 | 184.60 | 3.60 | 0.48 | 1.11 | Upper Creek Zone – Cross-Section. |
| and | 230.80 | 234.80 | 4.00 | 0.30 | 16.00 | |
| and | 270.50 | 274.50 | 4.00 | 0.26 | 20.75 | |
| and | 281.00 | 286.00 | 5.00 | 0.85 | 38.15 | |
| and | 293.00 | 296.50 | 3.50 | 0.22 | 12.14 | |
| and | 300.00 | 306.00 | 6.00 | 0.45 | 1.95 |
Shasta Exploration Area Cross Sections (refer to Figure 1)
Historical Results for the North Zone (Figures 6-7) Cross Sections
Table 2 shows historical drill assay results with mineralized widths up to 25.9 m of 2.31 gpt gold and 30.92 gpt silver including 7.3 m of 6.79 gpt gold and 66.86 gpt silver located due south of the former mine workings area. The records show that sections of core were not assayed, and sampling did not continue into vein “halo” mineralization.
Table 2
| Hole ID | From (m) | To (m) | Composite Length (m) | Au (gpt) | Ag (gpt) | Zone Section |
| DD89-32* | 50.30 | 62.90 | 12.60 | 1.64 | 5.06 | North Zone – Cross-Section 1 |
| including | 52.40 | 57.40 | 5.00 | 3.83 | 8.56 | |
| and | 81.60 | 84.50 | 2.90 | 0.28 | 5.42 | |
| and | 92.30 | 98.70 | 6.40 | 0.69 | 2.40 | |
| including | 92.30 | 95.30 | 3.00 | 1.31 | 3.20 | |
| DD89-34* | 26.90 | 52.80 | 25.90 | 2.31 | 30.92 | North Zone – Cross-Section 2 |
| including | 31.70 | 34.70 | 3.00 | 1.58 | 11.29 | |
| including | 37.70 | 45.00 | 7.30 | 6.79 | 66.86 | |
| and | 95.20 | 98.20 | 3.00 | 2.52 | 0.35 |
Drill Hole Details
| Hole ID | Easting (NAD83 ZN9) | Northing (NAD83 ZN9) | Elevation (m) | Azimuth (o) | Dip (o) | EOH (m) |
| DD89-31* | 621729.2 | 6347840 | 1329.78 | 238 | -46 | 100 |
| DD89-32* | 621673.3 | 6347925 | 1295.5 | 250 | -45 | 139.6 |
| DD89-34* | 621554.9 | 6347804 | 1264 | 43 | -48 | 103 |
| DD89-35* | 621287 | 6347941 | 1278.73 | 212 | -47 | 254.8 |
| DD89-36* | 620938.4 | 6347872 | 1353 | 240 | -52 | 115.2 |
| DD89-39* | 620894.4 | 6347590 | 1268 | 90 | -48 | 93.9 |
| DD89-40* | 620843.4 | 6347587 | 1273 | 90 | -45 | 124.4 |
| DD89-45* | 620795.4 | 6347587 | 1278 | 84 | -43 | 179.2 |
| DD89-56* | 621001.4 | 6347702 | 1277 | 240 | -45 | 126.2 |
| DD89-57* | 621000.4 | 6347703 | 1278 | 276 | -45 | 124.4 |
| DD89-60* | 621570.4 | 6347788 | 1268 | 64 | -45 | 76.8 |
| DD89-61* | 621523.9 | 6347847 | 1259 | 58 | -42 | 75 |
| DD87-04 | 620994.8 | 6347763 | 1299.3 | 220 | -60 | 127.7 |
| DD87-21 | 621018.8 | 6347613 | 1255.64 | 240 | -45 | 136.9 |
| DD90-02* | 620699.4 | 6347798 | 1355.53 | 90 | -65 | 328.9 |
| DD90-06* | 620991.8 | 6347912 | 1352.83 | 240 | -60 | 314.9 |
| DD90-21* | 620721.3 | 6347794 | 1355.95 | 85 | -45 | 298.4 |
| DD91-08* | 621037.5 | 6347600 | 1266 | 240 | -45 | 96.34 |
* Note 1: drill holes with an asterisk denote that assay results are recorded from written reports and government filed assessment reports. Laboratory certificates in these examples have not been found in historical data search. Some records also show that samples were assayed at the Baker Mine Site Laboratory, where no individual assay certificates are recorded.
Qualified Person
The technical content of this news release has been reviewed and approved Andy Randell, PGeo., a qualified person as defined by National Instrument 43-101.
This news release includes historical drilling information that has been reviewed by the Company’s geological team. The Company’s review of the historical records and information reasonably substantiate the validity of the information presented in this news release; however, the Company cannot directly verify the accuracy of the historical data, including the procedures used for sample collection and analysis. Therefore, the Company encourages investors to exercise appropriate caution when evaluating these results.
About TDG Gold Corp.
TDG is a major mineral claim holder in the Toodoggone District of northern British Columbia, Canada, with over 23,000 hectares of brownfield and greenfield exploration opportunities under direct ownership or earn-in agreement. TDG’s key projects are the former producing, high-grade gold and silver Shasta and Baker Mines which are both road accessible, produced intermittently between 1979-2012, and have over 50,000 meters of historical drilling. In 2021, TDG proposes to advance the projects through compilation of historical data, new geological mapping, geochemical and geophysical surveys, and drill testing of the known mineralization occurrences and their extensions. TDG currently has 57,335,335 common shares issued and outstanding; at December 31st 2020, TDG is fully funded to complete our currently planned exploration programs.
ON BEHALF OF THE BOARD
Fletcher Morgan,
Chief Executive Officer
For further information:
Visit: www.tdggold.com
Telephone: +1.604.536.2711
Email: info@tdggold.com
Neither TSX Venture Exchange nor its Regulation Services Provider (as that term is defined in the policies of the TSX Venture Exchange) accepts responsibility for the adequacy or accuracy of this release.
This news release may contain certain “forward looking statements”. Forward-looking statements involve known and unknown risks, uncertainties, assumptions and other factors that may cause the actual results, performance or achievements of the Company to be materially different from any future results, performance or achievements expressed or implied by the forward-looking statements. Any forward-looking statement speaks only as of the date of this news release and, except as may be required by applicable securities laws, the Company disclaims any intent or obligation to update any forward-looking statement, whether as a result of new information, future events or results or otherwise.