Why use FCS Express for Flow and Image Cytometry data analysis?
All flow cytometry software packages include features for plotting, gating, and calculating basic statistics. When the team at De Novo Software observed researchers and scientists in both academic and commercial settings, it became obvious that the challenges they faced with data analysis were not in producing plots, gates, and statistics.
Instead, the real challenges were downstream activities of performing advanced calculations, advanced statistics, graphing, presenting, and reporting results.
Learn about the FCS Express difference with our short overview video
Already using FlowJo? See why you should switch today.
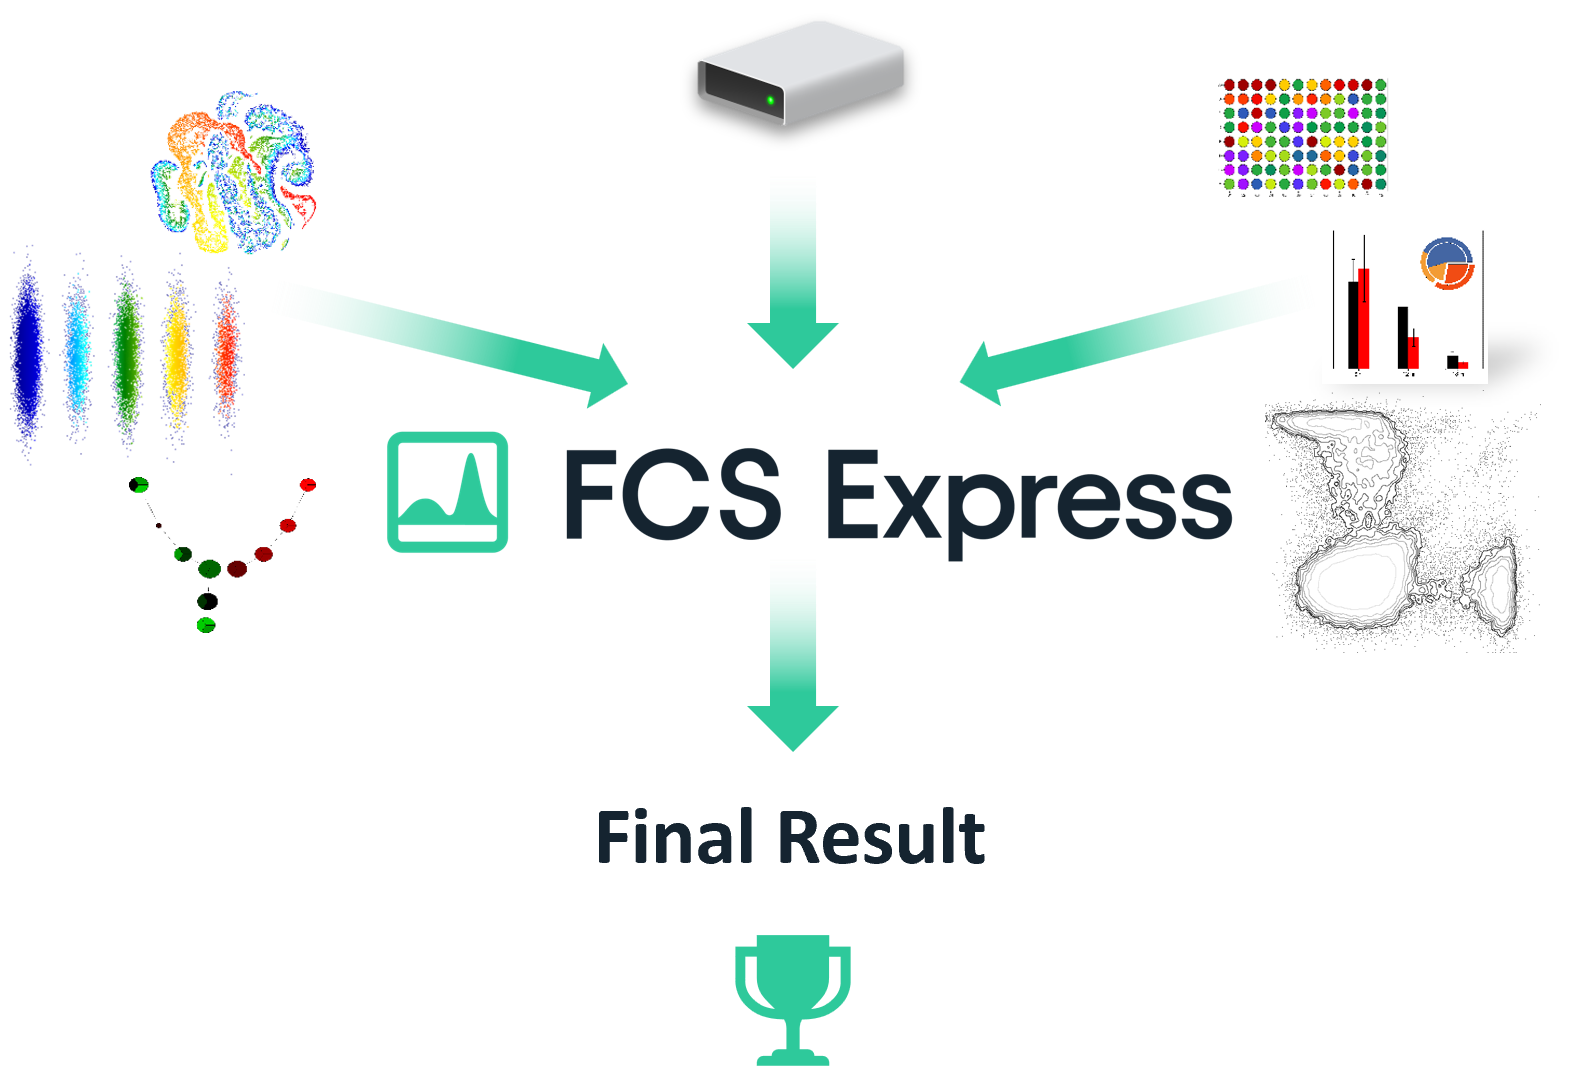
The FCS Express Difference
Other Flow Cytometry Software simply produces basic plots and statistics
With other software packages you only get basic plots and statistics which requires you to copy and paste to external software packages to create a final result. In some cases you may be using multiple external tools to generate spreadsheets, graphs, PowerPoint* presentations, figures for publication, and R† scripts before you arrive at a final result.

FCS Express is a fully integrated analysis, statistics, graphing and reporting tool for GETTING RESULTS
With FCS Express analysis IS YOUR FINAL RESULT!
FCS Express utilizes integrated spreadsheets so your graphs and statistics update as your gates change. All graphics are directly exported to PowerPoint in high resolution and you can even choose to export individual graphics at up to 700 DPI for the ultimate ease in moving from analysis to publication ready result.
If you are not using FCS Express stop and ask yourself how much time do you spend:

Copy and pasting from your data analysis software to Excel*, Prism‡, and other spreadsheet or graphing tools?
Have you ever created a chart in Excel and then needed to slightly move a gate resulting in an entire copy and paste of the flow cytometry data sets back to Excel?
Tweaking the formatting of flow cytometry graphs, plots, and axis to make them presentation ready?
Have you ever had to put a white text box over an axis label to simply present a graph?
Fighting with low resolution graphics just to achieve the requirements of your publisher?
Have you ever had to use multiple graphic editing tools just to arrive at a publication ready figure?
Experience the Difference and Get Results Today

Academic/Corporate R&D
Go from raw cytometry data to clearly communicated answers quickly, confidently, and easily
Individual researchers, shared resources facilities, and R&D start here!

Clinical and Diagnostic
See why FCS Express is the most widely used flow cytometry data analysis software among clinical labs
Clinical Diagnostic and Clinical Reference Labs start here!

Validated Research
Discover the best of FCS Express RUO with advanced features for regulated, enterprise environments.
*PowerPoint and Excel are trademarks of Microsoft Corporation | †R is a trademark of the R Foundation | ‡Prism is a trademark of GraphPad Software, Inc. | FlowJo is a trademark of Flowjo, LLC