
Analysts’ Viewpoint on Conventional and Rapid Prototyping Market Scenario
Prototyping plays a vital role in converting a virtual model into physical output. It is the final and important aspect in the product development process. Prototyping allows for design testing and evaluation; and identification and elimination of potential issues before mass manufacture. It highlights any challenges with the initial design, associated mechanisms or electronics, functionality, and manufacturing process. The conventional and rapid prototyping market is projected to grow at a significant CAGR of 14.4% during the forecast period. Industry leaders are engaged in providing innovative product prototyping services in order to gain competitive edge. CNC machining has been widely used for prototyping for several decades; however, additive manufacturing (3D printing) is gaining traction. It is being used by numerous small- and medium-sized enterprises. Key technologies such as FDM, SLS and MJF are also being extensively deployed in SME enterprises.
Product prototyping is used to rapidly produce physical part of the product directly from its CAD model, using subtractive and additive manufacturing methods. It can be used for any product development cycle for components or sub-components. Product prototype and design testing is an integral part of new product development. Product prototyping is widely adopted for visual prototyping, concept modeling, functional prototyping, pre-production prototyping, and production tool prototyping. It offers several benefits such as reduction in design & development time, decrease in overall product development cost, and elimination or reduction of risk. It enables functionality testing at low cost, and improves and increases user involvement during design stages of product development.
Request a sample to get extensive insights into the Conventional and Rapid Prototyping Market
High volume of production and geometrical complexity of components are hampering the usage of traditional prototyping methods. Hence, customers are compelled to adopt processes and instruments that drive the final cost of the element being manufactured. Additive manufacturing techniques offer significant competitive advantages; they adapt to the geometrical complexity and bespoke design of the part that is to be created. Elegant geometrical forms, hollow interiors, internal channels, varied thicknesses, and irregular shapes can be manufactured accurately by 3D printing technologies using a geometrical template created from a 3D CAD. Products that are exactly the same or completely different can be obtained without affecting the process or incurring additional expenditure. This customization is one of the most important current developments in the production of high-value products.
Additive prototyping also offers various benefits that include light weight products, multilateral products, ergonomic products, efficient and short production runs, and fewer assembly errors. Several key players are launching innovative 3D printing services to gain competitive edge. In January 2020, Zortrax launched 3D printing service to expand the company’s entire product portfolio. The service includes prototyping, tooling, or end-use product application. The company aims to expand its printing capability in order to cater to a wide range of applications, from dental and jewelry products to electronic housings and automotive parts.
Surgical fasteners, scalpels, retractors, and display systems are some of the medical devices that have been upgraded with the use of 3D technology. Prototyping technology is employed in the manufacture of medical equipment in addition to the design of these devices. Additive technologies are suitable for devices that need to be customized for a specific patient. Stereolithography or selective laser sintering is used to design a majority of hearing aids. Replacement of teeth is another area where rapid prototyping service is used.
Rapid prototyping materials are used in prosthetics. Prostheses are also custom-made for patients. Rapid prototyping materials are used to create models of complex organs in the body. Surgeons employ these models to acquire a realistic sense of structures before performing a surgical procedure. Stereolithography is a widely utilized technology for this application. The model's most trustworthy features, such as transparency and color resin developments, enable a clear distinction between tumors and any other external growth in the body. In August 2021, Trelleborg Group announced the launch of its Healthcare & Medical Rapid Development Center for design, rapid prototyping, development, and serial production. It ensures cost control and scalability of customers’ solutions. This Rapid Development Center has been built to accelerate time to market, reduce the production cost of parts that are already in the market, and enhance the transition from design to serial production of products.
Rapid prototyping is also employed in tissue engineering and manufacture of biologically active implants. Selective laser sintering of ceramics is used in this application. This is boosting the adoption of conventional and rapid prototyping in the medical sector.
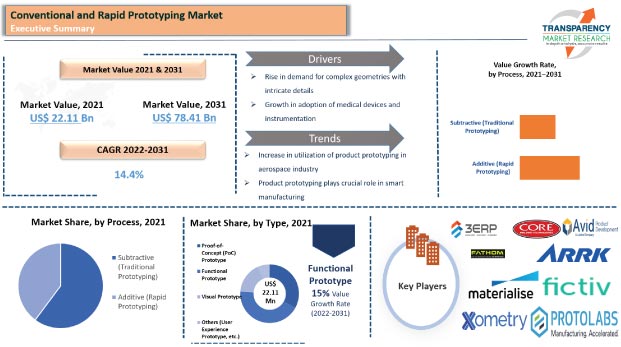
In terms of process, the global conventional and rapid prototyping market has been bifurcated into subtractive (traditional prototyping) and additive (rapid prototyping). The subtractive (traditional prototyping) segment held major share of 60.21% of the market in 2021. It is projected to grow at a CAGR of 14.1% during the forecast period.
The CNC machining sub-segment of the subtractive segment accounted for prominent share of 62.18% in 2021. Subtractive prototyping yields higher structural integrity, which is important if the prototype is to be used in product testing.
In terms of type, the global conventional and rapid prototyping market has been classified into proof-of-concept (PoC) prototype, functional prototype, visual prototype, and others. The functional prototype segment dominated the global conventional and rapid prototyping market with 43.18% share in 2021. Furthermore, the segment is expected to grow at a CAGR of 15% during the forecast period. Functional prototype is usually a subsystem of a product and enables the testing of functional aspects. Functional prototypes offer a new way for design engineers to test designs before manufacturing them on a large scale. Creating functional or quick visual prototypes is an essential step of the development process. The making of a functional and working prototype is an essential part of any product development. It is integral to the process of testing, trials, pitching, and market research for many companies.
North America dominated the global conventional and rapid prototyping market with 34.36% share in 2021. The market in the region is estimated to grow at a CAGR of 15.1% during the forecast period. Rise in expenditure on lifecycle stage and research and development, particularly in the U.S. and Canada, is primarily driving the market in North America.
Asia Pacific and Europe are also key regions of the global conventional and rapid prototyping market. These regions held value share of 30.27% and 25.80%, respectively, in 2021. Automotive, healthcare, and consumer goods & electronics industries in Asia Pacific and Europe are witnessing a surge in demand for conventional and rapid prototyping.
Middle East & Africa is a larger market for conventional and rapid prototyping than South America. The market in Middle East & Africa is projected to grow at a CAGR of 12.2% during the forecast period.
The global conventional and rapid prototyping market is highly fragmented, with a large number of large-scale and small scale vendors controlling a majority of the share. Most of the firms are investing significantly in comprehensive research and development activities. Expansion of product portfolios and mergers and acquisitions are major strategies adopted by key players. ARRK North America, Inc., Avid Product Development, LLC, CADX Tools & Technologies Pvt. Ltd., Core Molding Technologies, Inc., Fathom Digital Manufacturing Corporation, Fictiv, IMAGE MODEL Company Limited, Materialise NV, Model Solution Co., Ltd., Proto Labs, Inc., ProtoCAM, Renishaw plc, Sandvik AB, Star Rapid., Ltd, Xometry Europe GmbH, and Quickparts are the prominent entities operating in the market.
Request a custom report on Conventional and Rapid Prototyping Market
Each of these players has been profiled in the conventional and rapid prototyping market report based on parameters such as company overview, financial overview, business strategies, product portfolio, business segments, and recent developments
|
Attribute |
Detail |
|
Market Size Value in 2021 |
US$ 22.11 Bn |
|
Market Forecast Value in 2031 |
US$ 78.41 Bn |
|
Growth Rate (CAGR) |
14.4% |
|
Forecast Period |
2022–2031 |
|
Historical Data Available for |
2017–2020 |
|
Quantitative Units |
US$ Bn for Value |
|
Market Analysis |
It includes cross segment analysis at global as well as regional level. Furthermore, qualitative analysis includes drivers, restraints, opportunities, key trends, Porter’s Five Forces analysis, value chain analysis, and key trend analysis. |
|
Competition Landscape |
|
|
Format |
Electronic (PDF) + Excel |
|
Market Segmentation |
|
|
Regions Covered |
|
|
Countries Covered |
|
|
Companies Profiled |
|
|
Customization Scope |
Available upon request |
|
Pricing |
Available upon request |
The conventional and rapid prototyping market stood at US$ 22.11 Bn in 2021.
The conventional and rapid prototyping market is estimated to grow at a CAGR of 14.4% during the forecast period.
The conventional and rapid prototyping market is expected to reach US$ 78.41 Bn by 2031.
Prominent players operating in the conventional and rapid prototyping market are ARRK North America, Inc., Avench Systems INC, Avid Product Development, LLC, CADX TOOLS & TECHNOLOGIES PVT LTD., Model Solution Co., Ltd., Star Rapid., Ltd., Protolabs, and ProtoCAM.
The U.S. accounted for around 27% share of the global conventional and rapid prototyping market in 2021.
In terms of revenue, the subtractive (traditional prototyping) segment dominated the market with 60.2% share in 2021.
Rise in utilization of conventional and rapid prototyping in the aerospace industry and growth in adoption of conventional and rapid prototyping for medical implants are the prominent trends in the market.
North America is a highly lucrative region of the global conventional and rapid prototyping market.
1. Preface
1.1. Market Introduction
1.2. Market and Segments Definition
1.3. Market Taxonomy
1.4. Research Methodology
1.5. Assumption and Acronyms
2. Executive Summary
2.1. Global Conventional and Rapid Prototyping Market Overview
2.2. Regional Outline
2.3. Market Dynamics Snapshot
2.4. Competition Blueprint
3. Market Dynamics
3.1. Macro-economic Factors
3.2. Drivers
3.3. Restraints
3.4. Opportunities
3.5. Key Trends
4. Associated Industry and Key Indicator Assessment
4.1. Parent Industry Overview - Manufacturing Industry Overview
4.2. Supply Chain Analysis
4.3. Technology Roadmap Analysis
4.4. Industry SWOT Analysis
4.5. Porter Five Forces Analysis
4.6. Covid-19 Impact and Recovery Analysis
5. Conventional and Rapid Prototyping Market Analysis, by Process
5.1. Conventional and Rapid Prototyping Market Value (US$ Bn) Analysis & Forecast, by Process, 2017–2031
5.1.1. Subtractive (Traditional Prototyping)
5.1.1.1. CNC Machining
5.1.1.2. Injection Molding
5.1.2. Additive (Rapid Prototyping)
5.1.2.1. Stereolithography (SLA)
5.1.2.2. Selective Laser Sintering (SLS)
5.1.2.3. Fused Deposition Modeling (FDM)
5.1.2.4. Multi Jet Fusion
5.1.2.5. Others (DLP, EBM, etc.)
5.2. Market Attractiveness Analysis, by Process
6. Conventional and Rapid Prototyping Market Analysis, by Type
6.1. Conventional and Rapid Prototyping Market Value (US$ Bn) Analysis & Forecast, by Type, 2017–2031
6.1.1. Proof-of-Concept (PoC) Prototype
6.1.2. Functional Prototype
6.1.3. Visual Prototype
6.1.4. Others (User Experience Prototype, etc.)
6.2. Market Attractiveness Analysis, by Type
7. Conventional and Rapid Prototyping Market Analysis, by Material
7.1. Conventional and Rapid Prototyping Market Value (US$ Bn) Analysis & Forecast, by Material, 2017–2031
7.1.1. Metal
7.1.2. Polymer
7.1.3. Ceramic
7.1.4. Others (Plaster and Starch, Foundry Sand Parts, etc.)
7.2. Market Attractiveness Analysis, by Material
8. Conventional and Rapid Prototyping Market Analysis, by End-use Industry
8.1. Conventional and Rapid Prototyping Market Value (US$ Bn) Analysis & Forecast, by End-use Industry, 2017–2031
8.1.1. Aerospace & Defense
8.1.2. Consumer Goods & Electronics
8.1.3. Automotive
8.1.4. Healthcare
8.1.5. Others (Film and Animation, Architecture, etc.)
8.2. Market Attractiveness Analysis, by End-use Industry
9. Conventional and Rapid Prototyping Market Analysis and Forecast, by Region
9.1. Conventional and Rapid Prototyping Market Value (US$ Bn) Analysis & Forecast, by Region, 2017–2031
9.1.1. North America
9.1.2. Europe
9.1.3. Asia Pacific
9.1.4. Middle East & Africa
9.1.5. South America
9.2. Market Attractiveness Analysis, by Region
10. North America Conventional and Rapid Prototyping Market Analysis and Forecast
10.1. Market Snapshot
10.2. Drivers and Restraints: Impact Analysis
10.3. Conventional and Rapid Prototyping Market Value (US$ Bn) Analysis & Forecast, by Process, 2017–2031
10.3.1. Subtractive (Traditional Prototyping)
10.3.1.1. CNC Machining
10.3.1.2. Injection Molding
10.3.2. Additive (Rapid Prototyping)
10.3.2.1. Stereolithography (SLA)
10.3.2.2. Selective Laser Sintering (SLS)
10.3.2.3. Fused Deposition Modeling (FDM)
10.3.2.4. Multi Jet Fusion
10.3.2.5. Others (DLP, EBM, etc.)
10.4. Conventional and Rapid Prototyping Market Value (US$ Bn) Analysis & Forecast, by Type, 2017–2031
10.4.1. Proof-of-Concept (PoC) Prototype
10.4.2. Functional Prototype
10.4.3. Visual Prototype
10.4.4. Others (User Experience Prototype, etc.)
10.5. Conventional and Rapid Prototyping Market Value (US$ Bn) Analysis & Forecast, by Material, 2017–2031
10.5.1. Metal
10.5.2. Polymer
10.5.3. Ceramic
10.5.4. Others (Plaster and Starch, Foundry Sand Parts, etc.)
10.6. Conventional and Rapid Prototyping Market Value (US$ Bn) Analysis & Forecast, by End-use Industry, 2017–2031
10.6.1. Aerospace & Defense
10.6.2. Consumer Goods & Electronics
10.6.3. Automotive
10.6.4. Healthcare
10.6.5. Others (Film and Animation, Architecture, etc.)
10.7. Conventional and Rapid Prototyping Market Value (US$ Bn) Analysis & Forecast, by Country and Sub-region, 2017–2031
10.7.1. U.S.
10.7.2. Canada
10.7.3. Rest of North America
10.8. Market Attractiveness Analysis
10.8.1. By Process
10.8.2. By Type
10.8.3. By Material
10.8.4. By End-use Industry
10.8.5. By Country and Sub-region
11. U.S. Conventional and Rapid Prototyping Market Analysis and Forecast
11.1. Market Snapshot
11.2. Conventional and Rapid Prototyping Market Value (US$ Bn) Analysis & Forecast, by Process, 2017–2031
11.2.1. Subtractive (Traditional Prototyping)
11.2.1.1. CNC Machining
11.2.1.2. Injection Molding
11.2.2. Additive (Rapid Prototyping)
11.2.2.1. Stereolithography (SLA)
11.2.2.2. Selective Laser Sintering (SLS)
11.2.2.3. Fused Deposition Modeling (FDM)
11.2.2.4. Multi Jet Fusion
11.2.2.5. Others (DLP, EBM, etc.)
11.3. Conventional and Rapid Prototyping Market Value (US$ Bn) Analysis & Forecast, by Type, 2017–2031
11.3.1. Proof-of-Concept (PoC) Prototype
11.3.2. Functional Prototype
11.3.3. Visual Prototype
11.3.4. Others (User Experience Prototype, etc.)
11.4. Conventional and Rapid Prototyping Market Value (US$ Bn) Analysis & Forecast, by Material, 2017–2031
11.4.1. Metal
11.4.2. Polymer
11.4.3. Ceramic
11.4.4. Others (Plaster and Starch, Foundry Sand Parts, etc.)
11.5. Conventional and Rapid Prototyping Market Value (US$ Bn) Analysis & Forecast, by End-use Industry, 2017–2031
11.5.1. Aerospace & Defense
11.5.2. Consumer Goods & Electronics
11.5.3. Automotive
11.5.4. Healthcare
11.5.5. Others (Film and Animation, Architecture, etc.)
11.6. Market Attractiveness Analysis
11.6.1. By Process
11.6.2. By Type
11.6.3. By Material
11.6.4. By End-use Industry
12. Canada Conventional and Rapid Prototyping Market Analysis and Forecast
12.1. Market Snapshot
12.2. Conventional and Rapid Prototyping Market Value (US$ Bn) Analysis & Forecast, by Process, 2017–2031
12.2.1. Subtractive (Traditional Prototyping)
12.2.1.1. CNC Machining
12.2.1.2. Injection Molding
12.2.2. Additive (Rapid Prototyping)
12.2.2.1. Stereolithography (SLA)
12.2.2.2. Selective Laser Sintering (SLS)
12.2.2.3. Fused Deposition Modeling (FDM)
12.2.2.4. Multi Jet Fusion
12.2.2.5. Others (DLP, EBM, etc.)
12.3. Conventional and Rapid Prototyping Market Value (US$ Bn) Analysis & Forecast, by Type, 2017–2031
12.3.1. Proof-of-Concept (PoC) Prototype
12.3.2. Functional Prototype
12.3.3. Visual Prototype
12.3.4. Others (User Experience Prototype, etc.)
12.4. Conventional and Rapid Prototyping Market Value (US$ Bn) Analysis & Forecast, by Material, 2017–2031
12.4.1. Metal
12.4.2. Polymer
12.4.3. Ceramic
12.4.4. Others (Plaster and Starch, Foundry Sand Parts, etc.)
12.5. Conventional and Rapid Prototyping Market Value (US$ Bn) Analysis & Forecast, by End-use Industry, 2017–2031
12.5.1. Aerospace & Defense
12.5.2. Consumer Goods & Electronics
12.5.3. Automotive
12.5.4. Healthcare
12.5.5. Others (Film and Animation, Architecture, etc.)
12.6. Market Attractiveness Analysis
12.6.1. By Process
12.6.2. By Type
12.6.3. By Material
12.6.4. By End-use Industry
13. Europe Conventional and Rapid Prototyping Market Analysis and Forecast
13.1. Market Snapshot
13.2. Drivers and Restraints: Impact Analysis
13.3. Conventional and Rapid Prototyping Market Value (US$ Bn) Analysis & Forecast, by Process, 2017–2031
13.3.1. Subtractive (Traditional Prototyping)
13.3.1.1. CNC Machining
13.3.1.2. Injection Molding
13.3.2. Additive (Rapid Prototyping)
13.3.2.1. Stereolithography (SLA)
13.3.2.2. Selective Laser Sintering (SLS)
13.3.2.3. Fused Deposition Modeling (FDM)
13.3.2.4. Multi Jet Fusion
13.3.2.5. Others (DLP, EBM, etc.)
13.4. Conventional and Rapid Prototyping Market Value (US$ Bn) Analysis & Forecast, by Type, 2017–2031
13.4.1. Proof-of-Concept (PoC) Prototype
13.4.2. Functional Prototype
13.4.3. Visual Prototype
13.4.4. Others (User Experience Prototype, etc.)
13.5. Conventional and Rapid Prototyping Market Value (US$ Bn) Analysis & Forecast, by Material, 2017–2031
13.5.1. Metal
13.5.2. Polymer
13.5.3. Ceramic
13.5.4. Others (Plaster and Starch, Foundry Sand Parts, etc.)
13.6. Conventional and Rapid Prototyping Market Value (US$ Bn) Analysis & Forecast, by End-use Industry, 2017–2031
13.6.1. Aerospace & Defense
13.6.2. Consumer Goods & Electronics
13.6.3. Automotive
13.6.4. Healthcare
13.6.5. Others (Film and Animation, Architecture, etc.)
13.7. Conventional and Rapid Prototyping Market Value (US$ Bn) Analysis & Forecast, by Country and Sub-region, 2017–2031
13.7.1. U.K.
13.7.2. Germany
13.7.3. France
13.7.4. Rest of Europe
13.8. Market Attractiveness Analysis
13.8.1. By Process
13.8.2. By Type
13.8.3. By Material
13.8.4. By End-use Industry
13.8.5. By Country and Sub-region
14. U.K. Conventional and Rapid Prototyping Market Analysis and Forecast
14.1. Market Snapshot
14.2. Conventional and Rapid Prototyping Market Value (US$ Bn) Analysis & Forecast, by Process, 2017–2031
14.2.1. Subtractive (Traditional Prototyping)
14.2.1.1. CNC Machining
14.2.1.2. Injection Molding
14.2.2. Additive (Rapid Prototyping)
14.2.2.1. Stereolithography (SLA)
14.2.2.2. Selective Laser Sintering (SLS)
14.2.2.3. Fused Deposition Modeling (FDM)
14.2.2.4. Multi Jet Fusion
14.2.2.5. Others (DLP, EBM, etc.)
14.3. Conventional and Rapid Prototyping Market Value (US$ Bn) Analysis & Forecast, by Type, 2017–2031
14.3.1. Proof-of-Concept (PoC) Prototype
14.3.2. Functional Prototype
14.3.3. Visual Prototype
14.3.4. Others (User Experience Prototype, etc.)
14.4. Conventional and Rapid Prototyping Market Value (US$ Bn) Analysis & Forecast, by Material, 2017–2031
14.4.1. Metal
14.4.2. Polymer
14.4.3. Ceramic
14.4.4. Others (Plaster and Starch, Foundry Sand Parts, etc.)
14.5. Conventional and Rapid Prototyping Market Value (US$ Bn) Analysis & Forecast, by End-use Industry, 2017–2031
14.5.1. Aerospace & Defense
14.5.2. Consumer Goods & Electronics
14.5.3. Automotive
14.5.4. Healthcare
14.5.5. Others (Film and Animation, Architecture, etc.)
14.6. Market Attractiveness Analysis
14.6.1. By Process
14.6.2. By Type
14.6.3. By Material
14.6.4. By End-use Industry
15. Germany Conventional and Rapid Prototyping Market Analysis and Forecast
15.1. Market Snapshot
15.2. Conventional and Rapid Prototyping Market Value (US$ Bn) Analysis & Forecast, by Process, 2017–2031
15.2.1. Subtractive (Traditional Prototyping)
15.2.1.1. CNC Machining
15.2.1.2. Injection Molding
15.2.2. Additive (Rapid Prototyping)
15.2.2.1. Stereolithography (SLA)
15.2.2.2. Selective Laser Sintering (SLS)
15.2.2.3. Fused Deposition Modeling (FDM)
15.2.2.4. Multi Jet Fusion
15.2.2.5. Others (DLP, EBM, etc.)
15.3. Conventional and Rapid Prototyping Market Value (US$ Bn) Analysis & Forecast, by Type, 2017–2031
15.3.1. Proof-of-Concept (PoC) Prototype
15.3.2. Functional Prototype
15.3.3. Visual Prototype
15.3.4. Others (User Experience Prototype, etc.)
15.4. Conventional and Rapid Prototyping Market Value (US$ Bn) Analysis & Forecast, by Material, 2017–2031
15.4.1. Metal
15.4.2. Polymer
15.4.3. Ceramic
15.4.4. Others (Plaster and Starch, Foundry Sand Parts, etc.)
15.5. Conventional and Rapid Prototyping Market Value (US$ Bn) Analysis & Forecast, by End-use Industry, 2017–2031
15.5.1. Aerospace & Defense
15.5.2. Consumer Goods & Electronics
15.5.3. Automotive
15.5.4. Healthcare
15.5.5. Others (Film and Animation, Architecture, etc.)
15.6. Market Attractiveness Analysis
15.6.1. By Process
15.6.2. By Type
15.6.3. By Material
15.6.4. By End-use Industry
16. France Conventional and Rapid Prototyping Market Analysis and Forecast
16.1. Market Snapshot
16.2. Conventional and Rapid Prototyping Market Value (US$ Bn) Analysis & Forecast, by Process, 2017–2031
16.2.1. Subtractive (Traditional Prototyping)
16.2.1.1. CNC Machining
16.2.1.2. Injection Molding
16.2.2. Additive (Rapid Prototyping)
16.2.2.1. Stereolithography (SLA)
16.2.2.2. Selective Laser Sintering (SLS)
16.2.2.3. Fused Deposition Modeling (FDM)
16.2.2.4. Multi Jet Fusion
16.2.2.5. Others (DLP, EBM, etc.)
16.3. Conventional and Rapid Prototyping Market Value (US$ Bn) Analysis & Forecast, by Type, 2017–2031
16.3.1. Proof-of-Concept (PoC) Prototype
16.3.2. Functional Prototype
16.3.3. Visual Prototype
16.3.4. Others (User Experience Prototype, etc.)
16.4. Conventional and Rapid Prototyping Market Value (US$ Bn) Analysis & Forecast, by Material, 2017–2031
16.4.1. Metal
16.4.2. Polymer
16.4.3. Ceramic
16.4.4. Others (Plaster and Starch, Foundry Sand Parts, etc.)
16.5. Conventional and Rapid Prototyping Market Value (US$ Bn) Analysis & Forecast, by End-use Industry, 2017–2031
16.5.1. Aerospace & Defense
16.5.2. Consumer Goods & Electronics
16.5.3. Automotive
16.5.4. Healthcare
16.5.5. Others (Film and Animation, Architecture, etc.)
16.6. Market Attractiveness Analysis
16.6.1. By Process
16.6.2. By Type
16.6.3. By Material
16.6.4. By End-use Industry
17. Asia Pacific Conventional and Rapid Prototyping Market Analysis and Forecast
17.1. Market Snapshot
17.2. Drivers and Restraints: Impact Analysis
17.3. Conventional and Rapid Prototyping Market Value (US$ Bn) Analysis & Forecast, by Process, 2017–2031
17.3.1. Subtractive (Traditional Prototyping)
17.3.1.1. CNC Machining
17.3.1.2. Injection Molding
17.3.2. Additive (Rapid Prototyping)
17.3.2.1. Stereolithography (SLA)
17.3.2.2. Selective Laser Sintering (SLS)
17.3.2.3. Fused Deposition Modeling (FDM)
17.3.2.4. Multi Jet Fusion
17.3.2.5. Others (DLP, EBM, etc.)
17.4. Conventional and Rapid Prototyping Market Value (US$ Bn) Analysis & Forecast, by Type, 2017–2031
17.4.1. Proof-of-Concept (PoC) Prototype
17.4.2. Functional Prototype
17.4.3. Visual Prototype
17.4.4. Others (User Experience Prototype, etc.)
17.5. Conventional and Rapid Prototyping Market Value (US$ Bn) Analysis & Forecast, by Material, 2017–2031
17.5.1. Metal
17.5.2. Polymer
17.5.3. Ceramic
17.5.4. Others (Plaster and Starch, Foundry Sand Parts, etc.)
17.6. Conventional and Rapid Prototyping Market Value (US$ Bn) Analysis & Forecast, by End-use Industry, 2017–2031
17.6.1. Aerospace & Defense
17.6.2. Consumer Goods & Electronics
17.6.3. Automotive
17.6.4. Healthcare
17.6.5. Others (Film and Animation, Architecture, etc.)
17.7. Conventional and Rapid Prototyping Market Value (US$ Bn) Analysis & Forecast, by Country and Sub-region, 2017–2031
17.7.1. China
17.7.2. Japan
17.7.3. South Korea
17.7.4. India
17.7.5. ASEAN
17.7.6. Rest of Asia Pacific
17.8. Market Attractiveness Analysis
17.8.1. By Process
17.8.2. By Type
17.8.3. By Material
17.8.4. By End-use Industry
17.8.5. By Country and Sub-region
18. China Conventional and Rapid Prototyping Market Analysis and Forecast
18.1. Market Snapshot
18.2. Conventional and Rapid Prototyping Market Value (US$ Bn) Analysis & Forecast, by Process, 2017–2031
18.2.1. Subtractive (Traditional Prototyping)
18.2.1.1. CNC Machining
18.2.1.2. Injection Molding
18.2.2. Additive (Rapid Prototyping)
18.2.2.1. Stereolithography (SLA)
18.2.2.2. Selective Laser Sintering (SLS)
18.2.2.3. Fused Deposition Modeling (FDM)
18.2.2.4. Multi Jet Fusion
18.2.2.5. Others (DLP, EBM, etc.)
18.3. Conventional and Rapid Prototyping Market Value (US$ Bn) Analysis & Forecast, by Type, 2017–2031
18.3.1. Proof-of-Concept (PoC) Prototype
18.3.2. Functional Prototype
18.3.3. Visual Prototype
18.3.4. Others (User Experience Prototype, etc.)
18.4. Conventional and Rapid Prototyping Market Value (US$ Bn) Analysis & Forecast, by Material, 2017–2031
18.4.1. Metal
18.4.2. Polymer
18.4.3. Ceramic
18.4.4. Others (Plaster and Starch, Foundry Sand Parts, etc.)
18.5. Conventional and Rapid Prototyping Market Value (US$ Bn) Analysis & Forecast, by End-use Industry, 2017–2031
18.5.1. Aerospace & Defense
18.5.2. Consumer Goods & Electronics
18.5.3. Automotive
18.5.4. Healthcare
18.5.5. Others (Film and Animation, Architecture, etc.)
18.6. Market Attractiveness Analysis
18.6.1. By Process
18.6.2. By Type
18.6.3. By Material
18.6.4. By End-use Industry
19. Japan Conventional and Rapid Prototyping Market Analysis and Forecast
19.1. Market Snapshot
19.2. Conventional and Rapid Prototyping Market Value (US$ Bn) Analysis & Forecast, by Process, 2017–2031
19.2.1. Subtractive (Traditional Prototyping)
19.2.1.1. CNC Machining
19.2.1.2. Injection Molding
19.2.2. Additive (Rapid Prototyping)
19.2.2.1. Stereolithography (SLA)
19.2.2.2. Selective Laser Sintering (SLS)
19.2.2.3. Fused Deposition Modeling (FDM)
19.2.2.4. Multi Jet Fusion
19.2.2.5. Others (DLP, EBM, etc.)
19.3. Conventional and Rapid Prototyping Market Value (US$ Bn) Analysis & Forecast, by Type, 2017–2031
19.3.1. Proof-of-Concept (PoC) Prototype
19.3.2. Functional Prototype
19.3.3. Visual Prototype
19.3.4. Others (User Experience Prototype, etc.)
19.4. Conventional and Rapid Prototyping Market Value (US$ Bn) Analysis & Forecast, by Material, 2017–2031
19.4.1. Metal
19.4.2. Polymer
19.4.3. Ceramic
19.4.4. Others (Plaster and Starch, Foundry Sand Parts, etc.)
19.5. Conventional and Rapid Prototyping Market Value (US$ Bn) Analysis & Forecast, by End-use Industry, 2017–2031
19.5.1. Aerospace & Defense
19.5.2. Consumer Goods & Electronics
19.5.3. Automotive
19.5.4. Healthcare
19.5.5. Others (Film and Animation, Architecture, etc.)
19.6. Market Attractiveness Analysis
19.6.1. By Process
19.6.2. By Type
19.6.3. By Material
19.6.4. By End-use Industry
20. India Conventional and Rapid Prototyping Market Analysis and Forecast
20.1. Market Snapshot
20.2. Conventional and Rapid Prototyping Market Value (US$ Bn) Analysis & Forecast, by Process, 2017–2031
20.2.1. Subtractive (Traditional Prototyping)
20.2.1.1. CNC Machining
20.2.1.2. Injection Molding
20.2.2. Additive (Rapid Prototyping)
20.2.2.1. Stereolithography (SLA)
20.2.2.2. Selective Laser Sintering (SLS)
20.2.2.3. Fused Deposition Modeling (FDM)
20.2.2.4. Multi Jet Fusion
20.2.2.5. Others (DLP, EBM, etc.)
20.3. Conventional and Rapid Prototyping Market Value (US$ Bn) Analysis & Forecast, by Type, 2017–2031
20.3.1. Proof-of-Concept (PoC) Prototype
20.3.2. Functional Prototype
20.3.3. Visual Prototype
20.3.4. Others (User Experience Prototype, etc.)
20.4. Conventional and Rapid Prototyping Market Value (US$ Bn) Analysis & Forecast, by Material, 2017–2031
20.4.1. Metal
20.4.2. Polymer
20.4.3. Ceramic
20.4.4. Others (Plaster and Starch, Foundry Sand Parts, etc.)
20.5. Conventional and Rapid Prototyping Market Value (US$ Bn) Analysis & Forecast, by End-use Industry, 2017–2031
20.5.1. Aerospace & Defense
20.5.2. Consumer Goods & Electronics
20.5.3. Automotive
20.5.4. Healthcare
20.5.5. Others (Film and Animation, Architecture, etc.)
20.6. Market Attractiveness Analysis
20.6.1. By Process
20.6.2. By Type
20.6.3. By Material
20.6.4. By End-use Industry
21. South Korea Conventional and Rapid Prototyping Market Analysis and Forecast
21.1. Market Snapshot
21.2. Conventional and Rapid Prototyping Market Value (US$ Bn) Analysis & Forecast, by Process, 2017–2031
21.2.1. Subtractive (Traditional Prototyping)
21.2.1.1. CNC Machining
21.2.1.2. Injection Molding
21.2.2. Additive (Rapid Prototyping)
21.2.2.1. Stereolithography (SLA)
21.2.2.2. Selective Laser Sintering (SLS)
21.2.2.3. Fused Deposition Modeling (FDM)
21.2.2.4. Multi Jet Fusion
21.2.2.5. Others (DLP, EBM, etc.)
21.3. Conventional and Rapid Prototyping Market Value (US$ Bn) Analysis & Forecast, by Type, 2017–2031
21.3.1. Proof-of-Concept (PoC) Prototype
21.3.2. Functional Prototype
21.3.3. Visual Prototype
21.3.4. Others (User Experience Prototype, etc.)
21.4. Conventional and Rapid Prototyping Market Value (US$ Bn) Analysis & Forecast, by Material, 2017–2031
21.4.1. Metal
21.4.2. Polymer
21.4.3. Ceramic
21.4.4. Others (Plaster and Starch, Foundry Sand Parts, etc.)
21.5. Conventional and Rapid Prototyping Market Value (US$ Bn) Analysis & Forecast, by End-use Industry, 2017–2031
21.5.1. Aerospace & Defense
21.5.2. Consumer Goods & Electronics
21.5.3. Automotive
21.5.4. Healthcare
21.5.5. Others (Film and Animation, Architecture, etc.)
21.6. Market Attractiveness Analysis
21.6.1. By Process
21.6.2. By Type
21.6.3. By Material
21.6.4. By End-use Industry
22. ASEAN Conventional and Rapid Prototyping Market Analysis and Forecast
22.1. Market Snapshot
22.2. Conventional and Rapid Prototyping Market Value (US$ Bn) Analysis & Forecast, by Process, 2017–2031
22.2.1. Subtractive (Traditional Prototyping)
22.2.1.1. CNC Machining
22.2.1.2. Injection Molding
22.2.2. Additive (Rapid Prototyping)
22.2.2.1. Stereolithography (SLA)
22.2.2.2. Selective Laser Sintering (SLS)
22.2.2.3. Fused Deposition Modeling (FDM)
22.2.2.4. Multi Jet Fusion
22.2.2.5. Others (DLP, EBM, etc.)
22.3. Conventional and Rapid Prototyping Market Value (US$ Bn) Analysis & Forecast, by Type, 2017–2031
22.3.1. Proof-of-Concept (PoC) Prototype
22.3.2. Functional Prototype
22.3.3. Visual Prototype
22.3.4. Others (User Experience Prototype, etc.)
22.4. Conventional and Rapid Prototyping Market Value (US$ Bn) Analysis & Forecast, by Material, 2017–2031
22.4.1. Metal
22.4.2. Polymer
22.4.3. Ceramic
22.4.4. Others (Plaster and Starch, Foundry Sand Parts, etc.)
22.5. Conventional and Rapid Prototyping Market Value (US$ Bn) Analysis & Forecast, by End-use Industry, 2017–2031
22.5.1. Aerospace & Defense
22.5.2. Consumer Goods & Electronics
22.5.3. Automotive
22.5.4. Healthcare
22.5.5. Others (Film and Animation, Architecture, etc.)
22.6. Market Attractiveness Analysis
22.6.1. By Process
22.6.2. By Type
22.6.3. By Material
22.6.4. By End-use Industry
23. Middle East & Africa Conventional and Rapid Prototyping Market Analysis and Forecast
23.1. Market Snapshot
23.2. Drivers and Restraints: Impact Analysis
23.3. Conventional and Rapid Prototyping Market Value (US$ Bn) Analysis & Forecast, by Process, 2017–2031
23.3.1. Subtractive (Traditional Prototyping)
23.3.1.1. CNC Machining
23.3.1.2. Injection Molding
23.3.2. Additive (Rapid Prototyping)
23.3.2.1. Stereolithography (SLA)
23.3.2.2. Selective Laser Sintering (SLS)
23.3.2.3. Fused Deposition Modeling (FDM)
23.3.2.4. Multi Jet Fusion
23.3.2.5. Others (DLP, EBM, etc.)
23.4. Conventional and Rapid Prototyping Market Value (US$ Bn) Analysis & Forecast, by Type, 2017–2031
23.4.1. Proof-of-Concept (PoC) Prototype
23.4.2. Functional Prototype
23.4.3. Visual Prototype
23.4.4. Others (User Experience Prototype, etc.)
23.5. Conventional and Rapid Prototyping Market Value (US$ Bn) Analysis & Forecast, by Material, 2017–2031
23.5.1. Metal
23.5.2. Polymer
23.5.3. Ceramic
23.5.4. Others (Plaster and Starch, Foundry Sand Parts, etc.)
23.6. Conventional and Rapid Prototyping Market Value (US$ Bn) Analysis & Forecast, by End-use Industry, 2017–2031
23.6.1. Aerospace & Defense
23.6.2. Consumer Goods & Electronics
23.6.3. Automotive
23.6.4. Healthcare
23.6.5. Others (Film and Animation, Architecture, etc.)
23.7. Conventional and Rapid Prototyping Market Value (US$ Bn) Analysis & Forecast, by Country and Sub-region, 2017–2031
23.7.1. GCC
23.7.2. South Africa
23.7.3. Rest of Middle East & Africa
23.8. Market Attractiveness Analysis
23.8.1. By Process
23.8.2. By Type
23.8.3. By Material
23.8.4. By End-use Industry
23.8.5. By Country and Sub-region
24. South America Conventional and Rapid Prototyping Market Analysis and Forecast
24.1. Market Snapshot
24.2. Drivers and Restraints: Impact Analysis
24.3. Conventional and Rapid Prototyping Market Value (US$ Bn) Analysis & Forecast, by Process, 2017–2031
24.3.1. Subtractive (Traditional Prototyping)
24.3.1.1. CNC Machining
24.3.1.2. Injection Molding
24.3.2. Additive (Rapid Prototyping)
24.3.2.1. Stereolithography (SLA)
24.3.2.2. Selective Laser Sintering (SLS)
24.3.2.3. Fused Deposition Modeling (FDM)
24.3.2.4. Multi Jet Fusion
24.3.2.5. Others (DLP, EBM, etc.)
24.4. Conventional and Rapid Prototyping Market Value (US$ Bn) Analysis & Forecast, by Type, 2017–2031
24.4.1. Proof-of-Concept (PoC) Prototype
24.4.2. Functional Prototype
24.4.3. Visual Prototype
24.4.4. Others (User Experience Prototype, etc.)
24.5. Conventional and Rapid Prototyping Market Value (US$ Bn) Analysis & Forecast, by Material, 2017–2031
24.5.1. Metal
24.5.2. Polymer
24.5.3. Ceramic
24.5.4. Others (Plaster and Starch, Foundry Sand Parts, etc.)
24.6. Conventional and Rapid Prototyping Market Value (US$ Bn) Analysis & Forecast, by End-use Industry, 2017–2031
24.6.1. Aerospace & Defense
24.6.2. Consumer Goods & Electronics
24.6.3. Automotive
24.6.4. Healthcare
24.6.5. Others (Film and Animation, Architecture, etc.)
24.7. Conventional and Rapid Prototyping Market Value (US$ Bn) Analysis & Forecast, by Country and Sub-region, 2017–2031
24.7.1. Brazil
24.7.2. Rest of South America
24.8. Market Attractiveness Analysis
24.8.1. By Process
24.8.2. By Type
24.8.3. By Material
24.8.4. By End-use Industry
24.8.5. By Country and Sub-region
25. Competition Assessment
25.1. Global Conventional and Rapid Prototyping Market Competition Matrix - a Dashboard View
25.1.1. Global Conventional and Rapid Prototyping Market Company Share Analysis, by Value (2020)
25.1.2. Technological Differentiator
26. Company Profiles (Global Manufacturers/Suppliers)
26.1. 3E Rapid Prototyping Ltd.
26.1.1. Overview
26.1.2. Product Portfolio
26.1.3. Sales Footprint
26.1.4. Key Subsidiaries or Distributors
26.1.5. Strategy and Recent Developments
26.1.6. Key Financials
26.2. ARRK North America, Inc.
26.2.1. Overview
26.2.2. Product Portfolio
26.2.3. Sales Footprint
26.2.4. Key Subsidiaries or Distributors
26.2.5. Strategy and Recent Developments
26.2.6. Key Financials
26.3. Avench Systems INC
26.3.1. Overview
26.3.2. Product Portfolio
26.3.3. Sales Footprint
26.3.4. Key Subsidiaries or Distributors
26.3.5. Strategy and Recent Developments
26.3.6. Key Financials
26.4. Avid Product Development, LLC,
26.4.1. Overview
26.4.2. Product Portfolio
26.4.3. Sales Footprint
26.4.4. Key Subsidiaries or Distributors
26.4.5. Strategy and Recent Developments
26.4.6. Key Financials
26.5. CADX TOOLS & TECHNOLOGIES PVT LTD.
26.5.1. Overview
26.5.2. Product Portfolio
26.5.3. Sales Footprint
26.5.4. Key Subsidiaries or Distributors
26.5.5. Strategy and Recent Developments
26.5.6. Key Financials
26.6. Graphler Technology Solutions
26.6.1. Overview
26.6.2. Product Portfolio
26.6.3. Sales Footprint
26.6.4. Key Subsidiaries or Distributors
26.6.5. Strategy and Recent Developments
26.6.6. Key Financials
26.7. Model Solution Co., Ltd.
26.7.1. Overview
26.7.2. Product Portfolio
26.7.3. Sales Footprint
26.7.4. Key Subsidiaries or Distributors
26.7.5. Strategy and Recent Developments
26.7.6. Key Financials
26.8. Star Rapid., Ltd
26.8.1. Overview
26.8.2. Product Portfolio
26.8.3. Sales Footprint
26.8.4. Key Subsidiaries or Distributors
26.8.5. Strategy and Recent Developments
26.8.6. Key Financials
26.9. Protolabs
26.9.1. Overview
26.9.2. Product Portfolio
26.9.3. Sales Footprint
26.9.4. Key Subsidiaries or Distributors
26.9.5. Strategy and Recent Developments
26.9.6. Key Financials
26.10. Fictiv's
26.10.1. Overview
26.10.2. Product Portfolio
26.10.3. Sales Footprint
26.10.4. Key Subsidiaries or Distributors
26.10.5. Strategy and Recent Developments
26.10.6. Key Financials
26.11. ProtoCAM.
26.11.1. Overview
26.11.2. Product Portfolio
26.11.3. Sales Footprint
26.11.4. Key Subsidiaries or Distributors
26.11.5. Strategy and Recent Developments
26.11.6. Key Financials
26.12. Fathom Digital Manufacturing
26.12.1. Overview
26.12.2. Product Portfolio
26.12.3. Sales Footprint
26.12.4. Key Subsidiaries or Distributors
26.12.5. Strategy and Recent Developments
26.12.6. Key Financials
26.13. Core Molding Technologies, Inc.
26.13.1. Overview
26.13.2. Product Portfolio
26.13.3. Sales Footprint
26.13.4. Key Subsidiaries or Distributors
26.13.5. Strategy and Recent Developments
26.13.6. Key Financials
26.14. Materialise NV
26.14.1. Overview
26.14.2. Product Portfolio
26.14.3. Sales Footprint
26.14.4. Key Subsidiaries or Distributors
26.14.5. Strategy and Recent Developments
26.14.6. Key Financials
26.15. Ant Studio Co., Ltd.
26.15.1. Overview
26.15.2. Product Portfolio
26.15.3. Sales Footprint
26.15.4. Key Subsidiaries or Distributors
26.15.5. Strategy and Recent Developments
26.15.6. Key Financials
26.16. IMAGE MODEL Company Limited
26.16.1. Overview
26.16.2. Product Portfolio
26.16.3. Sales Footprint
26.16.4. Key Subsidiaries or Distributors
26.16.5. Strategy and Recent Developments
26.16.6. Key Financials
26.17. Empire Group USA, Inc.
26.17.1. Overview
26.17.2. Product Portfolio
26.17.3. Sales Footprint
26.17.4. Key Subsidiaries or Distributors
26.17.5. Strategy and Recent Developments
26.17.6. Key Financials
26.18. Kayra Global
26.18.1. Overview
26.18.2. Product Portfolio
26.18.3. Sales Footprint
26.18.4. Key Subsidiaries or Distributors
26.18.5. Strategy and Recent Developments
26.18.6. Key Financials
26.19. Xometry Europe GmbH
26.19.1. Overview
26.19.2. Product Portfolio
26.19.3. Sales Footprint
26.19.4. Key Subsidiaries or Distributors
26.19.5. Strategy and Recent Developments
26.19.6. Key Financials
26.20. Quickparts
26.20.1. Overview
26.20.2. Product Portfolio
26.20.3. Sales Footprint
26.20.4. Key Subsidiaries or Distributors
26.20.5. Strategy and Recent Developments
26.20.6. Key Financials
26.21. Sandvik AB
26.21.1. Overview
26.21.2. Product Portfolio
26.21.3. Sales Footprint
26.21.4. Key Subsidiaries or Distributors
26.21.5. Strategy and Recent Developments
26.21.6. Key Financials
26.22. Renishaw plc.
26.22.1. Overview
26.22.2. Product Portfolio
26.22.3. Sales Footprint
26.22.4. Key Subsidiaries or Distributors
26.22.5. Strategy and Recent Developments
26.22.6. Key Financials
26.23. Fado Sp. z o.o.
26.23.1. Overview
26.23.2. Product Portfolio
26.23.3. Sales Footprint
26.23.4. Key Subsidiaries or Distributors
26.23.5. Strategy and Recent Developments
26.23.6. Key Financials
26.24. Dassault Systèmes SE
26.24.1. Overview
26.24.2. Product Portfolio
26.24.3. Sales Footprint
26.24.4. Key Subsidiaries or Distributors
26.24.5. Strategy and Recent Developments
26.24.6. Key Financials
26.25. Axis Prototypes
26.25.1. Overview
26.25.2. Product Portfolio
26.25.3. Sales Footprint
26.25.4. Key Subsidiaries or Distributors
26.25.5. Strategy and Recent Developments
26.25.6. Key Financials
26.26. Kickr Design, LLC
26.26.1. Overview
26.26.2. Product Portfolio
26.26.3. Sales Footprint
26.26.4. Key Subsidiaries or Distributors
26.26.5. Strategy and Recent Developments
26.26.6. Key Financials
27. Recommendation
27.1. Opportunity Assessment
27.1.1. By Process
27.1.2. By Type
27.1.3. By Material
27.1.4. By End-use Industry
27.1.5. By Region
List of Tables
Table 01: Global Conventional and Rapid Prototyping Market Size & Forecast, by Type, Value (US$ Bn), 2017‒2031
Table 02: Global Conventional and Rapid Prototyping Market Size & Forecast, by Material, Value (US$ Bn), 2017‒2031
Table 03: Global Conventional and Rapid Prototyping Market Size & Forecast, by End-use Industry, Value (US$ Bn), 2017‒2031
Table 04: Global Conventional and Rapid Prototyping Market Size & Forecast, by Region, Value (US$ Bn), 2017‒2031
Table 05: North America Conventional and Rapid Prototyping Market Size & Forecast, by Process, Value (US$ Bn), 2017‒2031
Table 06: North America Conventional and Rapid Prototyping Market Size & Forecast, by Type, Value (US$ Bn), 2017‒2031
Table 07: North America Conventional and Rapid Prototyping Market Size & Forecast, by Material, Value (US$ Bn), 2017‒2031
Table 08: North America Conventional and Rapid Prototyping Market Size & Forecast, by End-use Industry, Value (US$ Bn), 2017‒2031
Table 09: North America Conventional and Rapid Prototyping Market Size & Forecast, by Country and Sub-region, Value (US$ Bn), 2017‒2031
Table 10: U.S. Conventional and Rapid Prototyping Market Size & Forecast, by Process, Value (US$ Bn), 2017‒2031
Table 11: U.S. Conventional and Rapid Prototyping Market Size & Forecast, by Type, Value (US$ Bn), 2017‒2031
Table 12: U.S. Conventional and Rapid Prototyping Market Size & Forecast, by Material, Value (US$ Bn), 2017‒2031
Table 13: U.S. Conventional and Rapid Prototyping Market Size & Forecast, by End-use Industry, Value (US$ Bn), 2017‒2031
Table 14: Canada Conventional and Rapid Prototyping Market Size & Forecast, by Process, Value (US$ Bn), 2017‒2031
Table 15: Canada Conventional and Rapid Prototyping Market Size & Forecast, by Type, Value (US$ Bn), 2017‒2031
Table 16: Canada Conventional and Rapid Prototyping Market Size & Forecast, by Material, Value (US$ Bn), 2017‒2031
Table 17: Canada Conventional and Rapid Prototyping Market Size & Forecast, by End-use Industry, Value (US$ Bn), 2017‒2031
Table 18: Europe Conventional and Rapid Prototyping Market Size & Forecast, by Process, Value (US$ Bn), 2017‒2031
Table 19: Europe Conventional and Rapid Prototyping Market Size & Forecast, by Type, Value (US$ Bn), 2017‒2031
Table 20: Europe Conventional and Rapid Prototyping Market Size & Forecast, by Material, Value (US$ Bn), 2017‒2031
Table 21: Europe Conventional and Rapid Prototyping Market Size & Forecast, by End-use Industry, Value (US$ Bn), 2017‒2031
Table 22: Europe Conventional and Rapid Prototyping Market Size & Forecast, by Country and Sub-region, Value (US$ Bn), 2017‒2031
Table 23: U.K. Conventional and Rapid Prototyping Market Size & Forecast, by Process, Value (US$ Bn), 2017‒2031
Table 24: U.K. Conventional and Rapid Prototyping Market Size & Forecast, by Type, Value (US$ Bn), 2017‒2031
Table 25: U.K. Conventional and Rapid Prototyping Market Size & Forecast, by Material, Value (US$ Bn), 2017‒2031
Table 26: U.K. Conventional and Rapid Prototyping Market Size & Forecast, by End-use Industry, Value (US$ Bn), 2017‒2031
Table 27: Germany Conventional and Rapid Prototyping Market Size & Forecast, by Process, Value (US$ Bn), 2017‒2031
Table 28: Germany Conventional and Rapid Prototyping Market Size & Forecast, by Type, Value (US$ Bn), 2017‒2031
Table 29: Germany Conventional and Rapid Prototyping Market Size & Forecast, by Material, Value (US$ Bn), 2017‒2031
Table 30: Germany Conventional and Rapid Prototyping Market Size & Forecast, by End-use Industry, Value (US$ Bn), 2017‒2031
Table 31: France Conventional and Rapid Prototyping Market Size & Forecast, by Process, Value (US$ Bn), 2017‒2031
Table 32: France Conventional and Rapid Prototyping Market Size & Forecast, by Type, Value (US$ Bn), 2017‒2031
Table 33: France Conventional and Rapid Prototyping Market Size & Forecast, by Material, Value (US$ Bn), 2017‒2031
Table 34: France Conventional and Rapid Prototyping Market Size & Forecast, by End-use Industry, Value (US$ Bn), 2017‒2031
Table 35: Asia Pacific Conventional and Rapid Prototyping Market Size & Forecast, by Process, Value (US$ Bn), 2017‒2031
Table 36: Asia Pacific Conventional and Rapid Prototyping Market Size & Forecast, by Type, Value (US$ Bn), 2017‒2031
Table 37: Asia Pacific Conventional and Rapid Prototyping Market Size & Forecast, by Material, Value (US$ Bn), 2017‒2031
Table 38: Asia Pacific Conventional and Rapid Prototyping Market Size & Forecast, by End-use Industry, Value (US$ Bn), 2017‒2031
Table 39: Asia Pacific Conventional and Rapid Prototyping Market Size & Forecast, by Country and Sub-region, Value (US$ Bn), 2017‒2031
Table 40: China Conventional and Rapid Prototyping Market Size & Forecast, by Process, Value (US$ Bn), 2017‒2031
Table 41: China Conventional and Rapid Prototyping Market Size & Forecast, by Type, Value (US$ Bn), 2017‒2031
Table 42: China Conventional and Rapid Prototyping Market Size & Forecast, by Material, Value (US$ Bn), 2017‒2031
Table 43: China Conventional and Rapid Prototyping Market Size & Forecast, by End-use Industry, Value (US$ Bn), 2017‒2031
Table 44: Japan Conventional and Rapid Prototyping Market Size & Forecast, by Process, Value (US$ Bn), 2017‒2031
Table 45: Japan Conventional and Rapid Prototyping Market Size & Forecast, by Type, Value (US$ Bn), 2017‒2031
Table 46: Japan Conventional and Rapid Prototyping Market Size & Forecast, by Material, Value (US$ Bn), 2017‒2031
Table 47: Japan Conventional and Rapid Prototyping Market Size & Forecast, by End-use Industry, Value (US$ Bn), 2017‒2031
Table 48: South Korea Conventional and Rapid Prototyping Market Size & Forecast, by Process, Value (US$ Bn), 2017‒2031
Table 49: South Korea Conventional and Rapid Prototyping Market Size & Forecast, by Type, Value (US$ Bn), 2017‒2031
Table 50: South Korea Conventional and Rapid Prototyping Market Size & Forecast, by Material, Value (US$ Bn), 2017‒2031
Table 51: South Korea Conventional and Rapid Prototyping Market Size & Forecast, by End-use Industry, Value (US$ Bn), 2017‒2031
Table 52: India Conventional and Rapid Prototyping Market Size & Forecast, by Process, Value (US$ Bn), 2017‒2031
Table 53: India Conventional and Rapid Prototyping Market Size & Forecast, by Type, Value (US$ Bn), 2017‒2031
Table 54: India Conventional and Rapid Prototyping Market Size & Forecast, by Material, Value (US$ Bn), 2017‒2031
Table 55: India Conventional and Rapid Prototyping Market Size & Forecast, by End-use Industry, Value (US$ Bn), 2017‒2031
Table 56: ASEAN Conventional and Rapid Prototyping Market Size & Forecast, by Process, Value (US$ Bn), 2017‒2031
Table 57: ASEAN Conventional and Rapid Prototyping Market Size & Forecast, by Type, Value (US$ Bn), 2017‒2031
Table 58: ASEAN Conventional and Rapid Prototyping Market Size & Forecast, by Material, Value (US$ Bn), 2017‒2031
Table 59: ASEAN Conventional and Rapid Prototyping Market Size & Forecast, by End-use Industry, Value (US$ Bn), 2017‒2031
Table 60: Middle East & Africa Conventional and Rapid Prototyping Market Size & Forecast, by Process, Value (US$ Bn), 2017‒2031
Table 61: Middle East & Africa Conventional and Rapid Prototyping Market Size & Forecast, by Type, Value (US$ Bn), 2017‒2031
Table 62: Middle East & Africa Conventional and Rapid Prototyping Market Size & Forecast, by Material, Value (US$ Bn), 2017‒2031
Table 63: Middle East & Africa Conventional and Rapid Prototyping Market Size & Forecast, by End-use Industry, Value (US$ Bn), 2017‒2031
Table 64: Middle East & Africa Conventional and Rapid Prototyping Market Size & Forecast, by Country and Sub-region, Value (US$ Bn), 2017‒2031
Table 65: South America Conventional and Rapid Prototyping Market Size & Forecast, by Process, Value (US$ Bn), 2017‒2031
Table 66: South America Conventional and Rapid Prototyping Market Size & Forecast, by Type, Value (US$ Bn), 2017‒2031
Table 67: South America Conventional and Rapid Prototyping Market Size & Forecast, by Material, Value (US$ Bn), 2017‒2031
Table 68: South America Conventional and Rapid Prototyping Market Size & Forecast, by End-use Industry, Value (US$ Bn), 2017‒2031
Table 69: South America Conventional and Rapid Prototyping Market Size & Forecast, by Country and Sub-region, Value (US$ Bn), 2017‒2031
List of Figures
Figure 01: Global Conventional and Rapid Prototyping Market, Year-on-Year Growth, Overview, 2021‒2031
Figure 02: Global Conventional and Rapid Prototyping Market Projections by Process, Value (US$ Bn), 2017‒2031
Figure 03: Global Conventional and Rapid Prototyping Market, Incremental Opportunity, by Process, Value (US$ Bn), 2022‒2031
Figure 04: Global Conventional and Rapid Prototyping Market Share Analysis, by Process, 2021 and 2031
Figure 05: Global Conventional and Rapid Prototyping Market Projections by Type, Value (US$ Bn), 2017‒2031
Figure 06: Global Conventional and Rapid Prototyping Market, Incremental Opportunity, by Type, Value (US$ Bn), 2022‒2031
Figure 07: Global Conventional and Rapid Prototyping Market Share Analysis, by Type, 2021 and 2031
Figure 08: Global Conventional and Rapid Prototyping Market Projections by Material, Value (US$ Bn), 2017‒2031
Figure 09: Global Conventional and Rapid Prototyping Market, Incremental Opportunity, by Material, Value (US$ Bn), 2022‒2031
Figure 10: Global Conventional and Rapid Prototyping Market Share Analysis, by Material, 2021 and 2031
Figure 11: Global Conventional and Rapid Prototyping Market Projections by End-use Industry, Value (US$ Bn), 2017‒2031
Figure 12: Global Conventional and Rapid Prototyping Market, Incremental Opportunity, by End-use Industry, Value (US$ Bn), 2022‒2031
Figure 13: Global Conventional and Rapid Prototyping Market Share Analysis, by End-use Industry, 2021 and 2031
Figure 14: Global Conventional and Rapid Prototyping Market Projections by Region, Value (US$ Bn), 2017‒2031
Figure 15: Global Conventional and Rapid Prototyping Market, Incremental Opportunity, by Region, Value (US$ Bn), 2022‒2031
Figure 16: Global Conventional and Rapid Prototyping Market Share Analysis, by Region, 2021 and 2031
Figure 17: North America Conventional and Rapid Prototyping Market, Year-on-Year Growth, Overview, 2021‒2031
Figure 18: North America Conventional and Rapid Prototyping Market Projections by Process, Value (US$ Bn), 2017‒2031
Figure 19: North America Conventional and Rapid Prototyping Market, Incremental Opportunity, by Process, Value (US$ Bn), 2022‒2031
Figure 20: North America Conventional and Rapid Prototyping Market Share Analysis, by Process, 2021 and 2031
Figure 21: North America Conventional and Rapid Prototyping Market Projections by Type, Value (US$ Bn), 2017‒2031
Figure 22: North America Conventional and Rapid Prototyping Market, Incremental Opportunity, by Type, Value (US$ Bn), 2022‒2031
Figure 23: North America Conventional and Rapid Prototyping Market Share Analysis, by Type, 2021 and 2031
Figure 24: North America Conventional and Rapid Prototyping Market Projections by Material, Value (US$ Bn), 2017‒2031
Figure 25: North America Conventional and Rapid Prototyping Market, Incremental Opportunity, by Material, Value (US$ Bn), 2022‒2031
Figure 26: North America Conventional and Rapid Prototyping Market Share Analysis, by Material, 2021 and 2031
Figure 27: North America Conventional and Rapid Prototyping Market Projections by End-use Industry, Value (US$ Bn), 2017‒2031
Figure 28: North America Conventional and Rapid Prototyping Market, Incremental Opportunity, by End-use Industry, Value (US$ Bn), 2022‒2031
Figure 29: North America Conventional and Rapid Prototyping Market Share Analysis, by End-use Industry, 2021 and 2031
Figure 30: North America Conventional and Rapid Prototyping Market Projections by Country, Value (US$ Bn), 2017‒2031
Figure 31: North America Conventional and Rapid Prototyping Market, Incremental Opportunity, by Country, Value (US$ Bn), 2022‒2031
Figure 32: North America Conventional and Rapid Prototyping Market Share Analysis, by Country, 2021 and 2031
Figure 33: U.S. Conventional and Rapid Prototyping Market Size & Forecast, Value (US$ Bn), 2017‒2031
Figure 34: U.S. Conventional and Rapid Prototyping Market, Year-on-Year Growth, Overview, 2021‒2031
Figure 35: U.S. Conventional and Rapid Prototyping Market Projections by Process, Value (US$ Bn), 2017‒2031
Figure 36: U.S. Conventional and Rapid Prototyping Market, Incremental Opportunity, by Process, Value (US$ Bn), 2022‒2031
Figure 37: U.S. Conventional and Rapid Prototyping Market Share Analysis, by Process, 2021 and 2031
Figure 38: U.S. Conventional and Rapid Prototyping Market Projections by Type, Value (US$ Bn), 2017‒2031
Figure 39: U.S. Conventional and Rapid Prototyping Market, Incremental Opportunity, by Type, Value (US$ Bn), 2022‒2031
Figure 40: U.S. Conventional and Rapid Prototyping Market Share Analysis, by Type, 2021 and 2031
Figure 41: U.S. Conventional and Rapid Prototyping Market Projections by Material, Value (US$ Bn), 2017‒2031
Figure 42: U.S. Conventional and Rapid Prototyping Market, Incremental Opportunity, by Material, Value (US$ Bn), 2022‒2031
Figure 43: U.S. Conventional and Rapid Prototyping Market Share Analysis, by Material, 2021 and 2031
Figure 44: U.S. Conventional and Rapid Prototyping Market Projections by End-use Industry, Value (US$ Bn), 2017‒2031
Figure 45: U.S. Conventional and Rapid Prototyping Market, Incremental Opportunity, by End-use Industry, Value (US$ Bn), 2022‒2031
Figure 46: U.S. Conventional and Rapid Prototyping Market Share Analysis, by End-use Industry, 2021 and 2031
Figure 47: Canada Conventional and Rapid Prototyping Market Size & Forecast, Value (US$ Bn), 2017‒2031
Figure 48: Canada Conventional and Rapid Prototyping Market, Year-on-Year Growth, Overview, 2021‒2031
Figure 49: Canada Conventional and Rapid Prototyping Market Projections by Process, Value (US$ Bn), 2017‒2031
Figure 50: Canada Conventional and Rapid Prototyping Market, Incremental Opportunity, by Process, Value (US$ Bn), 2022‒2031
Figure 51: Canada Conventional and Rapid Prototyping Market Share Analysis, by Process, 2021 and 2031
Figure 52: Canada Conventional and Rapid Prototyping Market Projections by Type, Value (US$ Bn), 2017‒2031
Figure 53: Canada Conventional and Rapid Prototyping Market, Incremental Opportunity, by Type, Value (US$ Bn), 2022‒2031
Figure 54: Canada Conventional and Rapid Prototyping Market Share Analysis, by Type, 2021 and 2031
Figure 55: Canada Conventional and Rapid Prototyping Market Projections by Material, Value (US$ Bn), 2017‒2031
Figure 56: Canada Conventional and Rapid Prototyping Market, Incremental Opportunity, by Material, Value (US$ Bn), 2022‒2031
Figure 57: Canada Conventional and Rapid Prototyping Market Share Analysis, by Material, 2021 and 2031
Figure 58: Canada Conventional and Rapid Prototyping Market Projections by End-use Industry, Value (US$ Bn), 2017‒2031
Figure 59: Canada Conventional and Rapid Prototyping Market, Incremental Opportunity, by End-use Industry, Value (US$ Bn), 2022‒2031
Figure 60: Canada Conventional and Rapid Prototyping Market Share Analysis, by End-use Industry, 2021 and 2031
Figure 61: Europe Conventional and Rapid Prototyping Market, Year-on-Year Growth, Overview, 2021‒2031
Figure 62: Europe Conventional and Rapid Prototyping Market Projections by Process, Value (US$ Bn), 2017‒2031
Figure 63: Europe Conventional and Rapid Prototyping Market, Incremental Opportunity, by Process, Value (US$ Bn), 2022‒2031
Figure 64: Europe Conventional and Rapid Prototyping Market Share Analysis, by Process, 2021 and 2031
Figure 65: Europe Conventional and Rapid Prototyping Market Projections by Type, Value (US$ Bn), 2017‒2031
Figure 66: Europe Conventional and Rapid Prototyping Market, Incremental Opportunity, by Type, Value (US$ Bn), 2022‒2031
Figure 67: Europe Conventional and Rapid Prototyping Market Share Analysis, by Type, 2021 and 2031
Figure 68: Europe Conventional and Rapid Prototyping Market Projections by Material, Value (US$ Bn), 2017‒2031
Figure 69: Europe Conventional and Rapid Prototyping Market, Incremental Opportunity, by Material, Value (US$ Bn), 2022‒2031
Figure 70: Europe Conventional and Rapid Prototyping Market Share Analysis, by Material, 2021 and 2031
Figure 71: Europe Conventional and Rapid Prototyping Market Projections by End-use Industry, Value (US$ Bn), 2017‒2031
Figure 72: Europe Conventional and Rapid Prototyping Market, Incremental Opportunity, by End-use Industry, Value (US$ Bn), 2022‒2031
Figure 73: Europe Conventional and Rapid Prototyping Market Share Analysis, by End-use Industry, 2021 and 2031
Figure 74: Europe Conventional and Rapid Prototyping Market Projections by Country and Sub-region, Value (US$ Bn), 2017‒2031
Figure 75: Europe Conventional and Rapid Prototyping Market, Incremental Opportunity, by Country and Sub-region, Value (US$ Bn), 2022‒2031
Figure 76: Europe Conventional and Rapid Prototyping Market Share Analysis, by Country and Sub-region, 2021 and 2031
Figure 77: U.K. Conventional and Rapid Prototyping Market Size & Forecast, Value (US$ Bn), 2017‒2031
Figure 78: U.K. Conventional and Rapid Prototyping Market, Year-on-Year Growth, Overview, 2021‒2031
Figure 79: U.K. Conventional and Rapid Prototyping Market Projections by Process, Value (US$ Bn), 2017‒2031
Figure 80: U.K. Conventional and Rapid Prototyping Market, Incremental Opportunity, by Process, Value (US$ Bn), 2022‒2031
Figure 81: U.K. Conventional and Rapid Prototyping Market Share Analysis, by Process, 2021 and 2031
Figure 82: U.K. Conventional and Rapid Prototyping Market Projections by Type, Value (US$ Bn), 2017‒2031
Figure 83: U.K. Conventional and Rapid Prototyping Market, Incremental Opportunity, by Type, Value (US$ Bn), 2022‒2031
Figure 84: U.K. Conventional and Rapid Prototyping Market Share Analysis, by Type, 2021 and 2031
Figure 85: U.K. Conventional and Rapid Prototyping Market Projections by Material, Value (US$ Bn), 2017‒2031
Figure 86: U.K. Conventional and Rapid Prototyping Market, Incremental Opportunity, by Material, Value (US$ Bn), 2022‒2031
Figure 87: U.K. Conventional and Rapid Prototyping Market Share Analysis, by Material, 2021 and 2031
Figure 88: U.K. Conventional and Rapid Prototyping Market Projections by End-use Industry, Value (US$ Bn), 2017‒2031
Figure 89: U.K. Conventional and Rapid Prototyping Market, Incremental Opportunity, by End-use Industry, Value (US$ Bn), 2022‒2031
Figure 90: U.K. Conventional and Rapid Prototyping Market Share Analysis, by End-use Industry, 2021 and 2031
Figure 91: Germany Conventional and Rapid Prototyping Market Size & Forecast, Value (US$ Bn), 2017‒2031
Figure 92: Germany Conventional and Rapid Prototyping Market, Year-on-Year Growth, Overview, 2021‒2031
Figure 93: Germany Conventional and Rapid Prototyping Market Projections by Process, Value (US$ Bn), 2017‒2031
Figure 94: Germany Conventional and Rapid Prototyping Market, Incremental Opportunity, by Process, Value (US$ Bn), 2022‒2031
Figure 95: Germany Conventional and Rapid Prototyping Market Share Analysis, by Process, 2021 and 2031
Figure 96: Germany Conventional and Rapid Prototyping Market Projections by Type, Value (US$ Bn), 2017‒2031
Figure 97: Germany Conventional and Rapid Prototyping Market, Incremental Opportunity, by Type, Value (US$ Bn), 2022‒2031
Figure 98: Germany Conventional and Rapid Prototyping Market Share Analysis, by Type, 2021 and 2031
Figure 99: Germany Conventional and Rapid Prototyping Market Projections by Material, Value (US$ Bn), 2017‒2031
Figure 100: Germany Conventional and Rapid Prototyping Market, Incremental Opportunity, by Material, Value (US$ Bn), 2022‒2031
Figure 101: Germany Conventional and Rapid Prototyping Market Share Analysis, by Material, 2021 and 2031
Figure 102: Germany Conventional and Rapid Prototyping Market Projections by End-use Industry, Value (US$ Bn), 2017‒2031
Figure 103: Germany Conventional and Rapid Prototyping Market, Incremental Opportunity, by End-use Industry, Value (US$ Bn), 2022‒2031
Figure 104: Germany Conventional and Rapid Prototyping Market Share Analysis, by End-use Industry, 2021 and 2031
Figure 105: France Conventional and Rapid Prototyping Market Size & Forecast, Value (US$ Bn), 2017‒2031
Figure 106: France Conventional and Rapid Prototyping Market, Year-on-Year Growth, Overview, 2021‒2031
Figure 107: France Conventional and Rapid Prototyping Market Projections by Process, Value (US$ Bn), 2017‒2031
Figure 108: France Conventional and Rapid Prototyping Market, Incremental Opportunity, by Process, Value (US$ Bn), 2022‒2031
Figure 109: France Conventional and Rapid Prototyping Market Share Analysis, by Process, 2021 and 2031
Figure 110: France Conventional and Rapid Prototyping Market Projections by Type, Value (US$ Bn), 2017‒2031
Figure 111: France Conventional and Rapid Prototyping Market, Incremental Opportunity, by Type, Value (US$ Bn), 2022‒2031
Figure 112: France Conventional and Rapid Prototyping Market Share Analysis, by Type, 2021 and 2031
Figure 113: France Conventional and Rapid Prototyping Market Projections by Material, Value (US$ Bn), 2017‒2031
Figure 114: France Conventional and Rapid Prototyping Market, Incremental Opportunity, by Material, Value (US$ Bn), 2022‒2031
Figure 115: France Conventional and Rapid Prototyping Market Share Analysis, by Material, 2021 and 2031
Figure 116: France Conventional and Rapid Prototyping Market Projections by End-use Industry, Value (US$ Bn), 2017‒2031
Figure 117: France Conventional and Rapid Prototyping Market, Incremental Opportunity, by End-use Industry, Value (US$ Bn), 2022‒2031
Figure 118: France Conventional and Rapid Prototyping Market Share Analysis, by End-use Industry, 2021 and 2031
Figure 119: Asia Pacific Conventional and Rapid Prototyping Market, Year-on-Year Growth, Overview, 2021‒2031
Figure 120: Asia Pacific Conventional and Rapid Prototyping Market Projections by Process, Value (US$ Bn), 2017‒2031
Figure 121: Asia Pacific Conventional and Rapid Prototyping Market, Incremental Opportunity, by Process, Value (US$ Bn), 2022‒2031
Figure 122: Asia Pacific Conventional and Rapid Prototyping Market Share Analysis, by Process, 2021 and 2031
Figure 123: Asia Pacific Conventional and Rapid Prototyping Market Projections by Type, Value (US$ Bn), 2017‒2031
Figure 124: Asia Pacific Conventional and Rapid Prototyping Market, Incremental Opportunity, by Type, Value (US$ Bn), 2022‒2031
Figure 125: Asia Pacific Conventional and Rapid Prototyping Market Share Analysis, by Type, 2021 and 2031
Figure 126: Asia Pacific Conventional and Rapid Prototyping Market Projections by Material, Value (US$ Bn), 2017‒2031
Figure 127: Asia Pacific Conventional and Rapid Prototyping Market, Incremental Opportunity, by Material, Value (US$ Bn), 2022‒2031
Figure 128: Asia Pacific Conventional and Rapid Prototyping Market Share Analysis, by Material, 2021 and 2031
Figure 129: Asia Pacific Conventional and Rapid Prototyping Market Projections by End-use Industry, Value (US$ Bn), 2017‒2031
Figure 130: Asia Pacific Conventional and Rapid Prototyping Market, Incremental Opportunity, by End-use Industry, Value (US$ Bn), 2022‒2031
Figure 131: Asia Pacific Conventional and Rapid Prototyping Market Share Analysis, by End-use Industry, 2021 and 2031
Figure 132: Asia Pacific Conventional and Rapid Prototyping Market Projections by Country and Sub-region, Value (US$ Bn), 2017‒2031
Figure 133: Asia Pacific Conventional and Rapid Prototyping Market, Incremental Opportunity, by Country and Sub-region, Value (US$ Bn), 2022‒2031
Figure 134: Asia Pacific Conventional and Rapid Prototyping Market Share Analysis, by Country and Sub-region, 2021 and 2031
Figure 135: China Conventional and Rapid Prototyping Market Size & Forecast, Value (US$ Bn), 2017‒2031
Figure 136: China Conventional and Rapid Prototyping Market, Year-on-Year Growth, Overview, 2021‒2031
Figure 137: China Conventional and Rapid Prototyping Market Projections by Process, Value (US$ Bn), 2017‒2031
Figure 138: China Conventional and Rapid Prototyping Market, Incremental Opportunity, by Process, Value (US$ Bn), 2022‒2031
Figure 139: China Conventional and Rapid Prototyping Market Share Analysis, by Process, 2021 and 2031
Figure 140: China Conventional and Rapid Prototyping Market Projections by Type, Value (US$ Bn), 2017‒2031
Figure 141: China Conventional and Rapid Prototyping Market, Incremental Opportunity, by Type, Value (US$ Bn), 2022‒2031
Figure 142: China Conventional and Rapid Prototyping Market Share Analysis, by Type, 2021 and 2031
Figure 143: China Conventional and Rapid Prototyping Market Projections by Material, Value (US$ Bn), 2017‒2031
Figure 144: China Conventional and Rapid Prototyping Market, Incremental Opportunity, by Material, Value (US$ Bn), 2022‒2031
Figure 145: China Conventional and Rapid Prototyping Market Share Analysis, by Material, 2021 and 2031
Figure 146: China Conventional and Rapid Prototyping Market Projections by End-use Industry, Value (US$ Bn), 2017‒2031
Figure 147: China Conventional and Rapid Prototyping Market, Incremental Opportunity, by End-use Industry, Value (US$ Bn), 2022‒2031
Figure 148: China Conventional and Rapid Prototyping Market Share Analysis, by End-use Industry, 2021 and 2031
Figure 149: Japan Conventional and Rapid Prototyping Market Size & Forecast, Value (US$ Bn), 2017‒2031
Figure 150: Japan Conventional and Rapid Prototyping Market, Year-on-Year Growth, Overview, 2021‒2031
Figure 151: Japan Conventional and Rapid Prototyping Market Projections by Process, Value (US$ Bn), 2017‒2031
Figure 152: Japan Conventional and Rapid Prototyping Market, Incremental Opportunity, by Process, Value (US$ Bn), 2022‒2031
Figure 153: Japan Conventional and Rapid Prototyping Market Share Analysis, by Process, 2021 and 2031
Figure 154: Japan Conventional and Rapid Prototyping Market Projections by Type, Value (US$ Bn), 2017‒2031
Figure 155: Japan Conventional and Rapid Prototyping Market, Incremental Opportunity, by Type, Value (US$ Bn), 2022‒2031
Figure 156: Japan Conventional and Rapid Prototyping Market Share Analysis, by Type, 2021 and 2031
Figure 157: Japan Conventional and Rapid Prototyping Market Projections by Material, Value (US$ Bn), 2017‒2031
Figure 158: Japan Conventional and Rapid Prototyping Market, Incremental Opportunity, by Material, Value (US$ Bn), 2022‒2031
Figure 159: Japan Conventional and Rapid Prototyping Market Share Analysis, by Material, 2021 and 2031
Figure 160: Japan Conventional and Rapid Prototyping Market Projections by End-use Industry, Value (US$ Bn), 2017‒2031
Figure 161: Japan Conventional and Rapid Prototyping Market, Incremental Opportunity, by End-use Industry, Value (US$ Bn), 2022‒2031
Figure 162: Japan Conventional and Rapid Prototyping Market Share Analysis, by End-use Industry, 2021 and 2031
Figure 163: South Korea Conventional and Rapid Prototyping Market Size & Forecast, Value (US$ Bn), 2017‒2031
Figure 164: South Korea Conventional and Rapid Prototyping Market, Year-on-Year Growth, Overview, 2021‒2031
Figure 165: South Korea Conventional and Rapid Prototyping Market Projections by Process, Value (US$ Bn), 2017‒2031
Figure 166: South Korea Conventional and Rapid Prototyping Market, Incremental Opportunity, by Process, Value (US$ Bn), 2022‒2031
Figure 167: South Korea Conventional and Rapid Prototyping Market Share Analysis, by Process, 2021 and 2031
Figure 168: South Korea Conventional and Rapid Prototyping Market Projections by Type, Value (US$ Bn), 2017‒2031
Figure 169: South Korea Conventional and Rapid Prototyping Market, Incremental Opportunity, by Type, Value (US$ Bn), 2022‒2031
Figure 170: South Korea Conventional and Rapid Prototyping Market Share Analysis, by Type, 2021 and 2031
Figure 171: South Korea Conventional and Rapid Prototyping Market Projections by Material, Value (US$ Bn), 2017‒2031
Figure 172: South Korea Conventional and Rapid Prototyping Market, Incremental Opportunity, by Material, Value (US$ Bn), 2022‒2031
Figure 173: South Korea Conventional and Rapid Prototyping Market Share Analysis, by Material, 2021 and 2031
Figure 174: South Korea Conventional and Rapid Prototyping Market Projections by End-use Industry, Value (US$ Bn), 2017‒2031
Figure 175: South Korea Conventional and Rapid Prototyping Market, Incremental Opportunity, by End-use Industry, Value (US$ Bn), 2022‒2031
Figure 176: South Korea Conventional and Rapid Prototyping Market Share Analysis, by End-use Industry, 2021 and 2031
Figure 177: India Conventional and Rapid Prototyping Market Size & Forecast, Value (US$ Bn), 2017‒2031
Figure 178: India Conventional and Rapid Prototyping Market, Year-on-Year Growth, Overview, 2021‒2031
Figure 179: India Conventional and Rapid Prototyping Market Projections by Process, Value (US$ Bn), 2017‒2031
Figure 180: India Conventional and Rapid Prototyping Market, Incremental Opportunity, by Process, Value (US$ Bn), 2022‒2031
Figure 181: India Conventional and Rapid Prototyping Market Share Analysis, by Process, 2021 and 2031
Figure 182: India Conventional and Rapid Prototyping Market Projections by Type, Value (US$ Bn), 2017‒2031
Figure 183: India Conventional and Rapid Prototyping Market, Incremental Opportunity, by Type, Value (US$ Bn), 2022‒2031
Figure 184: India Conventional and Rapid Prototyping Market Share Analysis, by Type, 2021 and 2031
Figure 185: India Conventional and Rapid Prototyping Market Projections by Material, Value (US$ Bn), 2017‒2031
Figure 186: India Conventional and Rapid Prototyping Market, Incremental Opportunity, by Material, Value (US$ Bn), 2022‒2031
Figure 187: India Conventional and Rapid Prototyping Market Share Analysis, by Material, 2021 and 2031
Figure 188: India Conventional and Rapid Prototyping Market Projections by End-use Industry, Value (US$ Bn), 2017‒2031
Figure 189: India Conventional and Rapid Prototyping Market, Incremental Opportunity, by End-use Industry, Value (US$ Bn), 2022‒2031
Figure 190: India Conventional and Rapid Prototyping Market Share Analysis, by End-use Industry, 2021 and 2031
Figure 191: ASEAN Conventional and Rapid Prototyping Market Size & Forecast, Value (US$ Bn), 2017‒2031
Figure 192: ASEAN Conventional and Rapid Prototyping Market, Year-on-Year Growth, Overview, 2021‒2031
Figure 193: ASEAN Conventional and Rapid Prototyping Market Projections by Process, Value (US$ Bn), 2017‒2031
Figure 194: ASEAN Conventional and Rapid Prototyping Market, Incremental Opportunity, by Process, Value (US$ Bn), 2022‒2031
Figure 195: ASEAN Conventional and Rapid Prototyping Market Share Analysis, by Process, 2021 and 2031
Figure 196: ASEAN Conventional and Rapid Prototyping Market Projections by Type, Value (US$ Bn), 2017‒2031
Figure 197: ASEAN Conventional and Rapid Prototyping Market, Incremental Opportunity, by Type, Value (US$ Bn), 2022‒2031
Figure 198: ASEAN Conventional and Rapid Prototyping Market Share Analysis, by Type, 2021 and 2031
Figure 199: ASEAN Conventional and Rapid Prototyping Market Projections by Material, Value (US$ Bn), 2017‒2031
Figure 200: ASEAN Conventional and Rapid Prototyping Market, Incremental Opportunity, by Material, Value (US$ Bn), 2022‒2031
Figure 201: ASEAN Conventional and Rapid Prototyping Market Share Analysis, by Material, 2021 and 2031
Figure 202: ASEAN Conventional and Rapid Prototyping Market Projections by End-use Industry, Value (US$ Bn), 2017‒2031
Figure 203: ASEAN Conventional and Rapid Prototyping Market, Incremental Opportunity, by End-use Industry, Value (US$ Bn), 2022‒2031
Figure 204: ASEAN Conventional and Rapid Prototyping Market Share Analysis, by End-use Industry, 2021 and 2031
Figure 205: Middle East & Africa Conventional and Rapid Prototyping Market, Year-on-Year Growth, Overview, 2021‒2031
Figure 206: Middle East & Africa Conventional and Rapid Prototyping Market Projections by Process, Value (US$ Bn), 2017‒2031
Figure 207: Middle East & Africa Conventional and Rapid Prototyping Market, Incremental Opportunity, by Process, Value (US$ Bn), 2022‒2031
Figure 208: Middle East & Africa Conventional and Rapid Prototyping Market Share Analysis, by Process, 2021 and 2031
Figure 209: Middle East & Africa Conventional and Rapid Prototyping Market Projections by Type, Value (US$ Bn), 2017‒2031
Figure 210: Middle East & Africa Conventional and Rapid Prototyping Market, Incremental Opportunity, by Type, Value (US$ Bn), 2022‒2031
Figure 211: Middle East & Africa Conventional and Rapid Prototyping Market Share Analysis, by Type, 2021 and 2031
Figure 212: Middle East & Africa Conventional and Rapid Prototyping Market Projections by Material, Value (US$ Bn), 2017‒2031
Figure 213: Middle East & Africa Conventional and Rapid Prototyping Market, Incremental Opportunity, by Material, Value (US$ Bn), 2022‒2031
Figure 214: Middle East & Africa Conventional and Rapid Prototyping Market Share Analysis, by Material, 2021 and 2031
Figure 215: Middle East & Africa Conventional and Rapid Prototyping Market Projections by End-use Industry, Value (US$ Bn), 2017‒2031
Figure 216: Middle East & Africa Conventional and Rapid Prototyping Market, Incremental Opportunity, by End-use Industry, Value (US$ Bn), 2022‒2031
Figure 217: Middle East & Africa Conventional and Rapid Prototyping Market Share Analysis, by End-use Industry, 2021 and 2031
Figure 218: Middle East & Africa Conventional and Rapid Prototyping Market Projections by Country and Sub-region, Value (US$ Bn), 2017‒2031
Figure 219: Middle East & Africa Conventional and Rapid Prototyping Market, Incremental Opportunity, by Country and Sub-region, Value (US$ Bn), 2022‒2031
Figure 220: Middle East & Africa Conventional and Rapid Prototyping Market Share Analysis, by Country and Sub-region, 2021 and 2031
Figure 221: South America Conventional and Rapid Prototyping Market, Year-on-Year Growth, Overview, 2021‒2031
Figure 222: South America Conventional and Rapid Prototyping Market Projections by Process, Value (US$ Bn), 2017‒2031
Figure 223: South America Conventional and Rapid Prototyping Market, Incremental Opportunity, by Process, Value (US$ Bn), 2022‒2031
Figure 224: South America Conventional and Rapid Prototyping Market Share Analysis, by Process, 2021 and 2031
Figure 225: South America Conventional and Rapid Prototyping Market Projections by Type, Value (US$ Bn), 2017‒2031
Figure 226: South America Conventional and Rapid Prototyping Market, Incremental Opportunity, by Type, Value (US$ Bn), 2022‒2031
Figure 227: South America Conventional and Rapid Prototyping Market Share Analysis, by Type, 2021 and 2031
Figure 228: South America Conventional and Rapid Prototyping Market Projections by Material, Value (US$ Bn), 2017‒2031
Figure 229: South America Conventional and Rapid Prototyping Market, Incremental Opportunity, by Material, Value (US$ Bn), 2022‒2031
Figure 230: South America Conventional and Rapid Prototyping Market Share Analysis, by Material, 2021 and 2031
Figure 231: South America Conventional and Rapid Prototyping Market Projections by End-use Industry, Value (US$ Bn), 2017‒2031
Figure 232: South America Conventional and Rapid Prototyping Market, Incremental Opportunity, by End-use Industry, Value (US$ Bn), 2022‒2031
Figure 233: South America Conventional and Rapid Prototyping Market Share Analysis, by End-use Industry, 2021 and 2031
Figure 234: South America Conventional and Rapid Prototyping Market Projections by Country and Sub-region, Value (US$ Bn), 2017‒2031
Figure 235: South America Conventional and Rapid Prototyping Market, Incremental Opportunity, by Country and Sub-region, Value (US$ Bn), 2022‒2031
Figure 236: South America Conventional and Rapid Prototyping Market Share Analysis, by Country and Sub-region, 2021 and 2031
Copyright © Transparency Market Research, Inc. All Rights reserved
Trust Online


Conventional and Rapid Prototyping Market