
Analysts’ Viewpoint on Market Scenario
Ethyl lactate proves to be a successful ‘green solvent’ that finds applications in end-use industries such as food & beverages, pharmaceuticals, cosmetics & personal care, etc. There has been increase in demand for greener alternatives in various industrial applications. Ethyl lactate is biodegradable and less toxic, hence acts as an excellent substitute for traditional petroleum-based solvents. Ethyl lactate is widely used in the pharmaceutical sector for applications such as tablet coating, granulation, taste-masking, and inhalation propellants.
As the pharma and food & beverages industry deals with products meant for human consumption, the use of solvent should be free from any contamination. Hence, ethyl lactate is extensively being employed in various industries. Ethyl lactate has been proven to be a suitable alternative to hexane, ethyl acetate, acetone, ethanol, methanol, NMP, toluene, and xylene among many others. This is also estimated to offer significant opportunities for market players during the forecast period.
The global ethyl lactate market is gaining traction as a ‘green solvent’ due to its biodegradability, non-toxicity, low vaporization, non-corrosive, and non-ozone-depleting nature. It is widely used as a food additive for flavor & fragrance and also in the production of perfumes. It is non-carcinogenic; and has low volatility and low viscosity. It is completely biodegradable to carbon dioxide (CO) and water. Hence, ethyl lactate is increasingly used in pharmaceutical sector for the dispersal of bioactive compounds in pharmaceutical formulations.
Ethyl lactate is also used as an industrial cleaning solvent. It is an effective paint stripper and graffiti remover to replace traditional solvents like NMP, toluene, acetone, and xylene. It has also been effectively used as a pre-production surface preparation and cleaning. It has significant applications in removing greases, oils, adhesives, and solid fuels, and as pre-bonding and pre-coating cleaning of metal surfaces. Ethyl lactate evaporates slowly, hence it is an effective alternative to traditional solvents. Rise in need for replacing petroleum-based solvents in various end-use industries such as food & beverages, pharmaceuticals, paints & coatings, etc. is expected to fuel the global ethyl lactate industry during the forecast period.
Request a sample to get extensive insights into the Ethyl Lactate Market
Ethyl lactate is used as a solvent and an industrial cleaning agent. It dissolves resins, pigments, adhesives, etc. It can be used as a solvent for paints, inks, and the composition of agricultural chemicals and pesticides. Ethyl Lactate has been increasingly used as a degreaser to replace traditional organic solvent, trichloroethylene. It is also replacing toxic solvents like methylene chloride and chloroform which are harmful to health.
Ethyl lactate can successfully replace solvents like hexane, ethyl acetate, acetone, ethanol, and methanol owing to its low toxicity, flammability, and low vaporization. Increased safety standards for employees and the environment, improved effectiveness, and reduced cost of manufacturing has made it an attractive alternative to petroleum-based solvents.
Ethyl Lactate has been approved by the United States Food and Drug Administration (FDA) for its use as a food additive, and for the dispersal of bioactive compounds in pharmaceutical formulations because of being less toxic, non-carcinogenic with low volatility, and low viscosity. Various regulations imposed by several governments around the world on reducing the presence of residual solvents in pharmaceuticals and food & beverage sectors.
Rise in government initiatives to encourage industries to make use of ecologically benign and safe green solvents is contributing to market growth. Hence, industries are opting for safer alternatives for petroleum-based solvents i.e. ethyl lactate.
Various regulations are being imposed to control and reduce the amount of VOCs and other emissions caused due to the usage of harmful organic and traditional solvents. Few such regulations are US EPA National Volatile Organic Compound Emission standards, the European Union Directive 2004/42/EC, and Environment Canada regulation for Volatile Organic Compound (VOC) Concentration Limits.
Request a custom report on Ethyl Lactate Market
Ethyl lactate, when diluted possesses a mild, buttery, creamy odor with hints of fruit and coconut which makes it a good choice as a food additive for flavoring and fragrances. It is also used as a spice to modulate fruit, food, and wine flavors. Ethyl lactate acts as a green solvent. It is also a biodegradable substance, hence being extensively used in the food & beverage sector.
Demand for organic compounds that are safe for human consumption and free from contamination by toxic substances or solvents is increasing across the globe. Increase in demand for green solvents in various sectors, especially food & beverage is anticipated to positively impact the market progress in the near future.
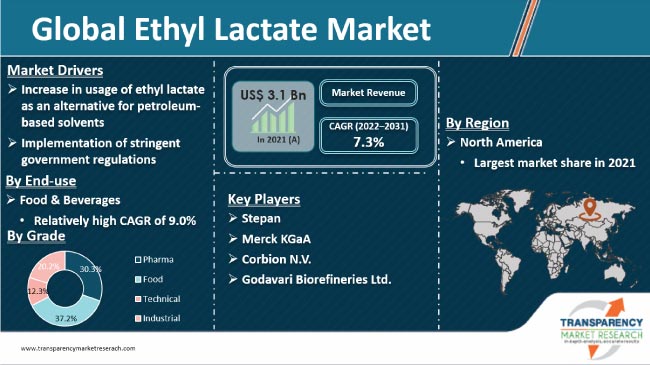
Several governments are imposing stringent regulations on the usage of toxic substances in food products in order to achieve safety standards. Food grade accounted for 37.2% share of the global market in 2021. The segment is estimated to advance at a CAGR of 8.9% during the forecast period.
North America dominated the global market in 2021 with 36.9% share, and is expected to grow at a CAGR of 7.1% during the forecast period. Market development in North America is majorly due to the increase in demand for ethyl lactate from industries such as food & beverages, pharmaceuticals, and cosmetics & personal care.
Stringent regulations and permissible limits set on various toxins with respect to organic solvents used in end-use industries especially food & beverages, and paints & coatings in North America have led industries to find a better alternative to petroleum-based solvents. Hence, the demand for ethyl lactate as a “green solvent” is increasing across several end-use industries in the region. Rapid growth in food & beverage, and pharmaceutical industries in the region is expected to fuel the market expansion during the forecast period.
The global market is fragmented, with a few large and medium-sized players controlling majority of the share. The top few players operating in the global ethyl lactate industry cumulatively held for 35-40% share in 2021. These players focus on business expansion through acquisitions, capacity expansion, mergers & acquisitions, and financial restructuring and investments. Stepan, Corbion, Merck KGaA, and Godavari Biorefineries Ltd. are prominent entities operating in the global ethyl lactate market.
Key players have been profiled in the global market report based on parameters such as company overview, financial overview, business strategies, product portfolio, business segments, and recent developments.
|
Attribute |
Detail |
|
Market Size Value in 2021 |
US$ 3.1 Bn |
|
Market Forecast Value in 2031 |
US$ 6.2 Bn |
|
Growth Rate (CAGR) |
7.3% |
|
Forecast Period |
2022–2031 |
|
Historical Data Available for |
2020 |
|
Quantitative Units |
US$ Bn for Value and Kilo Tons for Volume |
|
Market Analysis |
It includes cross segment analysis at Europe as well as country level. Furthermore, qualitative analysis includes drivers, restraints, opportunities, key trends, Porter’s Five Forces analysis, value chain analysis, and key trend analysis. |
|
Competition Landscape |
|
|
Format |
Electronic (PDF) + Excel |
|
Market Segmentation |
|
|
Regions Covered |
|
|
Countries Covered |
|
|
Companies Profiled |
|
|
Customization Scope |
Available upon request |
|
Pricing |
Available upon request |
The ethyl lactate industry stood at US$ 3.1 Bn in 2021
The market is expected to grow at a CAGR of 7.3% from 2022 to 2031
Increase in usage of ethyl lactate as an alternative for petroleum-based solvents and implementation of stringent government regulations
Food & beverages was the largest segment that held 47.3% share in 2021
North America was the most lucrative region and accounted for 36.9% share in 2021
Stepan, Merck KgaA, Corbion N.V., and Godavari Biorefineries Ltd
1. Executive Summary
1.1. Ethyl Lactate Market Snapshot
1.2. Key Market Trends
1.3. Current Market and Future Potential
1.4. TMR’s Growth Opportunity Wheel
2. Market Overview
2.1. Market Segmentation
2.2. Market Indicators
2.3. Market Definitions
2.4. Market Dynamics
2.4.1. Drivers
2.4.2. Restraints
2.4.3. Opportunities
2.5. Porter’s Five Forces Analysis
2.6. Value Chain Analysis
2.6.1. List of Service Providers
2.6.2. List of Potential Customers
2.7. Product Specification Analysis
2.8. Overview of Manufacturing Process
2.9. Cost Structure Analysis
3. COVID-19 Impact Analysis
4. Impact of Current Geopolitical Scenario on the Market
5. Global Production Output Analysis, by Region, 2021
5.1. North America
5.2. Europe
5.3. Asia Pacific
5.4. Latin America
5.5. Middle East & Africa
6. Price Trend Analysis and Forecast, 2020-2031
6.1. Price Comparison Analysis by Grade
6.2. Price Comparison Analysis by Region
7. Global Ethyl Lactate Market Analysis and Forecast, by Grade, 2020-2031
7.1. Introduction and Definitions
7.2. Global Ethyl Lactate Market Volume (Kilo Tons) and Value (US$ Mn) Forecast, by Grade, 2020-2031
7.2.1. Pharma
7.2.2. Food
7.2.3. Technical
7.2.4. Industrial
7.3. Global Ethyl Lactate Market Attractiveness, by Grade
8. Global Ethyl Lactate Market Analysis and Forecast, by End-use, 2020-2031
8.1. Introduction and Definitions
8.2. Global Ethyl Lactate Market Volume (Kilo Tons) and Value (US$ Mn) Forecast, by End-use,
8.2.1. Food & Beverages
8.2.2. Electronics
8.2.3. Paints & Coatings
8.2.4. Packaging & Printing ink
8.2.5. Pharmaceuticals
8.2.6. Cosmetics & Personal Care
8.2.7. Industrial Cleaning
8.2.8. Agrochemicals
8.2.9. Others
8.3. Global Ethyl Lactate Market Attractiveness, by End-use
9. Global Ethyl Lactate Market Analysis and Forecast, by Region, 2020-2031
9.1. Key Findings
9.2. Global Ethyl Lactate Market Volume (Kilo Tons) and Value (US$ Mn) Forecast, by Region, 2020-2031
9.2.1. North America
9.2.2. Europe
9.2.3. Asia Pacific
9.2.4. Latin America
9.2.5. Middle East & Africa
9.3. Global Ethyl Lactate Market Attractiveness, by Region
10. North America Ethyl Lactate Market Analysis and Forecast, 2020-2031
10.1. Key Findings
10.2. North America Ethyl Lactate Market Volume (Kilo Tons) and Value (US$ Mn) Forecast, by Grade, 2020-2031
10.3. North America Ethyl Lactate Market Volume (Kilo Tons) and Value (US$ Mn) Forecast, by End-use, 2020-2031
10.4. North America Ethyl Lactate Market Volume (Kilo Tons) and Value (US$ Mn) Forecast, by Country, 2020-2031
10.4.1. U.S. Ethyl Lactate Market Volume (Kilo Tons) and Value (US$ Mn) Forecast, by Grade, 2020-2031
10.4.2. U.S. Ethyl Lactate Market Volume (Kilo Tons) and Value (US$ Mn) Forecast, by End-use, 2020-2031
10.4.3. Canada Ethyl Lactate Market Volume (Kilo Tons) and Value (US$ Mn) Forecast, by Grade, 2020-2031
10.4.4. Canada Ethyl Lactate Market Volume (Kilo Tons) and Value (US$ Mn) Forecast, by End-use, 2020-2031
10.5. North America Ethyl Lactate Market Attractiveness Analysis
11. Europe Ethyl Lactate Market Analysis and Forecast, 2020-2031
11.1. Key Findings
11.2. Europe Ethyl Lactate Market Volume (Kilo Tons) and Value (US$ Mn) Forecast, by Grade, 2020-2031
11.3. Europe Ethyl Lactate Market Volume (Kilo Tons) and Value (US$ Mn) Forecast, by End-use, 2020-2031
11.4. Europe Ethyl Lactate Market Volume (Kilo Tons) and Value (US$ Mn) Forecast, by Country and Sub-region, 2020-2031
11.4.1. Germany Ethyl Lactate Market Volume (Kilo Tons) and Value (US$ Mn) Forecast, by Grade, 2020-2031
11.4.2. Germany Ethyl Lactate Market Volume (Kilo Tons) and Value (US$ Mn) Forecast, by End-use, 2020-2031
11.4.3. France Ethyl Lactate Market Volume (Kilo Tons) and Value (US$ Mn) Forecast, by Grade, 2020-2031
11.4.4. France Ethyl Lactate Market Volume (Kilo Tons) and Value (US$ Mn) Forecast, by End-use, 2020-2031
11.4.5. U.K. Ethyl Lactate Market Volume (Kilo Tons) and Value (US$ Mn) Forecast, by Grade, 2020-2031
11.4.6. U.K. Ethyl Lactate Market Volume (Kilo Tons) and Value (US$ Mn) Forecast, by End-use, 2020-2031
11.4.7. Italy Ethyl Lactate Market Volume (Kilo Tons) and Value (US$ Mn) Forecast, by Grade, 2020-2031
11.4.8. Italy Ethyl Lactate Market Volume (Kilo Tons) and Value (US$ Mn) Forecast, by End-use, 2020-2031
11.4.9. Russia & CIS Ethyl Lactate Market Volume (Kilo Tons) and Value (US$ Mn) Forecast, by Grade, 2020-2031
11.4.10. Russia & CIS Ethyl Lactate Market Volume (Kilo Tons) and Value (US$ Mn) Forecast, by End-use, 2020-2031
11.4.11. Rest of Europe Ethyl Lactate Market Volume (Kilo Tons) and Value (US$ Mn) Forecast, by Grade, 2020-2031
11.4.12. Rest of Europe Ethyl Lactate Market Volume (Kilo Tons) and Value (US$ Mn) Forecast, by End-use, 2020-2031
11.5. Europe Ethyl Lactate Market Attractiveness Analysis
12. Asia Pacific Ethyl Lactate Market Analysis and Forecast, 2020-2031
12.1. Key Findings
12.2. Asia Pacific Ethyl Lactate Market Volume (Kilo Tons) and Value (US$ Mn) Forecast, by Grade, 2020-2031
12.3. Asia Pacific Ethyl Lactate Market Volume (Kilo Tons) and Value (US$ Mn) Forecast, by End-use, 2020-2031
12.4. Asia Pacific Ethyl Lactate Market Volume (Kilo Tons) and Value (US$ Mn) Forecast, by Country and Sub-region, 2020-2031
12.4.1. China Ethyl Lactate Market Volume (Kilo Tons) and Value (US$ Mn) Forecast, by Grade, 2020-2031
12.4.2. China Ethyl Lactate Market Volume (Kilo Tons) and Value (US$ Mn) Forecast, by End-use, 2020-2031
12.4.3. Japan Ethyl Lactate Market Volume (Kilo Tons) and Value (US$ Mn) Forecast, by Grade, 2020-2031
12.4.4. Japan Ethyl Lactate Market Volume (Kilo Tons) and Value (US$ Mn) Forecast, by End-use, 2020-2031
12.4.5. India Ethyl Lactate Market Volume (Kilo Tons) and Value (US$ Mn) Forecast, by Grade, 2020-2031
12.4.6. India Ethyl Lactate Market Volume (Kilo Tons) and Value (US$ Mn) Forecast, by End-use, 2020-2031
12.4.7. ASEAN Ethyl Lactate Market Volume (Kilo Tons) and Value (US$ Mn) Forecast, by Grade, 2020-2031
12.4.8. ASEAN Ethyl Lactate Market Volume (Kilo Tons) and Value (US$ Mn) Forecast, by End-use, 2020-2031
12.4.9. Rest of Asia Pacific Ethyl Lactate Market Volume (Kilo Tons) and Value (US$ Mn) Forecast, by Grade, 2020-2031
12.4.10. Rest of Asia Pacific Ethyl Lactate Market Volume (Kilo Tons) and Value (US$ Mn) Forecast, by End-use, 2020-2031
12.5. Asia Pacific Ethyl Lactate Market Attractiveness Analysis
13. Latin America Ethyl Lactate Market Analysis and Forecast, 2020-2031
13.1. Key Findings
13.2. Latin America Ethyl Lactate Market Volume (Kilo Tons) and Value (US$ Mn) Forecast, by Grade, 2020-2031
13.3. Latin America Ethyl Lactate Market Volume (Kilo Tons) and Value (US$ Mn) Forecast, by End-use, 2020-2031
13.4. Latin America Ethyl Lactate Market Volume (Kilo Tons) and Value (US$ Mn) Forecast, by Country and Sub-region, 2020-2031
13.4.1. Brazil Ethyl Lactate Market Volume (Kilo Tons) and Value (US$ Mn) Forecast, by Grade, 2020-2031
13.4.2. Brazil Ethyl Lactate Market Volume (Kilo Tons) and Value (US$ Mn) Forecast, by End-use, 2020-2031
13.4.3. Mexico Ethyl Lactate Market Volume (Kilo Tons) and Value (US$ Mn) Forecast, by Grade, 2020-2031
13.4.4. Mexico Ethyl Lactate Market Volume (Kilo Tons) and Value (US$ Mn) Forecast, by End-use, 2020-2031
13.4.5. Rest of Latin America Ethyl Lactate Market Volume (Kilo Tons) and Value (US$ Mn) Forecast, by Grade, 2020-2031
13.4.6. Rest of Latin America Ethyl Lactate Market Volume (Kilo Tons) and Value (US$ Mn) Forecast, by End-use, 2020-2031
13.5. Latin America Ethyl Lactate Market Attractiveness Analysis
14. Middle East & Africa Ethyl Lactate Market Analysis and Forecast, 2020-2031
14.1. Key Findings
14.2. Middle East & Africa Ethyl Lactate Market Volume (Kilo Tons) and Value (US$ Mn) Forecast, by Grade, 2020-2031
14.3. Middle East & Africa Ethyl Lactate Market Volume (Kilo Tons) and Value (US$ Mn) Forecast, by End-use, 2020-2031
14.4. Middle East & Africa Ethyl Lactate Market Volume (Kilo Tons) and Value (US$ Mn) Forecast, by Country and Sub-region, 2020-2031
14.4.1. GCC Ethyl Lactate Market Volume (Kilo Tons) and Value (US$ Mn) Forecast, by Grade, 2020-2031
14.4.2. GCC Ethyl Lactate Market Volume (Kilo Tons) and Value (US$ Mn) Forecast, by End-use, 2020-2031
14.4.3. South Africa Ethyl Lactate Market Volume (Kilo Tons) and Value (US$ Mn) Forecast, by Grade, 2020-2031
14.4.4. South Africa Ethyl Lactate Market Volume (Kilo Tons) and Value (US$ Mn) Forecast, by End-use, 2020-2031
14.4.5. Rest of Middle East & Africa Ethyl Lactate Market Volume (Kilo Tons) and Value (US$ Mn) Forecast, by Grade, 2020-2031
14.4.6. Rest of Middle East & Africa Ethyl Lactate Market Volume (Kilo Tons) and Value (US$ Mn) Forecast, by End-use, 2020-2031
14.5. Middle East & Africa Ethyl Lactate Market Attractiveness Analysis
15. Global Ethyl Lactate Company Market Share Analysis, 2021
15.1. Competition Matrix
15.2. Market Footprint Analysis
15.2.1. By Grade
15.2.2. By End-use
15.3. Company Profiles (Details – Overview, Financials, Recent Developments, and Strategy)
15.3.1. Godavari Biorefineries Ltd.
15.3.1.1. Company Description
15.3.1.2. Business Overview
15.3.1.3. Financial Details
15.3.1.4. Strategic Overview
15.3.2. Aurochemicals
15.3.2.1. Company Description
15.3.2.2. Business Overview
15.3.2.3. Financial Details
15.3.2.4. Strategic Overview
15.3.3. Vertec Biosolvents Inc.
15.3.3.1. Company Description
15.3.3.2. Business Overview
15.3.3.3. Financial Details
15.3.3.4. Strategic Overview
15.3.4. Merck KGaA
15.3.4.1. Company Description
15.3.4.2. Business Overview
15.3.4.3. Financial Details
15.3.4.4. Strategic Overview
15.3.5. Corbion N.V.
15.3.5.1. Company Description
15.3.5.2. Business Overview
15.3.5.3. Financial Details
15.3.5.4. Strategic Overview
15.3.6. Henan Jindan Lactic Acid Technology Co., Ltd.
15.3.6.1. Company Description
15.3.6.2. Business Overview
15.3.6.3. Financial Details
15.3.6.4. Strategic Overview
15.3.7. Stepan
15.3.7.1. Company Description
15.3.7.2. Business Overview
15.3.7.3. Financial Details
15.3.7.4. Strategic Overview
15.3.8. Musashino Chemical Laboratory Ltd.
15.3.8.1. Company Description
15.3.8.2. Business Overview
15.3.8.3. Financial Details
15.3.8.4. Strategic Overview
15.3.9. TCI CHEMICALS (INDIA) PRIVATE LIMITED
15.3.9.1. Company Description
15.3.9.2. Business Overview
15.3.9.3. Financial Details
15.3.9.4. Strategic Overview
15.3.10. The Archer-Daniels-Midland Company
15.3.10.1. Company Description
15.3.10.2. Business Overview
15.3.10.3. Financial Details
15.3.10.4. Strategic Overview
15.3.11. Qingdao Abel Technology Co. Ltd.
15.3.11.1. Company Description
15.3.11.2. Business Overview
15.3.11.3. Financial Details
15.3.11.4. Strategic Overview
15.3.12. Shenzhen Esun Industrial Co., Ltd.
15.3.12.1. Company Description
15.3.12.2. Business Overview
15.3.12.3. Financial Details
15.3.12.4. Strategic Overview
15.3.13. Zhengzhou Tianrun Lactic Acid Co. Ltd.
15.3.13.1. Company Description
15.3.13.2. Business Overview
15.3.13.3. Financial Details
15.3.13.4. Strategic Overview
16. Primary Research: Key Insights
17. Appendix
List of Tables
Table 01: Global Ethyl Lactate Market Volume (Kilo Tons) and Value (US$ Mn) Forecast, by Grade, 2020-2031
Table 02: Global Ethyl Lactate Market Volume (Kilo Tons) and Value (US$ Mn) Forecast, by End-use, 2020-2031
Table 03: Global Ethyl Lactate Market Volume (Kilo Tons) and Value (US$ Mn) Forecast, by Region, 2020-2031
Table 04: North America Ethyl Lactate Market Volume (Kilo Tons) and Value (US$ Mn) Forecast, by Grade, 2020-2031
Table 05: North America Ethyl Lactate Market Volume (Kilo Tons) and Value (US$ Mn) Forecast, by End-use, 2020-2031
Table 06: North America Ethyl Lactate Market Volume (Kilo Tons) and Value (US$ Mn) Forecast, by Country, 2020-2031
Table 07: U.S. Ethyl Lactate Market Volume (Kilo Tons) and Value (US$ Mn) Forecast, by Grade, 2020-2031
Table 08: U.S. Ethyl Lactate Market Volume (Kilo Tons) and Value (US$ Mn) Forecast, by End-use, 2020-2031
Table 09: Canada Ethyl Lactate Market Volume (Kilo Tons) and Value (US$ Mn) Forecast, by Grade, 2020-2031
Table 10: Canada Ethyl Lactate Market Volume (Kilo Tons) and Value (US$ Mn) Forecast, by End-use, 2020-2031
Table 11: Europe Ethyl Lactate Market Volume (Kilo Tons) and Value (US$ Mn) Forecast, by Grade, 2020-2031
Table 12: Europe Ethyl Lactate Market Volume (Kilo Tons) and Value (US$ Mn) Forecast, by End-use, 2020-2031
Table 13: Europe Ethyl Lactate Market Volume (Kilo Tons) and Value (US$ Mn) Forecast, by Country & Sub-region, 2020-2031
Table 14: Germany Ethyl Lactate Market Volume (Kilo Tons) and Value (US$ Mn) Forecast, by Grade, 2020-2031
Table 15: Germany Ethyl Lactate Market Volume (Kilo Tons) and Value (US$ Mn) Forecast, by End-use, 2020-2031
Table 16: U.K. Ethyl Lactate Market Volume (Kilo Tons) and Value (US$ Mn) Forecast, by Grade, 2020-2031
Table 17: U.K. Ethyl Lactate Market Volume (Kilo Tons) and Value (US$ Mn) Forecast, by End-use, 2020-2031
Table 18: France Ethyl Lactate Market Volume (Kilo Tons) and Value (US$ Mn) Forecast, by Grade, 2020-2031
Table 19: France Ethyl Lactate Market Volume (Kilo Tons) and Value (US$ Mn) Forecast, by End-use, 2020-2031
Table 20: Italy Ethyl Lactate Market Volume (Kilo Tons) and Value (US$ Mn) Forecast, by Grade, 2020-2031
Table 21: Italy Ethyl Lactate Market Volume (Kilo Tons) and Value (US$ Mn) Forecast, by End-use, 2020-2031
Table 22: Spain Ethyl Lactate Market Volume (Kilo Tons) and Value (US$ Mn) Forecast, by Grade, 2020-2031
Table 23: Spain Ethyl Lactate Market Volume (Kilo Tons) and Value (US$ Mn) Forecast, by End-use, 2020-2031
Table 24: Russia & CIS Ethyl Lactate Market Volume (Kilo Tons) and Value (US$ Mn) Forecast, by Grade, 2020-2031
Table 25: Russia & CIS Ethyl Lactate Market Volume (Kilo Tons) and Value (US$ Mn) Forecast, by End-use, 2020-2031
Table 26: Rest of Europe Ethyl Lactate Market Volume (Kilo Tons) and Value (US$ Mn) Forecast, by Grade, 2020-2031
Table 27: Rest of Europe Ethyl Lactate Market Volume (Kilo Tons) and Value (US$ Mn) Forecast, by End-use, 2020-2031
Table 28: Asia Pacific Ethyl Lactate Market Volume (Kilo Tons) and Value (US$ Mn) Forecast, by Grade, 2020-2031
Table 29: Asia Pacific Ethyl Lactate Market Volume (Kilo Tons) and Value (US$ Mn) Forecast, by End-use, 2020-2031
Table 30: Asia Pacific Ethyl Lactate Market Volume (Kilo Tons) and Value (US$ Mn) Forecast, by Country & Sub-region, 2020-2031
Table 31: China Ethyl Lactate Market Volume (Kilo Tons) and Value (US$ Mn) Forecast, by Grade, 2020-2031
Table 32: China Ethyl Lactate Market Volume (Kilo Tons) and Value (US$ Mn) Forecast, by End-use, 2020-2031
Table 33: Japan Ethyl Lactate Market Volume (Kilo Tons) and Value (US$ Mn) Forecast, by Grade, 2020-2031
Table 34: Japan Ethyl Lactate Market Volume (Kilo Tons) and Value (US$ Mn) Forecast, by End-use, 2020-2031
Table 35: India Ethyl Lactate Market Volume (Kilo Tons) and Value (US$ Mn) Forecast, by Grade, 2020-2031
Table 36: India Ethyl Lactate Market Volume (Kilo Tons) and Value (US$ Mn) Forecast, by End-use, 2020-2031
Table 37: ASEAN Ethyl Lactate Market Volume (Kilo Tons) and Value (US$ Mn) Forecast, by Grade, 2020-2031
Table 38: ASEAN Ethyl Lactate Market Volume (Kilo Tons) and Value (US$ Mn) Forecast, by End-use, 2020-2031
Table 39: Rest of Asia Pacific Ethyl Lactate Market Volume (Kilo Tons) and Value (US$ Mn) Forecast, by Grade, 2020-2031
Table 40: Rest of Asia Pacific Ethyl Lactate Market Volume (Kilo Tons) and Value (US$ Mn) Forecast, by End-use, 2020-2031
Table 41: Latin America Ethyl Lactate Market Volume (Kilo Tons) and Value (US$ Mn) Forecast, by Grade, 2020-2031
Table 42: Latin America Ethyl Lactate Market Volume (Kilo Tons) and Value (US$ Mn) Forecast, by End-use, 2020-2031
Table 43: Latin America Ethyl Lactate Market Volume (Kilo Tons) and Value (US$ Mn) Forecast, by Country & Sub-region, 2020-2031
Table 44: Brazil Ethyl Lactate Market Volume (Kilo Tons) and Value (US$ Mn) Forecast, by Grade, 2020-2031
Table 45: Brazil Ethyl Lactate Market Volume (Kilo Tons) and Value (US$ Mn) Forecast, by End-use, 2020-2031
Table 46: Mexico Ethyl Lactate Market Volume (Kilo Tons) and Value (US$ Mn) Forecast, by Grade, 2020-2031
Table 47: Mexico Ethyl Lactate Market Volume (Kilo Tons) and Value (US$ Mn) Forecast, by End-use, 2020-2031
Table 48: Rest of Latin America Ethyl Lactate Market Volume (Kilo Tons) and Value (US$ Mn) Forecast, by Grade, 2020-2031
Table 49: Rest of Latin America Ethyl Lactate Market Volume (Kilo Tons) and Value (US$ Mn) Forecast, by End-use, 2020-2031
Table 50: Middle East & Africa Ethyl Lactate Market Volume (Kilo Tons) and Value (US$ Mn) Forecast, by Grade, 2020-2031
Table 51: Middle East & Africa Ethyl Lactate Market Volume (Kilo Tons) and Value (US$ Mn) Forecast, by End-use, 2020-2031
Table 52: Middle East & Africa Ethyl Lactate Market Volume (Kilo Tons) and Value (US$ Mn) Forecast, by Country & Sub-region, 2020-2031
Table 53: GCC Ethyl Lactate Market Volume (Kilo Tons) and Value (US$ Mn) Forecast, by Grade, 2020-2031
Table 54: GCC Ethyl Lactate Market Volume (Kilo Tons) and Value (US$ Mn) Forecast, by End-use, 2020-2031
Table 55: South Africa Ethyl Lactate Market Volume (Kilo Tons) and Value (US$ Mn) Forecast, by Grade, 2020-2031
Table 56: South Africa Ethyl Lactate Market Volume (Kilo Tons) and Value (US$ Mn) Forecast, by End-use, 2020-2031
Table 57: Rest of Middle East & Africa Ethyl Lactate Market Volume (Kilo Tons) and Value (US$ Mn) Forecast, by Grade, 2020-2031
Table 58: Rest of Middle East & Africa Ethyl Lactate Market Volume (Kilo Tons) and Value (US$ Mn) Forecast, by End-use, 2020-2031
List of Figures
Figure 01: Global Ethyl Lactate Market Volume (Kilo Tons) and Value (US$ Mn), 2020-2031
Figure 02: Global Ethyl Lactate Market Share Analysis, by Grade
Figure 03: Global Ethyl Lactate Market Attractiveness Analysis, by Grade
Figure 04: Global Ethyl Lactate Market Share Analysis, by End-use
Figure 05: Global Ethyl Lactate Market Attractiveness Analysis, by End-use
Figure 06: Global Ethyl Lactate Market Share Analysis, by Region
Figure 07: Global Ethyl Lactate Market Attractiveness Analysis, by Region
Figure 08: North America Ethyl Lactate Market Volume (Kilo Tons) and Value (US$ Mn), 2020-2031
Figure 09: North America Ethyl Lactate Market Value Share Analysis, by Country
Figure 10: North America Ethyl Lactate Market Attractiveness Analysis, by Country
Figure 11: North America Ethyl Lactate Market Share Analysis, by Grade
Figure 12: North America Ethyl Lactate Market Attractiveness Analysis, by Grade
Figure 13: North America Ethyl Lactate Market Share Analysis, by End-use
Figure 14: North America Ethyl Lactate Market Attractiveness Analysis, by End-use
Figure 15: Europe Ethyl Lactate Market Volume (Kilo Tons) and Value (US$ Mn), 2020-2031
Figure 16: Europe Ethyl Lactate Market Share Analysis, by Country and Sub-region
Figure 17: Europe Ethyl Lactate Market Attractiveness Analysis, by Country and Sub-region
Figure 18: Europe Ethyl Lactate Market Share Analysis, by Grade
Figure 19: Europe Ethyl Lactate Market Attractiveness Analysis, by Grade
Figure 20: Europe Ethyl Lactate Market Share Analysis, by End-use
Figure 21: Europe Ethyl Lactate Market Attractiveness Analysis, by End-use
Figure 22: Asia Pacific Ethyl Lactate Market Volume (Kilo Tons) and Value (US$ Mn), 2020-2031
Figure 23: Asia Pacific Ethyl Lactate Market Value Share Analysis, by Country and Sub-region
Figure 24: Asia Pacific Ethyl Lactate Market Attractiveness Analysis, by Country and Sub-region
Figure 25: Asia Pacific Ethyl Lactate Market Share Analysis, by Grade
Figure 26: Asia Pacific Ethyl Lactate Market Attractiveness Analysis, by Grade
Figure 27: Asia Pacific Ethyl Lactate Market Share Analysis, by End-use
Figure 28: Asia Pacific Ethyl Lactate Market Attractiveness Analysis, by End-use
Figure 29: Latin America Ethyl Lactate Market Volume (Kilo Tons) and Value (US$ Mn), 2020-2031
Figure 30: Latin America Ethyl Lactate Market Share Analysis, by Country and Sub-region
Figure 31: Latin America Ethyl Lactate Market Attractiveness Analysis, by Country and Sub-region
Figure 32: Latin America Ethyl Lactate Market Share Analysis, by Grade
Figure 33: Latin America Ethyl Lactate Market Attractiveness Analysis, by Grade
Figure 34: Latin America Ethyl Lactate Market Share Analysis, by End-use
Figure 35: Latin America Ethyl Lactate Market Attractiveness Analysis, by End-use
Figure 36: Middle East & Africa Ethyl Lactate Market Volume (Kilo Tons) and Value (US$ Mn), 2020-2031
Figure 37: Middle East & Africa Ethyl Lactate Market Share Analysis, by Country and Sub-region
Figure 38: Middle East & Africa Ethyl Lactate Market Attractiveness Analysis, by Country and Sub-region
Figure 39: Middle East & Africa Ethyl Lactate Market Share Analysis, by Grade
Figure 40: Middle East & Africa Ethyl Lactate Market Attractiveness Analysis, by Grade
Figure 41: Middle East & Africa Ethyl Lactate Market Share Analysis, by End-use
Figure 42: Middle East & Africa Ethyl Lactate Market Attractiveness Analysis, by End-use
Figure 43: Company Market Share Analysis, 2018
Copyright © Transparency Market Research, Inc. All Rights reserved
Trust Online


Ethyl Lactate Market