Frac Sand Market Size 2024-2028
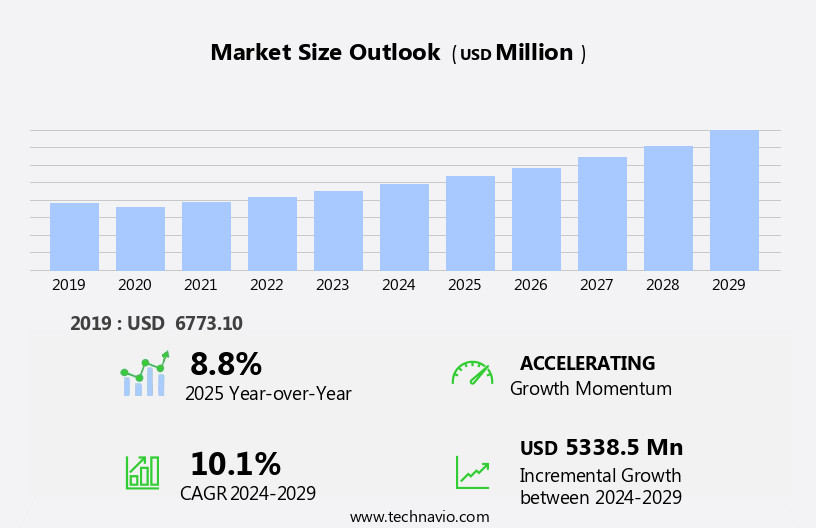
The frac sand market size is forecast to increase by USD 4.5 billion at a CAGR of 9.38% between 2023 and 2028.
- The market is experiencing significant growth due to the abundance of unconventional oil and gas resources in North America. The increasing petroleum refining industry is driving the demand for frac sand as it is an essential component in the hydraulic fracturing process. Moreover, the growing trend towards renewable energy is also creating opportunities for frac sand in the production of certain types of renewable energy, such as geothermal and solar power.
- However, challenges such as high transportation costs and environmental concerns remain key issues in the market. Producers must navigate these challenges to maintain profitability and meet the growing demand for frac sand.
- Overall, the market is expected to continue its growth trajectory, driven by the ongoing exploration and production of unconventional resources and the evolving energy landscape.
What will be the Size of the Frac Sand Market During the Forecast Period?
Request Free Sample
1 Executive Summary
- 1.1 Market overview
- Executive Summary - Chart on Market Overview
- Executive Summary - Data Table on Market Overview
- Executive Summary - Chart on Global Market Characteristics
- Executive Summary - Chart on Market by Geography
- Executive Summary - Chart on Market Segmentation by Application
- Executive Summary - Chart on Market Segmentation by Type
- Executive Summary - Chart on Incremental Growth
- Executive Summary - Data Table on Incremental Growth
- Executive Summary - Chart on Company Market Positioning
2 Market Landscape
- 2.1 Market ecosystem
- Parent Market
- Data Table on - Parent Market
- 2.2 Market characteristics
- Market characteristics analysis
3 Market Sizing
- 3.1 Market definition
- Offerings of companies included in the market definition
- 3.2 Market segment analysis
- 3.4 Market outlook: Forecast for 2023-2028
- Chart on Global - Market size and forecast 2023-2028 ($ million)
- Data Table on Global - Market size and forecast 2023-2028 ($ million)
- Chart on Global Market: Year-over-year growth 2023-2028 (%)
- Data Table on Global Market: Year-over-year growth 2023-2028 (%)
4 Historic Market Size
- 4.1 Global Frac Sand Market 2018 - 2022
- Historic Market Size - Data Table on Global Frac Sand Market 2018 - 2022 ($ million)
- 4.2 Application segment analysis 2018 - 2022
- Historic Market Size - Application Segment 2018 - 2022 ($ million)
- 4.3 Type segment analysis 2018 - 2022
- Historic Market Size - Type Segment 2018 - 2022 ($ million)
- 4.4 Geography segment analysis 2018 - 2022
- Historic Market Size - Geography Segment 2018 - 2022 ($ million)
- 4.5 Country segment analysis 2018 - 2022
- Historic Market Size - Country Segment 2018 - 2022 ($ million)
5 Five Forces Analysis
- 5.1 Five forces summary
- Five forces analysis - Comparison between 2023 and 2028
- 5.2 Bargaining power of buyers
- Bargaining power of buyers - Impact of key factors 2023 and 2028
- 5.3 Bargaining power of suppliers
- Bargaining power of suppliers - Impact of key factors in 2023 and 2028
- 5.4 Threat of new entrants
- Threat of new entrants - Impact of key factors in 2023 and 2028
- 5.5 Threat of substitutes
- Threat of substitutes - Impact of key factors in 2023 and 2028
- 5.6 Threat of rivalry
- Threat of rivalry - Impact of key factors in 2023 and 2028
- 5.7 Market condition
- Chart on Market condition - Five forces 2023 and 2028
6 Market Segmentation by Application
- 6.1 Market segments
- Chart on Application - Market share 2023-2028 (%)
- Data Table on Application - Market share 2023-2028 (%)
- 6.2 Comparison by Application
- Chart on Comparison by Application
- Data Table on Comparison by Application
- 6.3 Oil exploration - Market size and forecast 2023-2028
- Chart on Oil exploration - Market size and forecast 2023-2028 ($ million)
- Data Table on Oil exploration - Market size and forecast 2023-2028 ($ million)
- Chart on Oil exploration - Year-over-year growth 2023-2028 (%)
- Data Table on Oil exploration - Year-over-year growth 2023-2028 (%)
- 6.4 Natural gas exploration - Market size and forecast 2023-2028
- Chart on Natural gas exploration - Market size and forecast 2023-2028 ($ million)
- Data Table on Natural gas exploration - Market size and forecast 2023-2028 ($ million)
- Chart on Natural gas exploration - Year-over-year growth 2023-2028 (%)
- Data Table on Natural gas exploration - Year-over-year growth 2023-2028 (%)
- 6.5 Market opportunity by Application
- Market opportunity by Application ($ million)
- Data Table on Market opportunity by Application ($ million)
7 Market Segmentation by Type
- 7.1 Market segments
- Chart on Type - Market share 2023-2028 (%)
- Data Table on Type - Market share 2023-2028 (%)
- 7.2 Comparison by Type
- Chart on Comparison by Type
- Data Table on Comparison by Type
- 7.3 White frac - Market size and forecast 2023-2028
- Chart on White frac - Market size and forecast 2023-2028 ($ million)
- Data Table on White frac - Market size and forecast 2023-2028 ($ million)
- Chart on White frac - Year-over-year growth 2023-2028 (%)
- Data Table on White frac - Year-over-year growth 2023-2028 (%)
- 7.4 Brown frac - Market size and forecast 2023-2028
- Chart on Brown frac - Market size and forecast 2023-2028 ($ million)
- Data Table on Brown frac - Market size and forecast 2023-2028 ($ million)
- Chart on Brown frac - Year-over-year growth 2023-2028 (%)
- Data Table on Brown frac - Year-over-year growth 2023-2028 (%)
- 7.5 Market opportunity by Type
- Market opportunity by Type ($ million)
- Data Table on Market opportunity by Type ($ million)
8 Customer Landscape
- 8.1 Customer landscape overview
- Analysis of price sensitivity, lifecycle, customer purchase basket, adoption rates, and purchase criteria
9 Geographic Landscape
- 9.1 Geographic segmentation
- Chart on Market share by geography 2023-2028 (%)
- Data Table on Market share by geography 2023-2028 (%)
- 9.2 Geographic comparison
- Chart on Geographic comparison
- Data Table on Geographic comparison
- 9.3 North America - Market size and forecast 2023-2028
- Chart on North America - Market size and forecast 2023-2028 ($ million)
- Data Table on North America - Market size and forecast 2023-2028 ($ million)
- Chart on North America - Year-over-year growth 2023-2028 (%)
- Data Table on North America - Year-over-year growth 2023-2028 (%)
- 9.4 Europe - Market size and forecast 2023-2028
- Chart on Europe - Market size and forecast 2023-2028 ($ million)
- Data Table on Europe - Market size and forecast 2023-2028 ($ million)
- Chart on Europe - Year-over-year growth 2023-2028 (%)
- Data Table on Europe - Year-over-year growth 2023-2028 (%)
- 9.5 APAC - Market size and forecast 2023-2028
- Chart on APAC - Market size and forecast 2023-2028 ($ million)
- Data Table on APAC - Market size and forecast 2023-2028 ($ million)
- Chart on APAC - Year-over-year growth 2023-2028 (%)
- Data Table on APAC - Year-over-year growth 2023-2028 (%)
- 9.6 Middle East and Africa - Market size and forecast 2023-2028
- Chart on Middle East and Africa - Market size and forecast 2023-2028 ($ million)
- Data Table on Middle East and Africa - Market size and forecast 2023-2028 ($ million)
- Chart on Middle East and Africa - Year-over-year growth 2023-2028 (%)
- Data Table on Middle East and Africa - Year-over-year growth 2023-2028 (%)
- 9.7 South America - Market size and forecast 2023-2028
- Chart on South America - Market size and forecast 2023-2028 ($ million)
- Data Table on South America - Market size and forecast 2023-2028 ($ million)
- Chart on South America - Year-over-year growth 2023-2028 (%)
- Data Table on South America - Year-over-year growth 2023-2028 (%)
- 9.8 US - Market size and forecast 2023-2028
- Chart on US - Market size and forecast 2023-2028 ($ million)
- Data Table on US - Market size and forecast 2023-2028 ($ million)
- Chart on US - Year-over-year growth 2023-2028 (%)
- Data Table on US - Year-over-year growth 2023-2028 (%)
- 9.9 Canada - Market size and forecast 2023-2028
- Chart on Canada - Market size and forecast 2023-2028 ($ million)
- Data Table on Canada - Market size and forecast 2023-2028 ($ million)
- Chart on Canada - Year-over-year growth 2023-2028 (%)
- Data Table on Canada - Year-over-year growth 2023-2028 (%)
- 9.10 China - Market size and forecast 2023-2028
- Chart on China - Market size and forecast 2023-2028 ($ million)
- Data Table on China - Market size and forecast 2023-2028 ($ million)
- Chart on China - Year-over-year growth 2023-2028 (%)
- Data Table on China - Year-over-year growth 2023-2028 (%)
- 9.11 Australia - Market size and forecast 2023-2028
- Chart on Australia - Market size and forecast 2023-2028 ($ million)
- Data Table on Australia - Market size and forecast 2023-2028 ($ million)
- Chart on Australia - Year-over-year growth 2023-2028 (%)
- Data Table on Australia - Year-over-year growth 2023-2028 (%)
- 9.12 Argentina - Market size and forecast 2023-2028
- Chart on Argentina - Market size and forecast 2023-2028 ($ million)
- Data Table on Argentina - Market size and forecast 2023-2028 ($ million)
- Chart on Argentina - Year-over-year growth 2023-2028 (%)
- Data Table on Argentina - Year-over-year growth 2023-2028 (%)
- 9.13 Market opportunity by geography
- Market opportunity by geography ($ million)
- Data Tables on Market opportunity by geography ($ million)
10 Drivers, Challenges, and Opportunity/Restraints
- 10.3 Impact of drivers and challenges
- Impact of drivers and challenges in 2023 and 2028
- 10.4 Market opportunities/restraints
11 Competitive Landscape
- 11.2 Competitive Landscape
- Overview on criticality of inputs and factors of differentiation
- 11.3 Landscape disruption
- Overview on factors of disruption
- 11.4 Industry risks
- Impact of key risks on business
12 Competitive Analysis
- 12.2 Market positioning of companies
- Matrix on companies position and classification
- 12.3 Atlas Resin Proppants
- Atlas Resin Proppants - Overview
- Atlas Resin Proppants - Product / Service
- Atlas Resin Proppants - Key offerings
- 12.4 Australian Silica Quartz Group Ltd
- Australian Silica Quartz Group Ltd - Overview
- Australian Silica Quartz Group Ltd - Product / Service
- Australian Silica Quartz Group Ltd - Key offerings
- 12.5 Badger Mining Corporation
- Badger Mining Corporation - Overview
- Badger Mining Corporation - Product / Service
- Badger Mining Corporation - Key offerings
- 12.6 Black Mountain Sand, LLC
- Black Mountain Sand, LLC - Overview
- Black Mountain Sand, LLC - Product / Service
- Black Mountain Sand, LLC - Key offerings
- 12.7 Canadian Silica Industries
- Canadian Silica Industries - Overview
- Canadian Silica Industries - Product / Service
- Canadian Silica Industries - Key offerings
- 12.8 CARBO Ceramics Inc.
- CARBO Ceramics Inc. - Overview
- CARBO Ceramics Inc. - Product / Service
- CARBO Ceramics Inc. - Key offerings
- 12.9 Chieftain Sand
- Chieftain Sand - Overview
- Chieftain Sand - Product / Service
- Chieftain Sand - Key offerings
- 12.10 Chongqing Changjiang River Moulding Material (Group) Co., Ltd.
- Chongqing Changjiang River Moulding Material (Group) Co., Ltd. - Overview
- Chongqing Changjiang River Moulding Material (Group) Co., Ltd. - Product / Service
- Chongqing Changjiang River Moulding Material (Group) Co., Ltd. - Key offerings
- 12.11 Covia
- Covia - Overview
- Covia - Product / Service
- Covia - Key offerings
- 12.12 Di-Corp
- Di-Corp - Overview
- Di-Corp - Product / Service
- Di-Corp - Key offerings
- 12.13 Diversity Technologies Corporation
- Diversity Technologies Corporation - Overview
- Diversity Technologies Corporation - Product / Service
- Diversity Technologies Corporation - Key offerings
- 12.14 Emerge Energy Services
- Emerge Energy Services - Overview
- Emerge Energy Services - Product / Service
- Emerge Energy Services - Key offerings
- 12.15 EP Minerals, LLC
- EP Minerals, LLC - Overview
- EP Minerals, LLC - Product / Service
- EP Minerals, LLC - Key offerings
- 12.16 Fairmount Santrol
- Fairmount Santrol - Overview
- Fairmount Santrol - Product / Service
- Fairmount Santrol - Key offerings
- 12.17 Haakon Industries Inc
- Haakon Industries Inc - Overview
- Haakon Industries Inc - Product / Service
- Haakon Industries Inc - Key offerings
- 12.18 Hi-Crush Inc.
- Hi-Crush Inc. - Overview
- Hi-Crush Inc. - Product / Service
- Hi-Crush Inc. - Key offerings
- 12.19 LaPrairie Group of Companies
- LaPrairie Group of Companies - Overview
- LaPrairie Group of Companies - Product / Service
- LaPrairie Group of Companies - Key offerings
- 12.20 Mammoth Energy Service, Inc.
- Mammoth Energy Service, Inc. - Overview
- Mammoth Energy Service, Inc. - Product / Service
- Mammoth Energy Service, Inc. - Key offerings
- 12.21 Northern White Sand Company
- Northern White Sand Company - Overview
- Northern White Sand Company - Product / Service
- Northern White Sand Company - Key offerings
- 12.22 Pattison Sand Company
- Pattison Sand Company - Overview
- Pattison Sand Company - Product / Service
- Pattison Sand Company - Key offerings
13 Appendix
- 13.2 Inclusions and exclusions checklist
- Inclusions checklist
- Exclusions checklist
- 13.3 Currency conversion rates for US$
- Currency conversion rates for US$
- 13.4 Research methodology
- 13.7 Validation techniques employed for market sizing
- Validation techniques employed for market sizing
- 13.9 360 degree market analysis
- 360 degree market analysis
- 13.10 List of abbreviations


