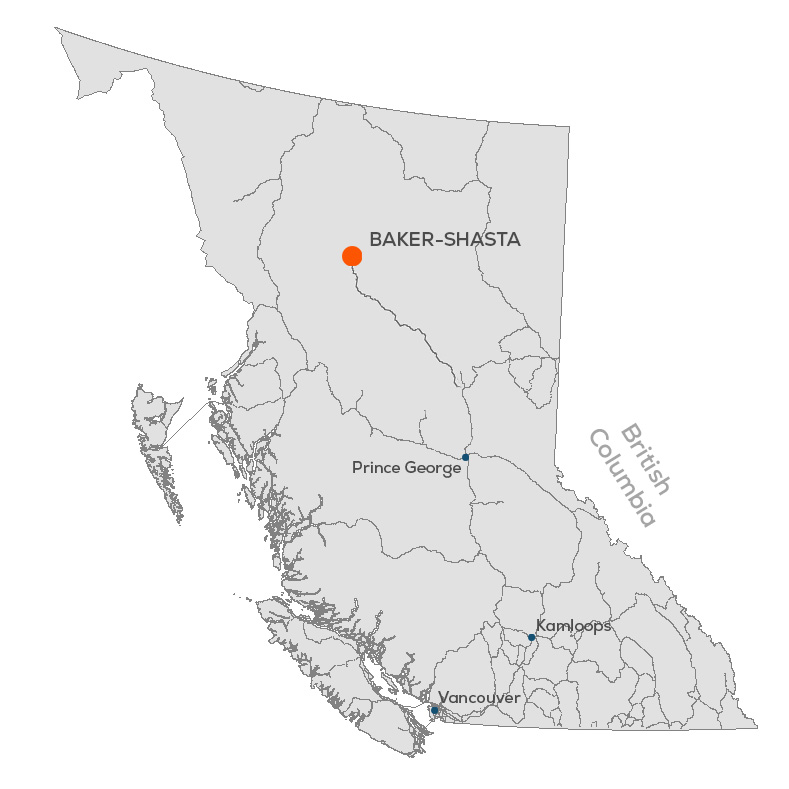
Shasta Mine & Deposit
History
The Shasta group of claims were staked in 1972 by Shasta Mines and Oil Ltd., who later changed their name to International Shasta Resources Ltd. In 1978, the property was optioned by Asarco Ltd and option terminated due to poor results.
Newmont Exploration Canada Ltd. optioned the property in 1983. Through surface exploration and 2,675 m of diamond drilling discovered the Creek, Rainier and Jock zones.
Esso Minerals Canada Ltd. optioned the property in 1987 and over two years of exploration discovered the JM and O Zones.
Homestake Mining Canada Ltd. purchased Esso Minerals Canada Ltd. and continued ground exploration including 13,774 m of exploration diamond drilling and 1,093 m of delineation and condemnation diamond drilling.
In 1989 International Shasta Resources Ltd. and Sable completed a mining and assignment agreement whereby Sable would mine 100,000 tonnes and process it at the Baker mill. In 1990, Homestake dropped their option, and Sable acquired the Shasta property from International Shasta. An estimated total of 420,000 tonnes were mined by Sable on the JM and Creek zones from 1989 to 1991 and 2008 to 2012. The Shasta (and Baker Mines) have been under care and maintenance since 2012.
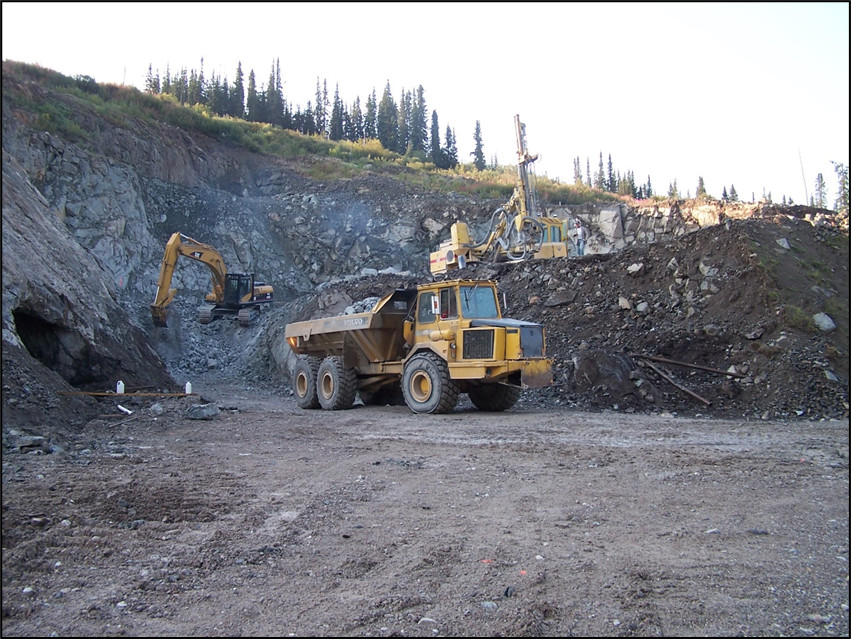
(Photo: Shasta Pit circa 2008)
On January 24, 2019, Talisker Resources entered into an asset purchase agreement to acquire Sable Resources Ltd.’s (“Sable”) mineral resource Toodoggone properties including the past producing Baker Gold/Silver Project; the Shasta Mine and Baker mill infrastructure and equipment; the Chappelle (Baker and Multinational Mines) Property; the Mets Lease and the Bot Property.
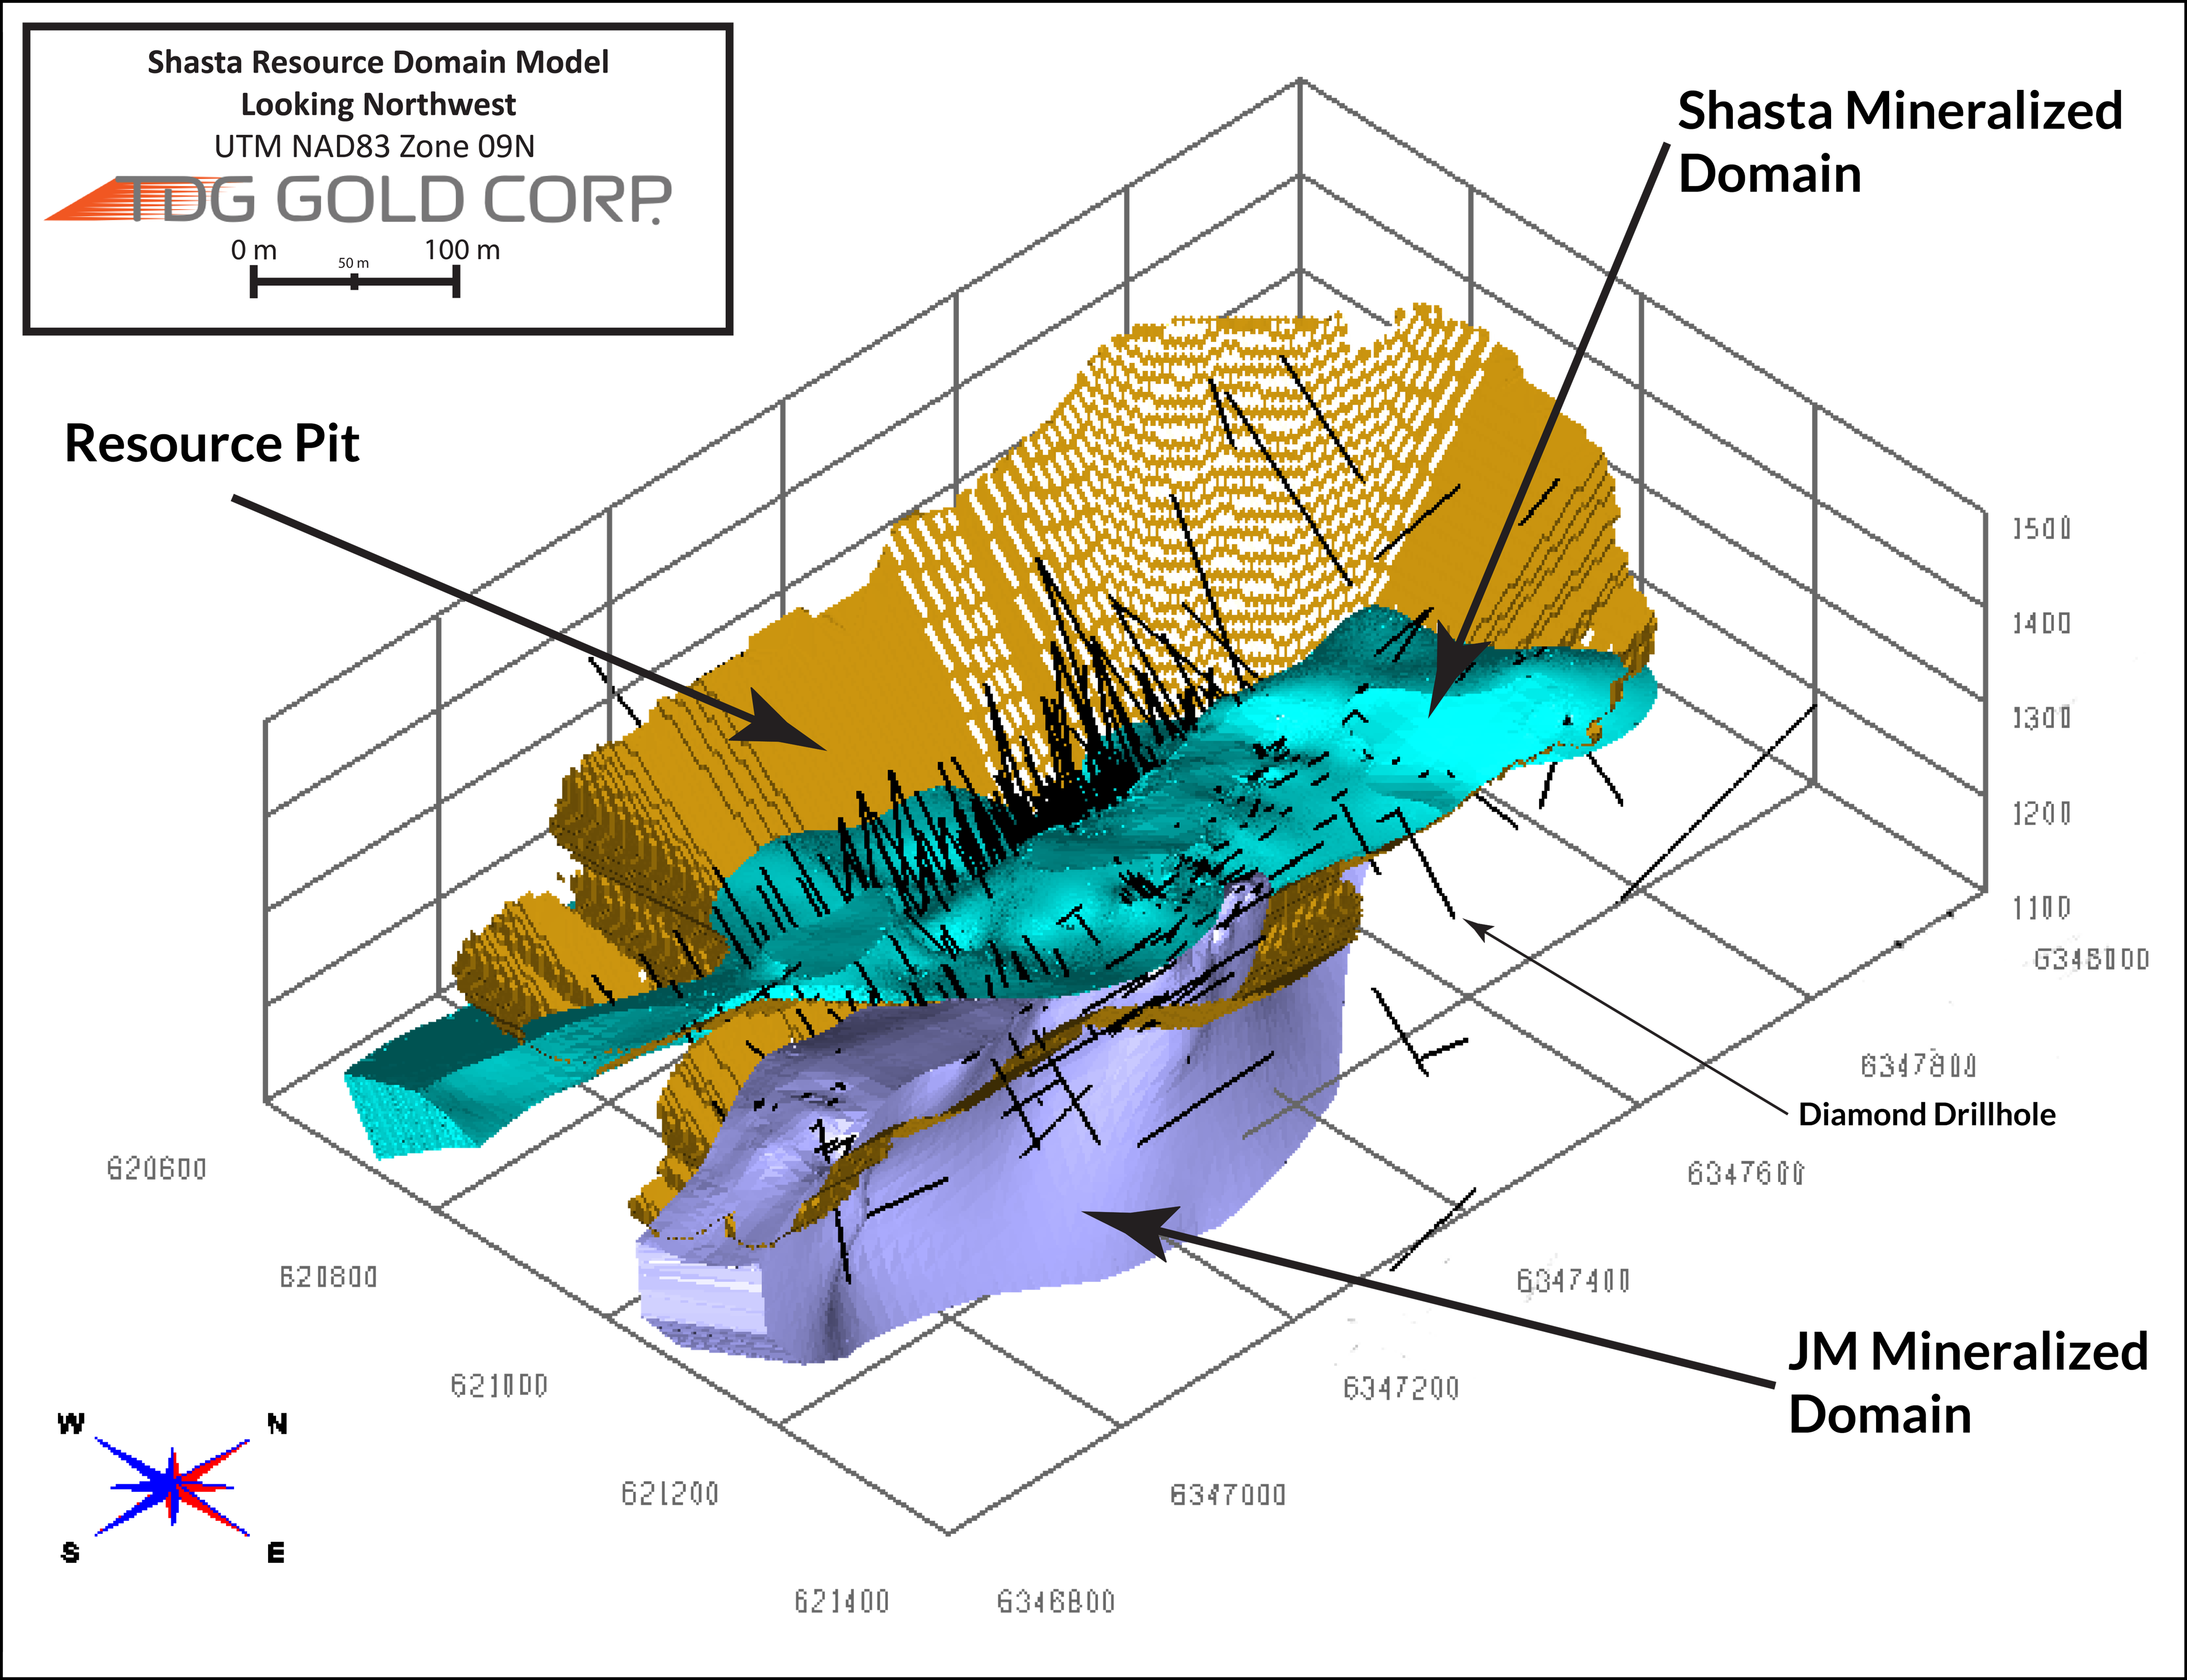
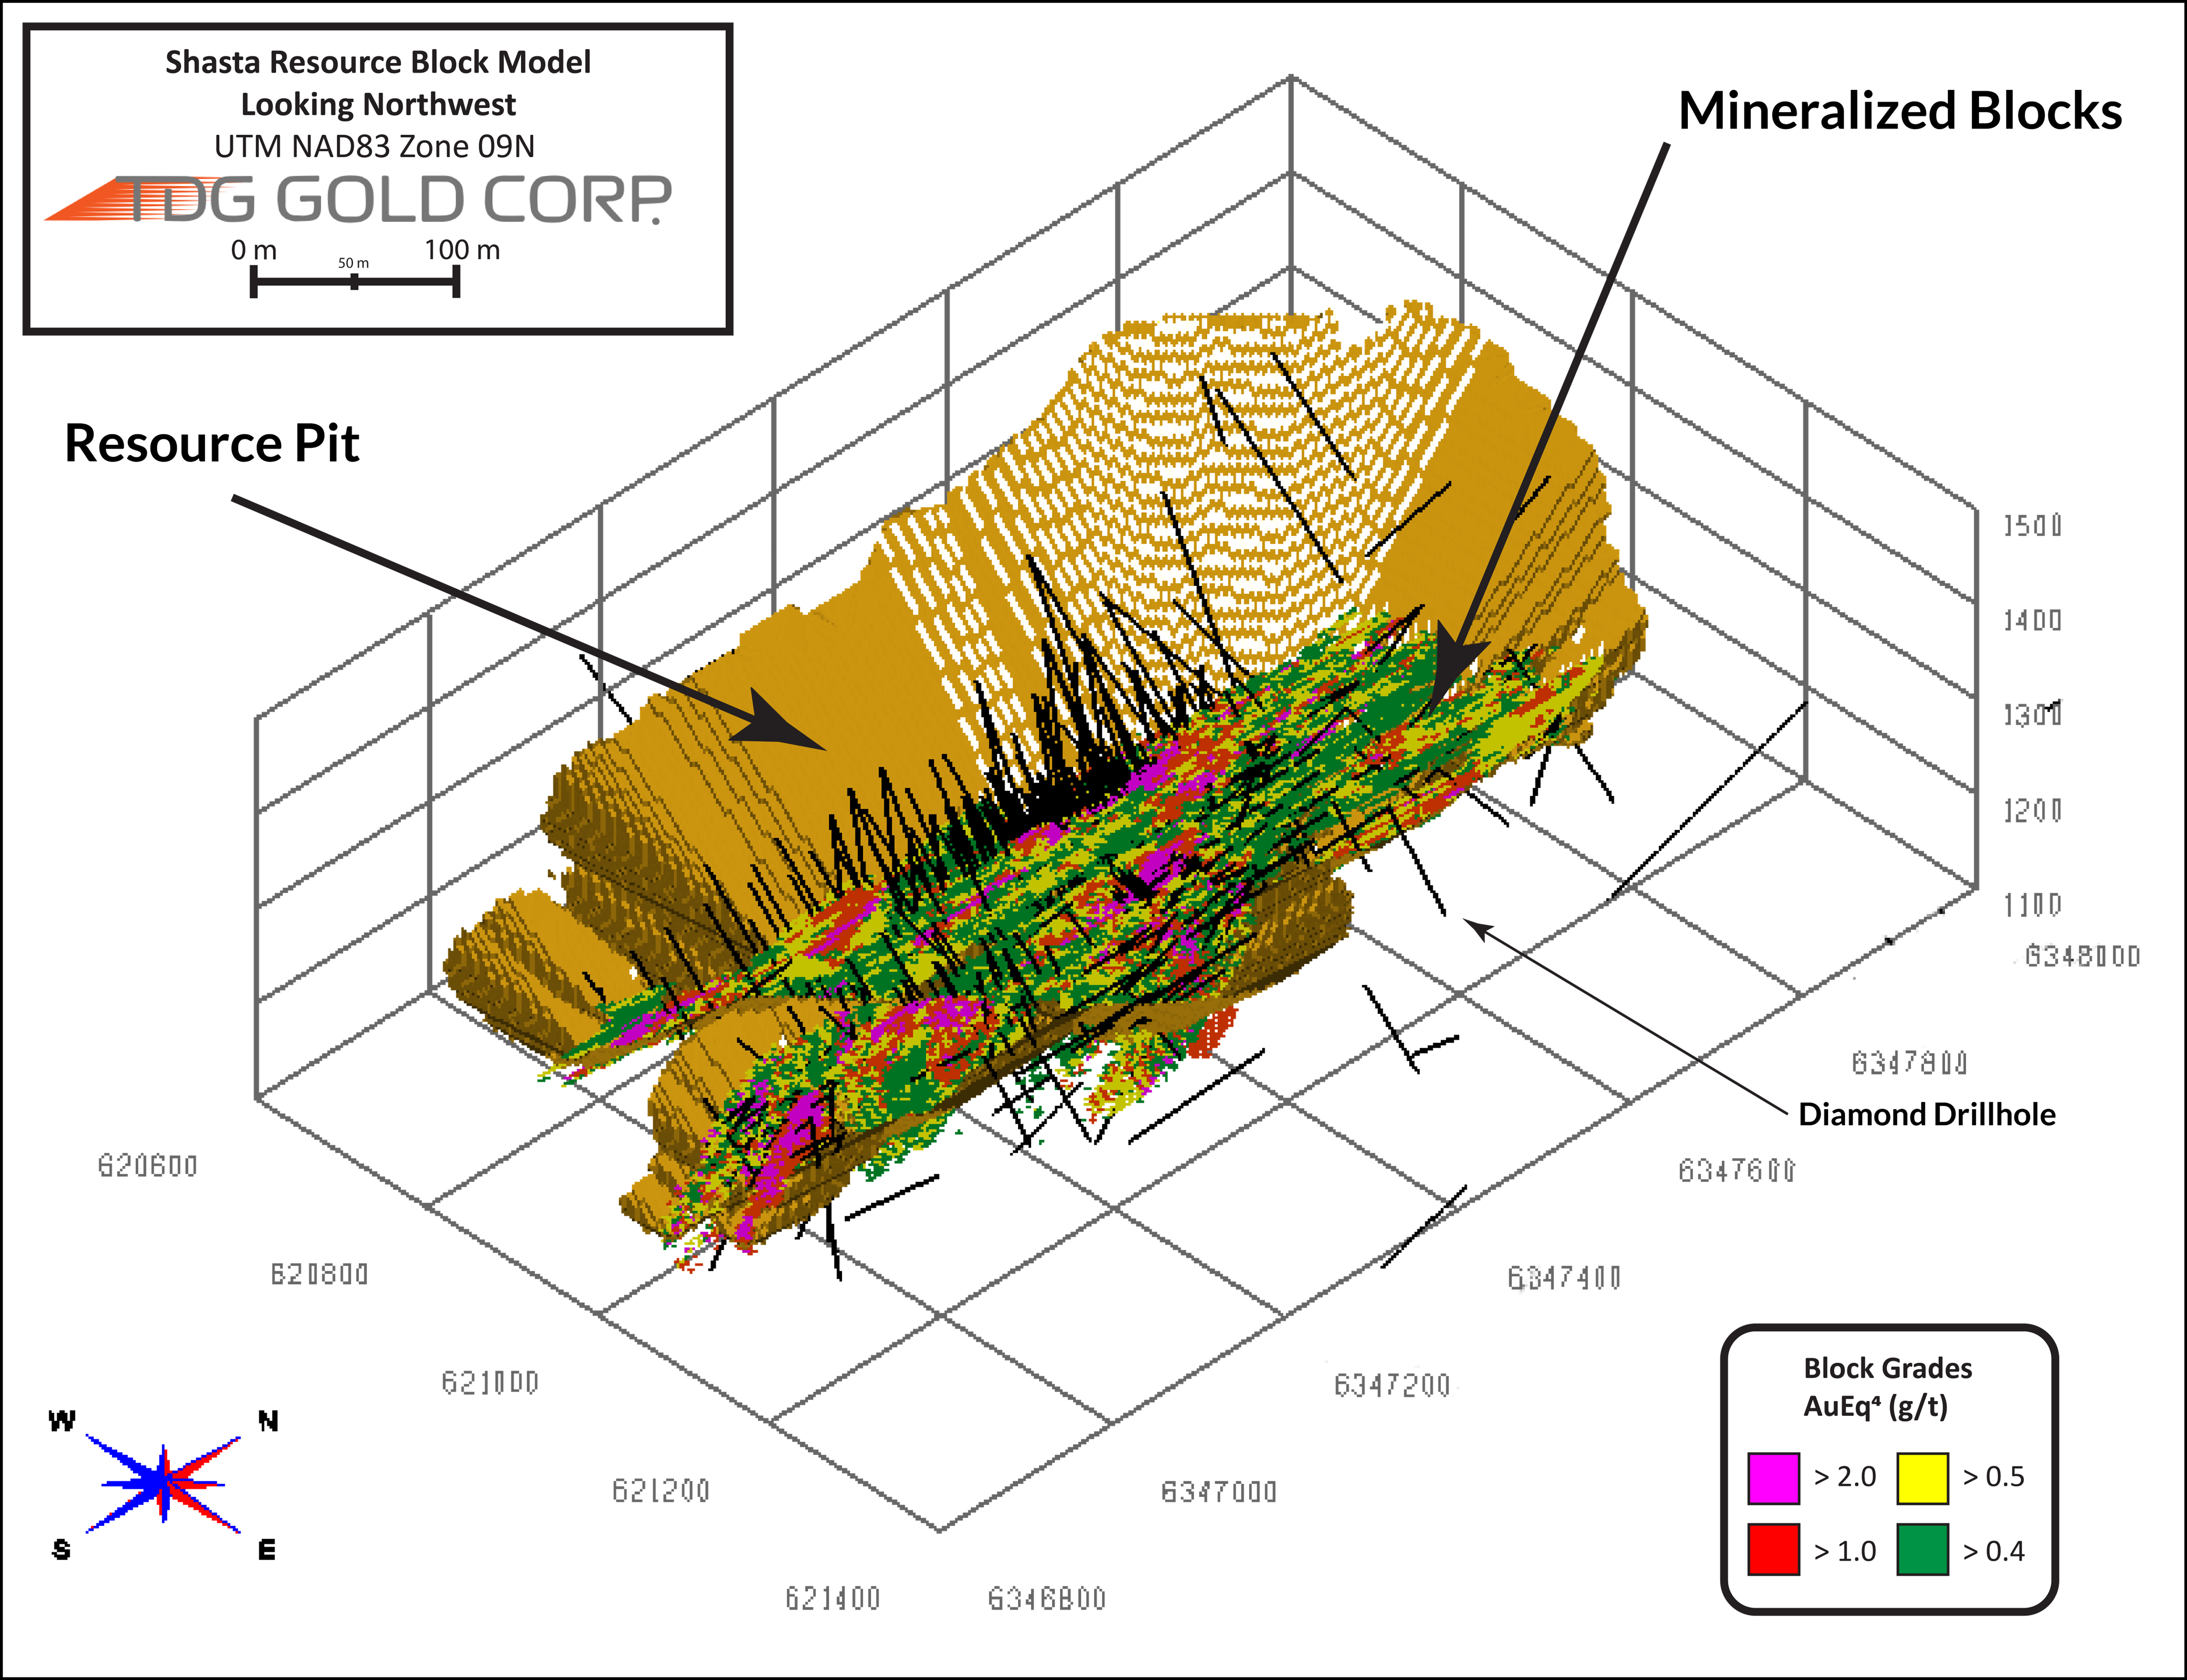
In total, twelve mineralized zones have been identified from the exploration and TDG’s data compilation has identified over 28,750m of historical drilling.
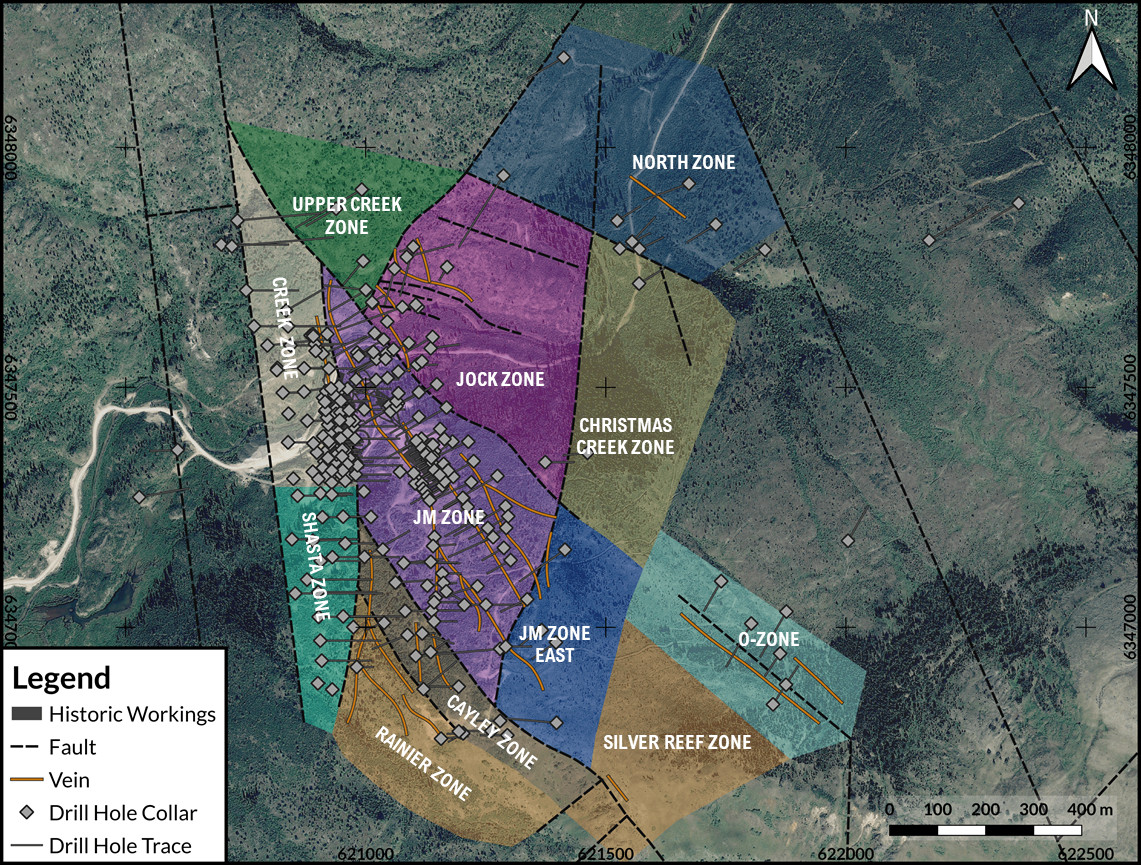
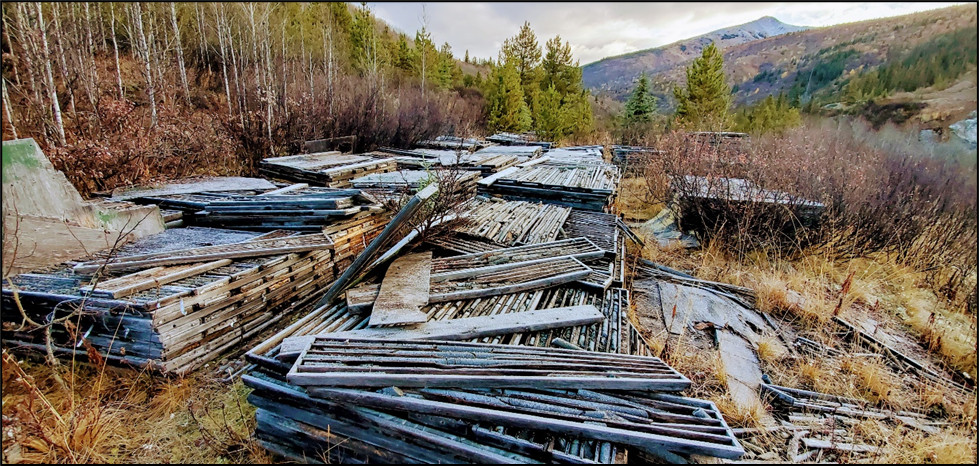
Photo: Shasta historical drill core
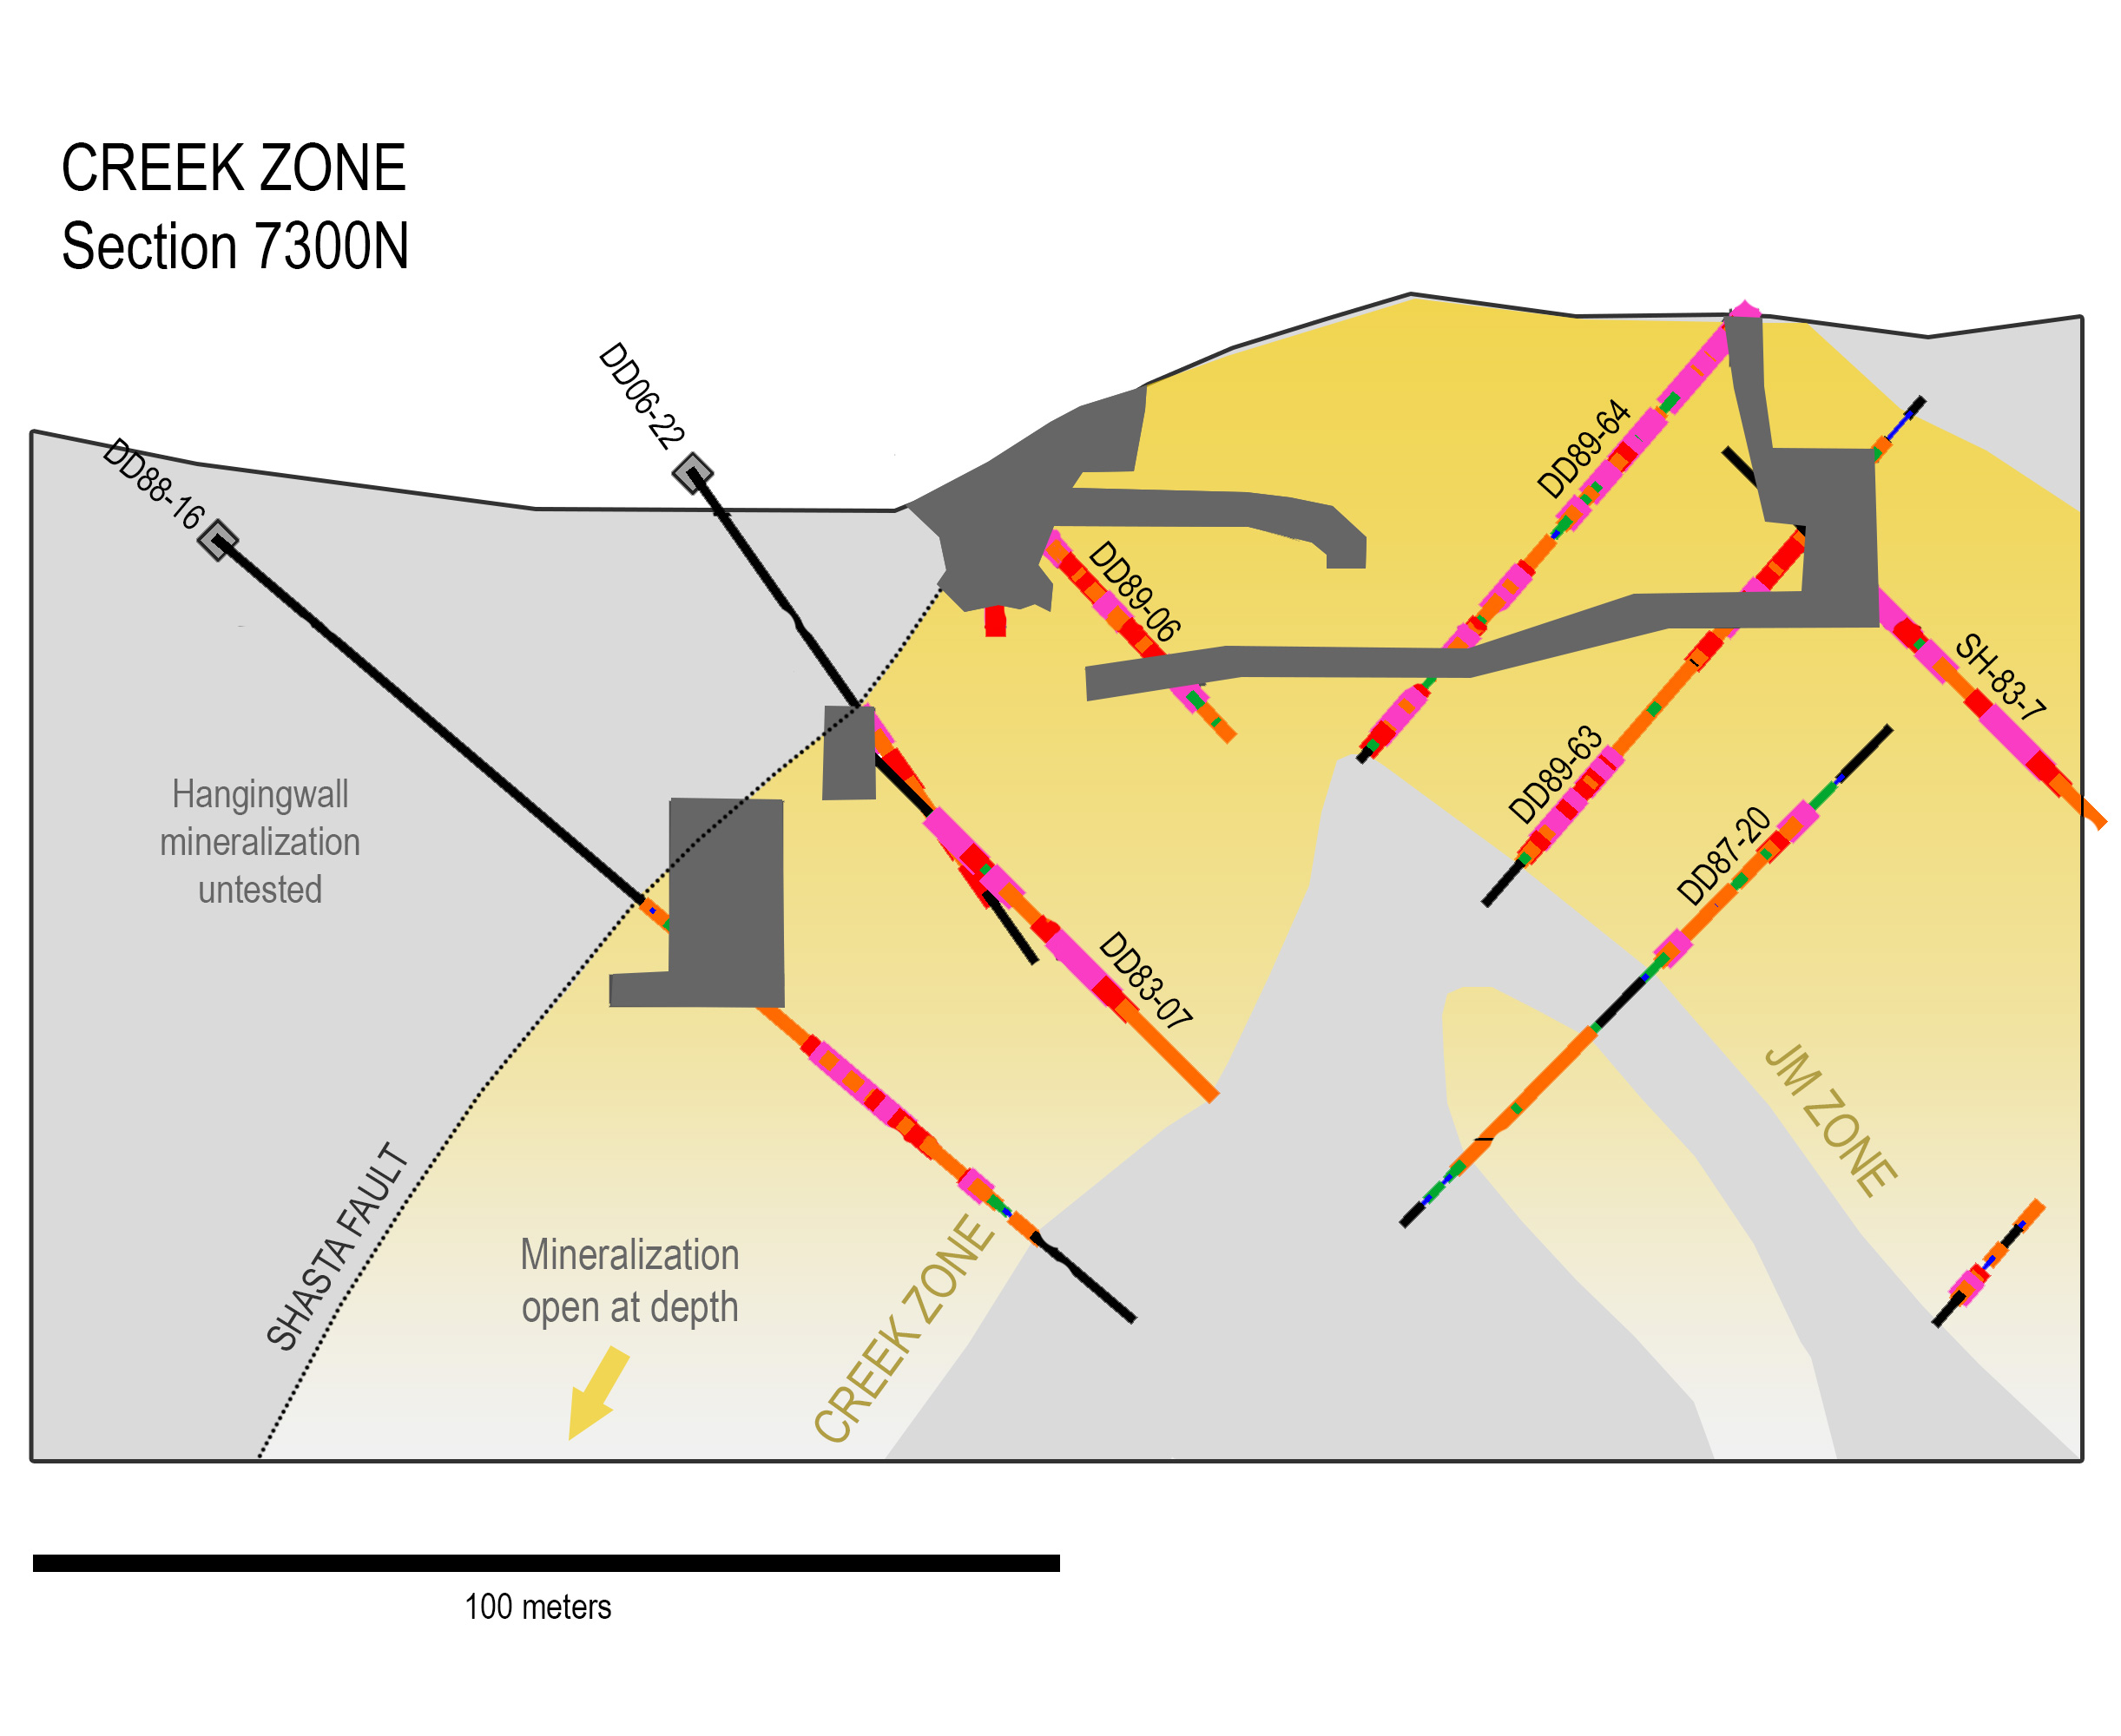
Stratigraphic Controls
The region is underlain by a thick succession of Jurassic Toodoggone Volcanic rocks, primarily tuffs and other fragmentary rocks formed through eruptions or active weathering of volcanic slopes. These units were defined by Marsden (1989) and each allocated a unit number, from 1 (oldest) to 24 (youngest).
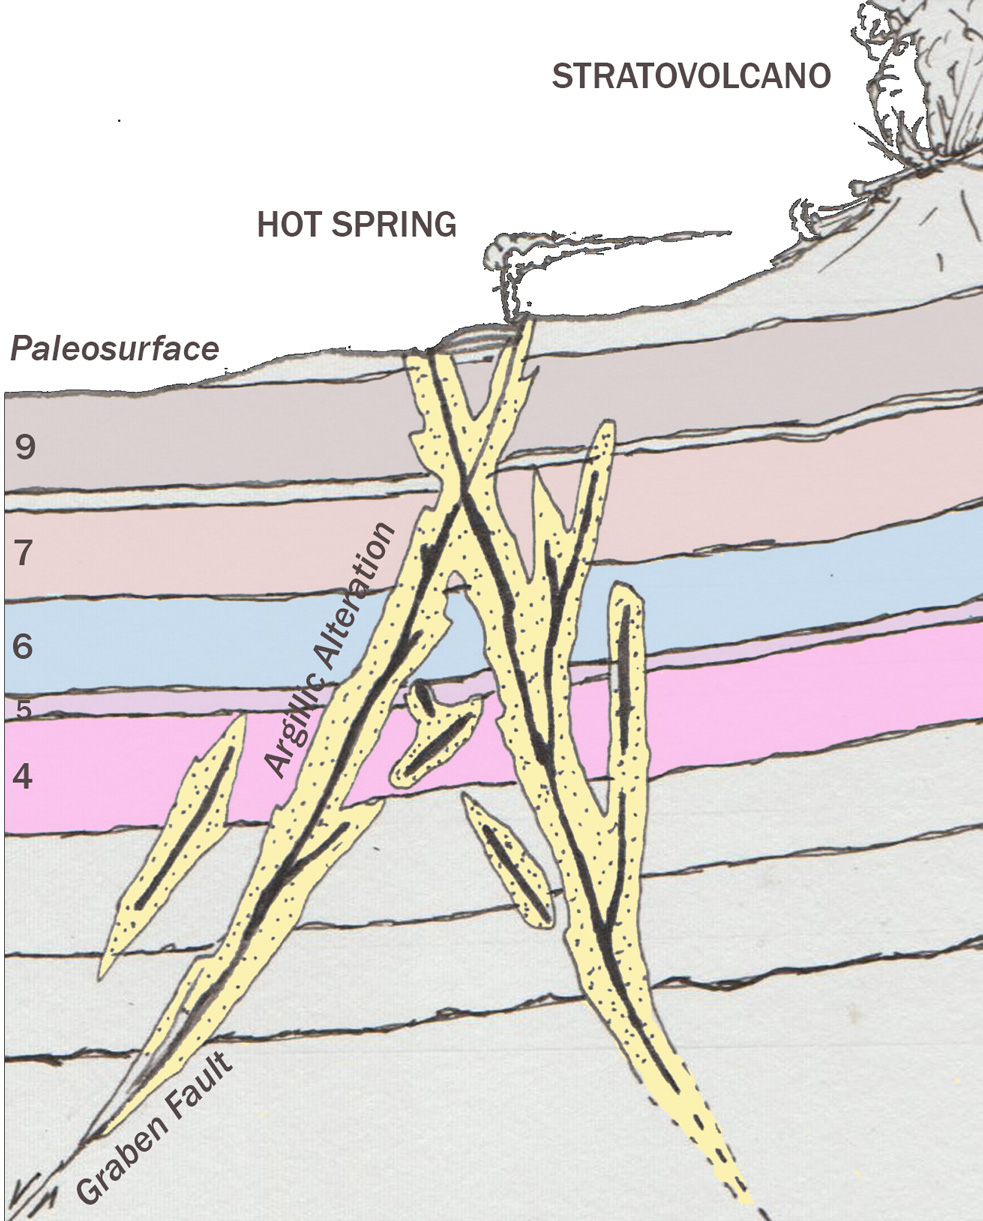
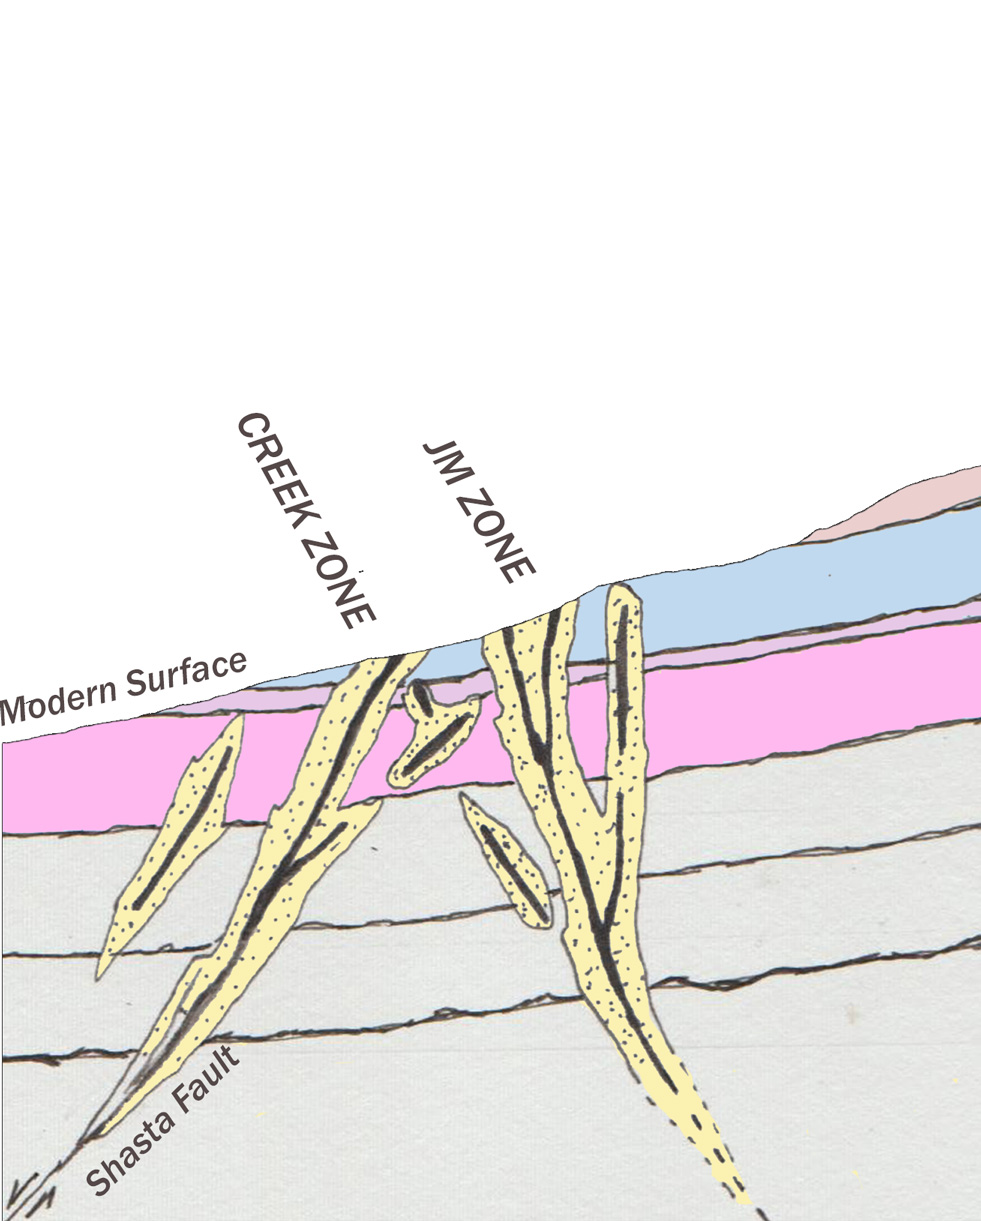
At Shasta, the geology is dominated by Units 4 to 12, and the mineralization lies within Units 4 to 9. This implies that the epithermal system was active during or shortly after these rocks were deposited, and then ceased. This gives a temporal constraint to the mineralization on the site and allows for more effective targeting.
Exploration Upside
Historically, no mineralization was found in younger units and have been ignored. In the Upper Creek Zone, drill holes collared in Unit 12 and hit mineralization at depth where the drilling intercepted the “fertile” horizons. It is therefore possible that more Shasta-style mineralization will be found to the north and beneath a cap of younger unmineralized volcanic rocks.
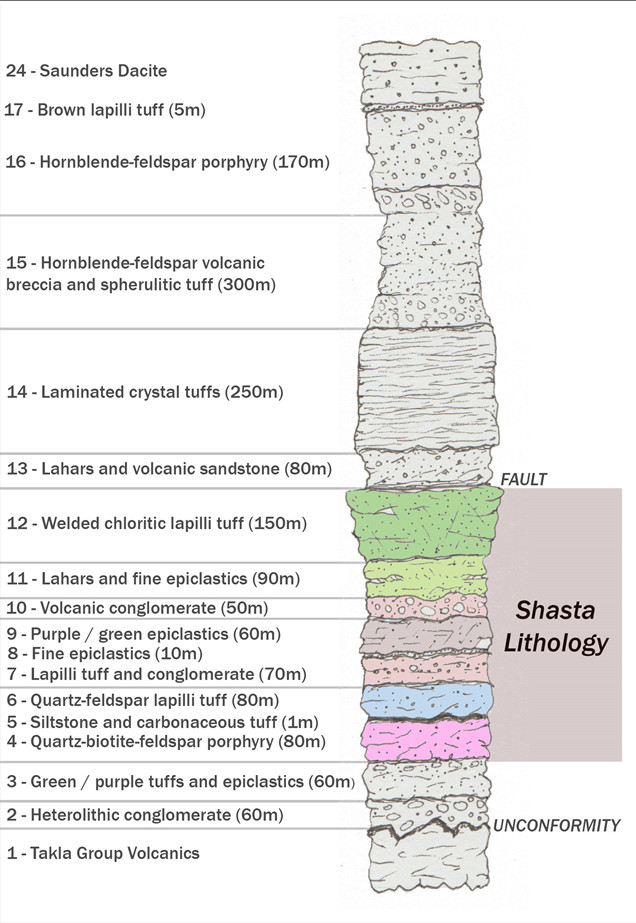
Above: Regional lithology (Upper Triassic Takla to Lower Jurassic Hazelton Groups) – modified from Marsden, 1989
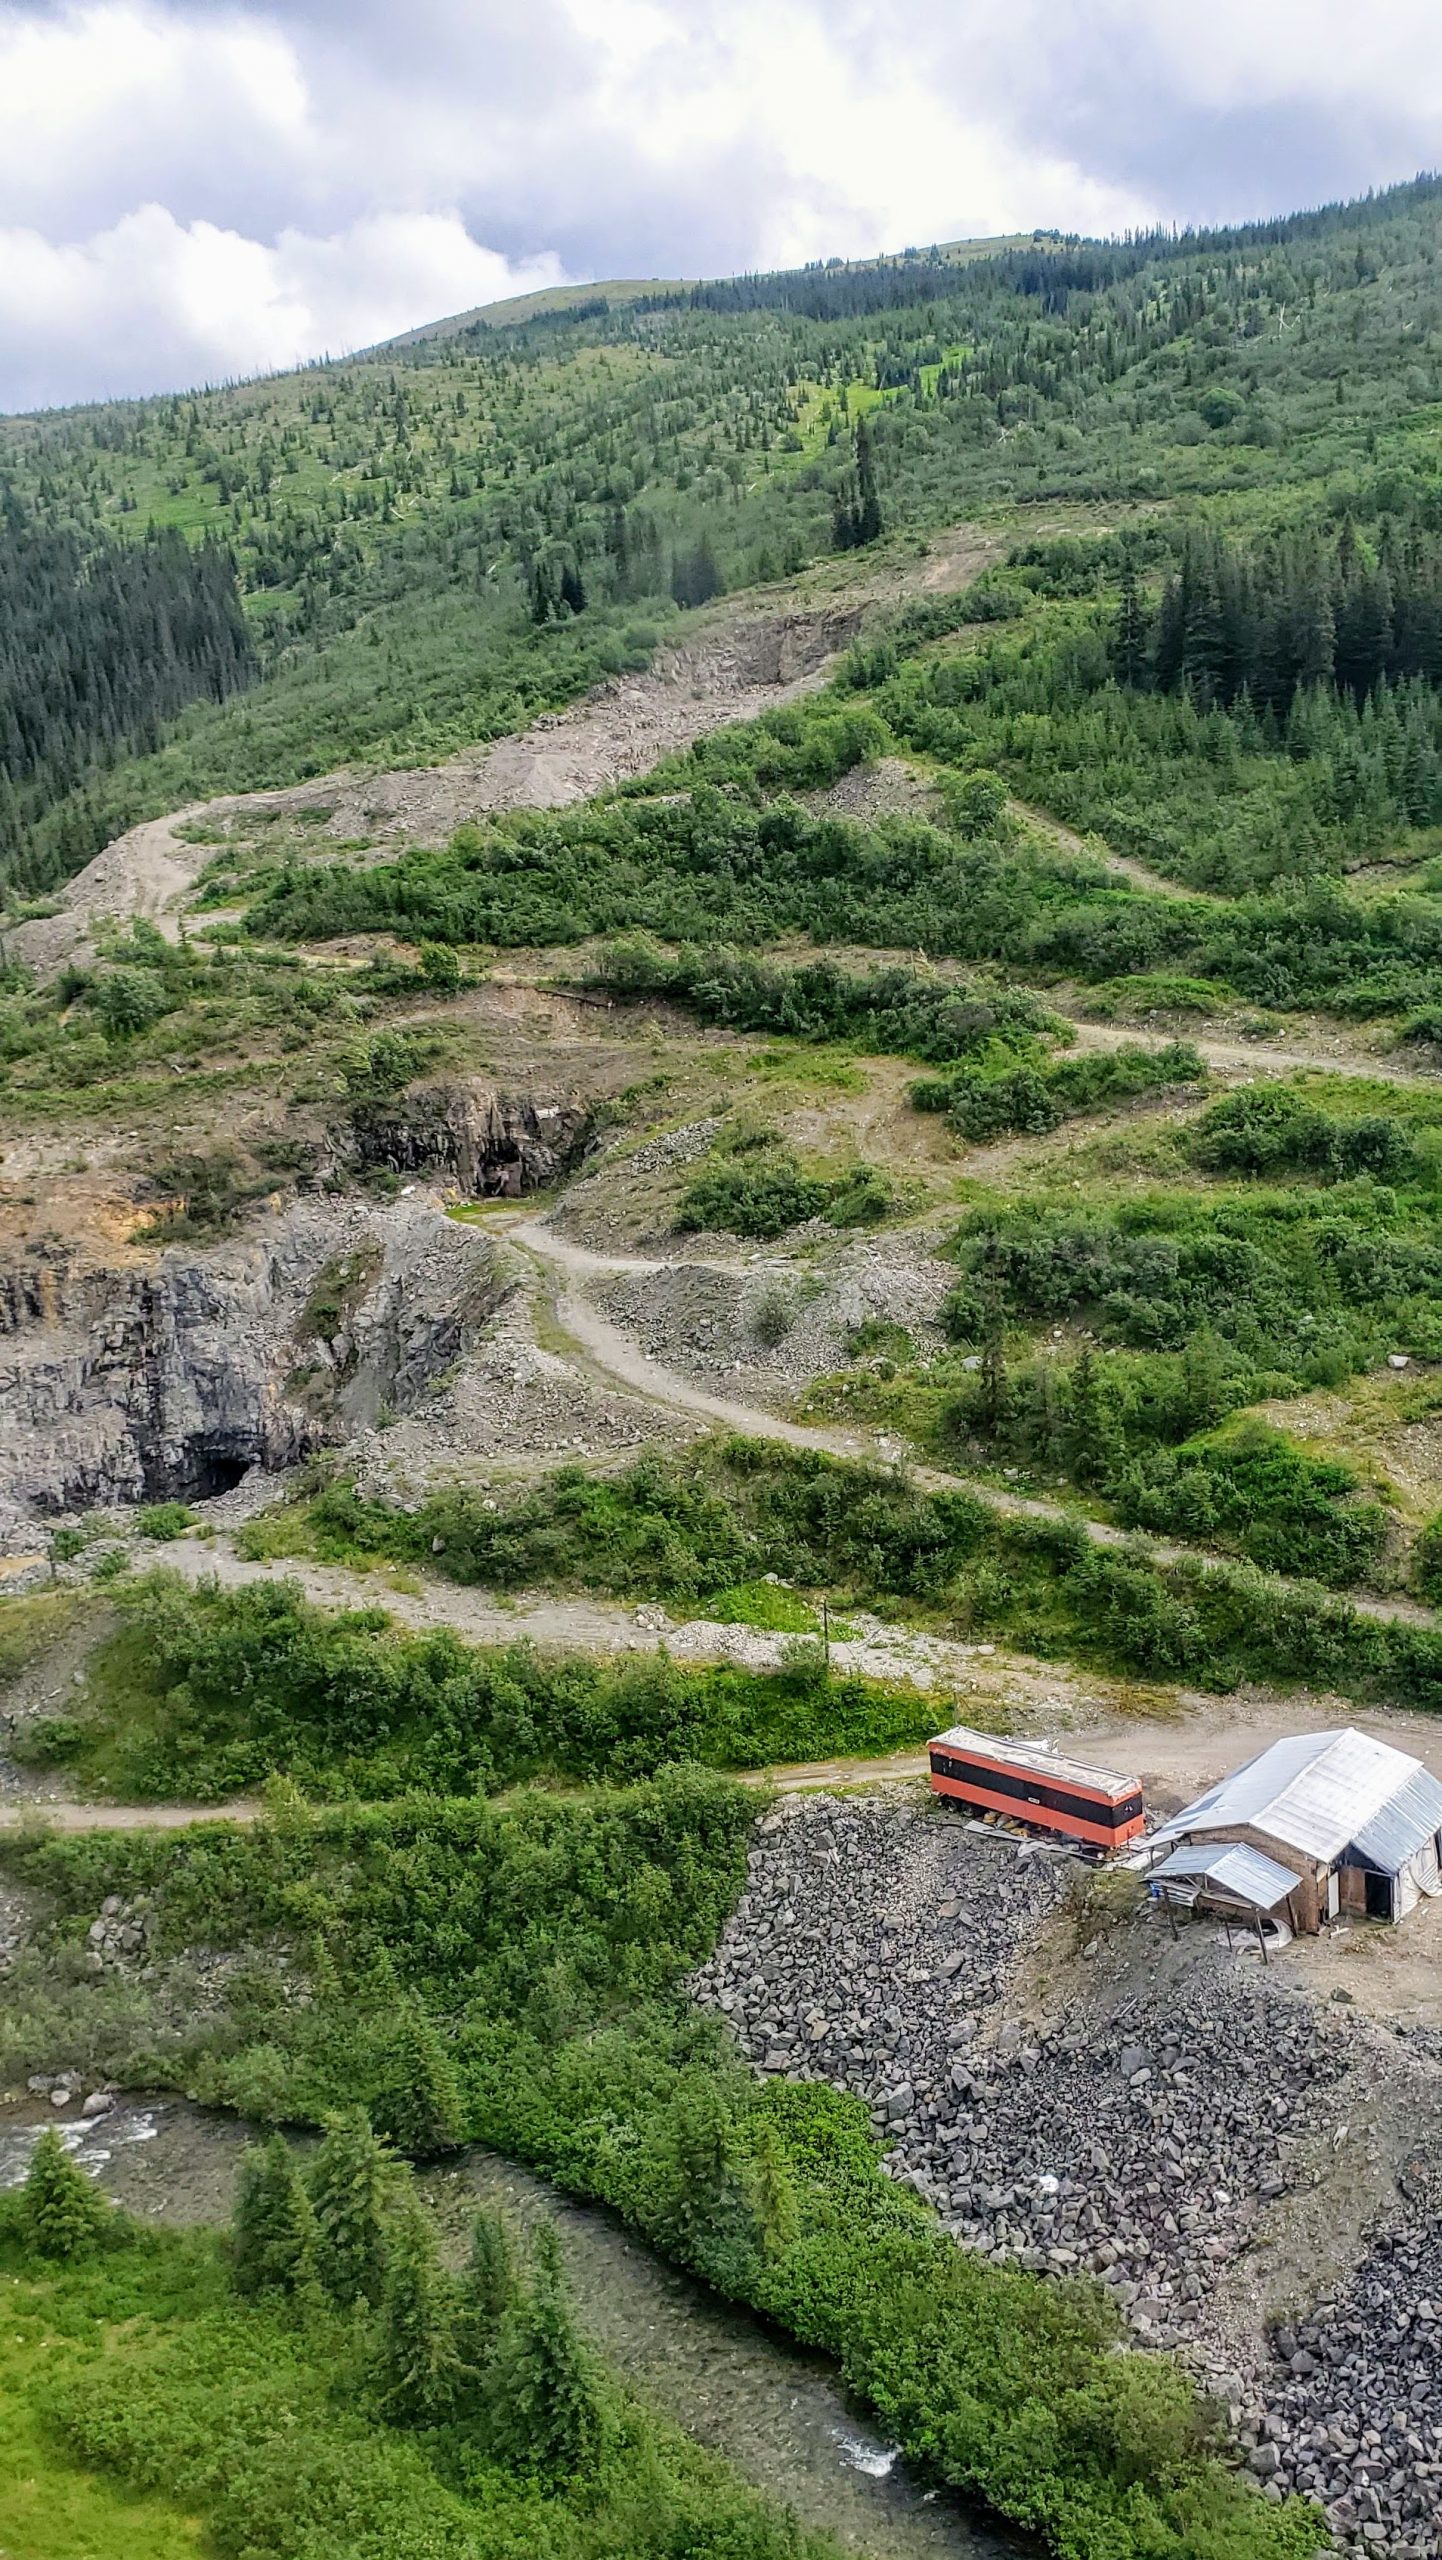
Creek Pit and existing buildings in the foreground, with JM Pit visible further up slope. Jock Creek in foreground.
Creek Pit with existing underground portal access. JM Creek is seen further up the hill, with Jock Creek in the foreground.
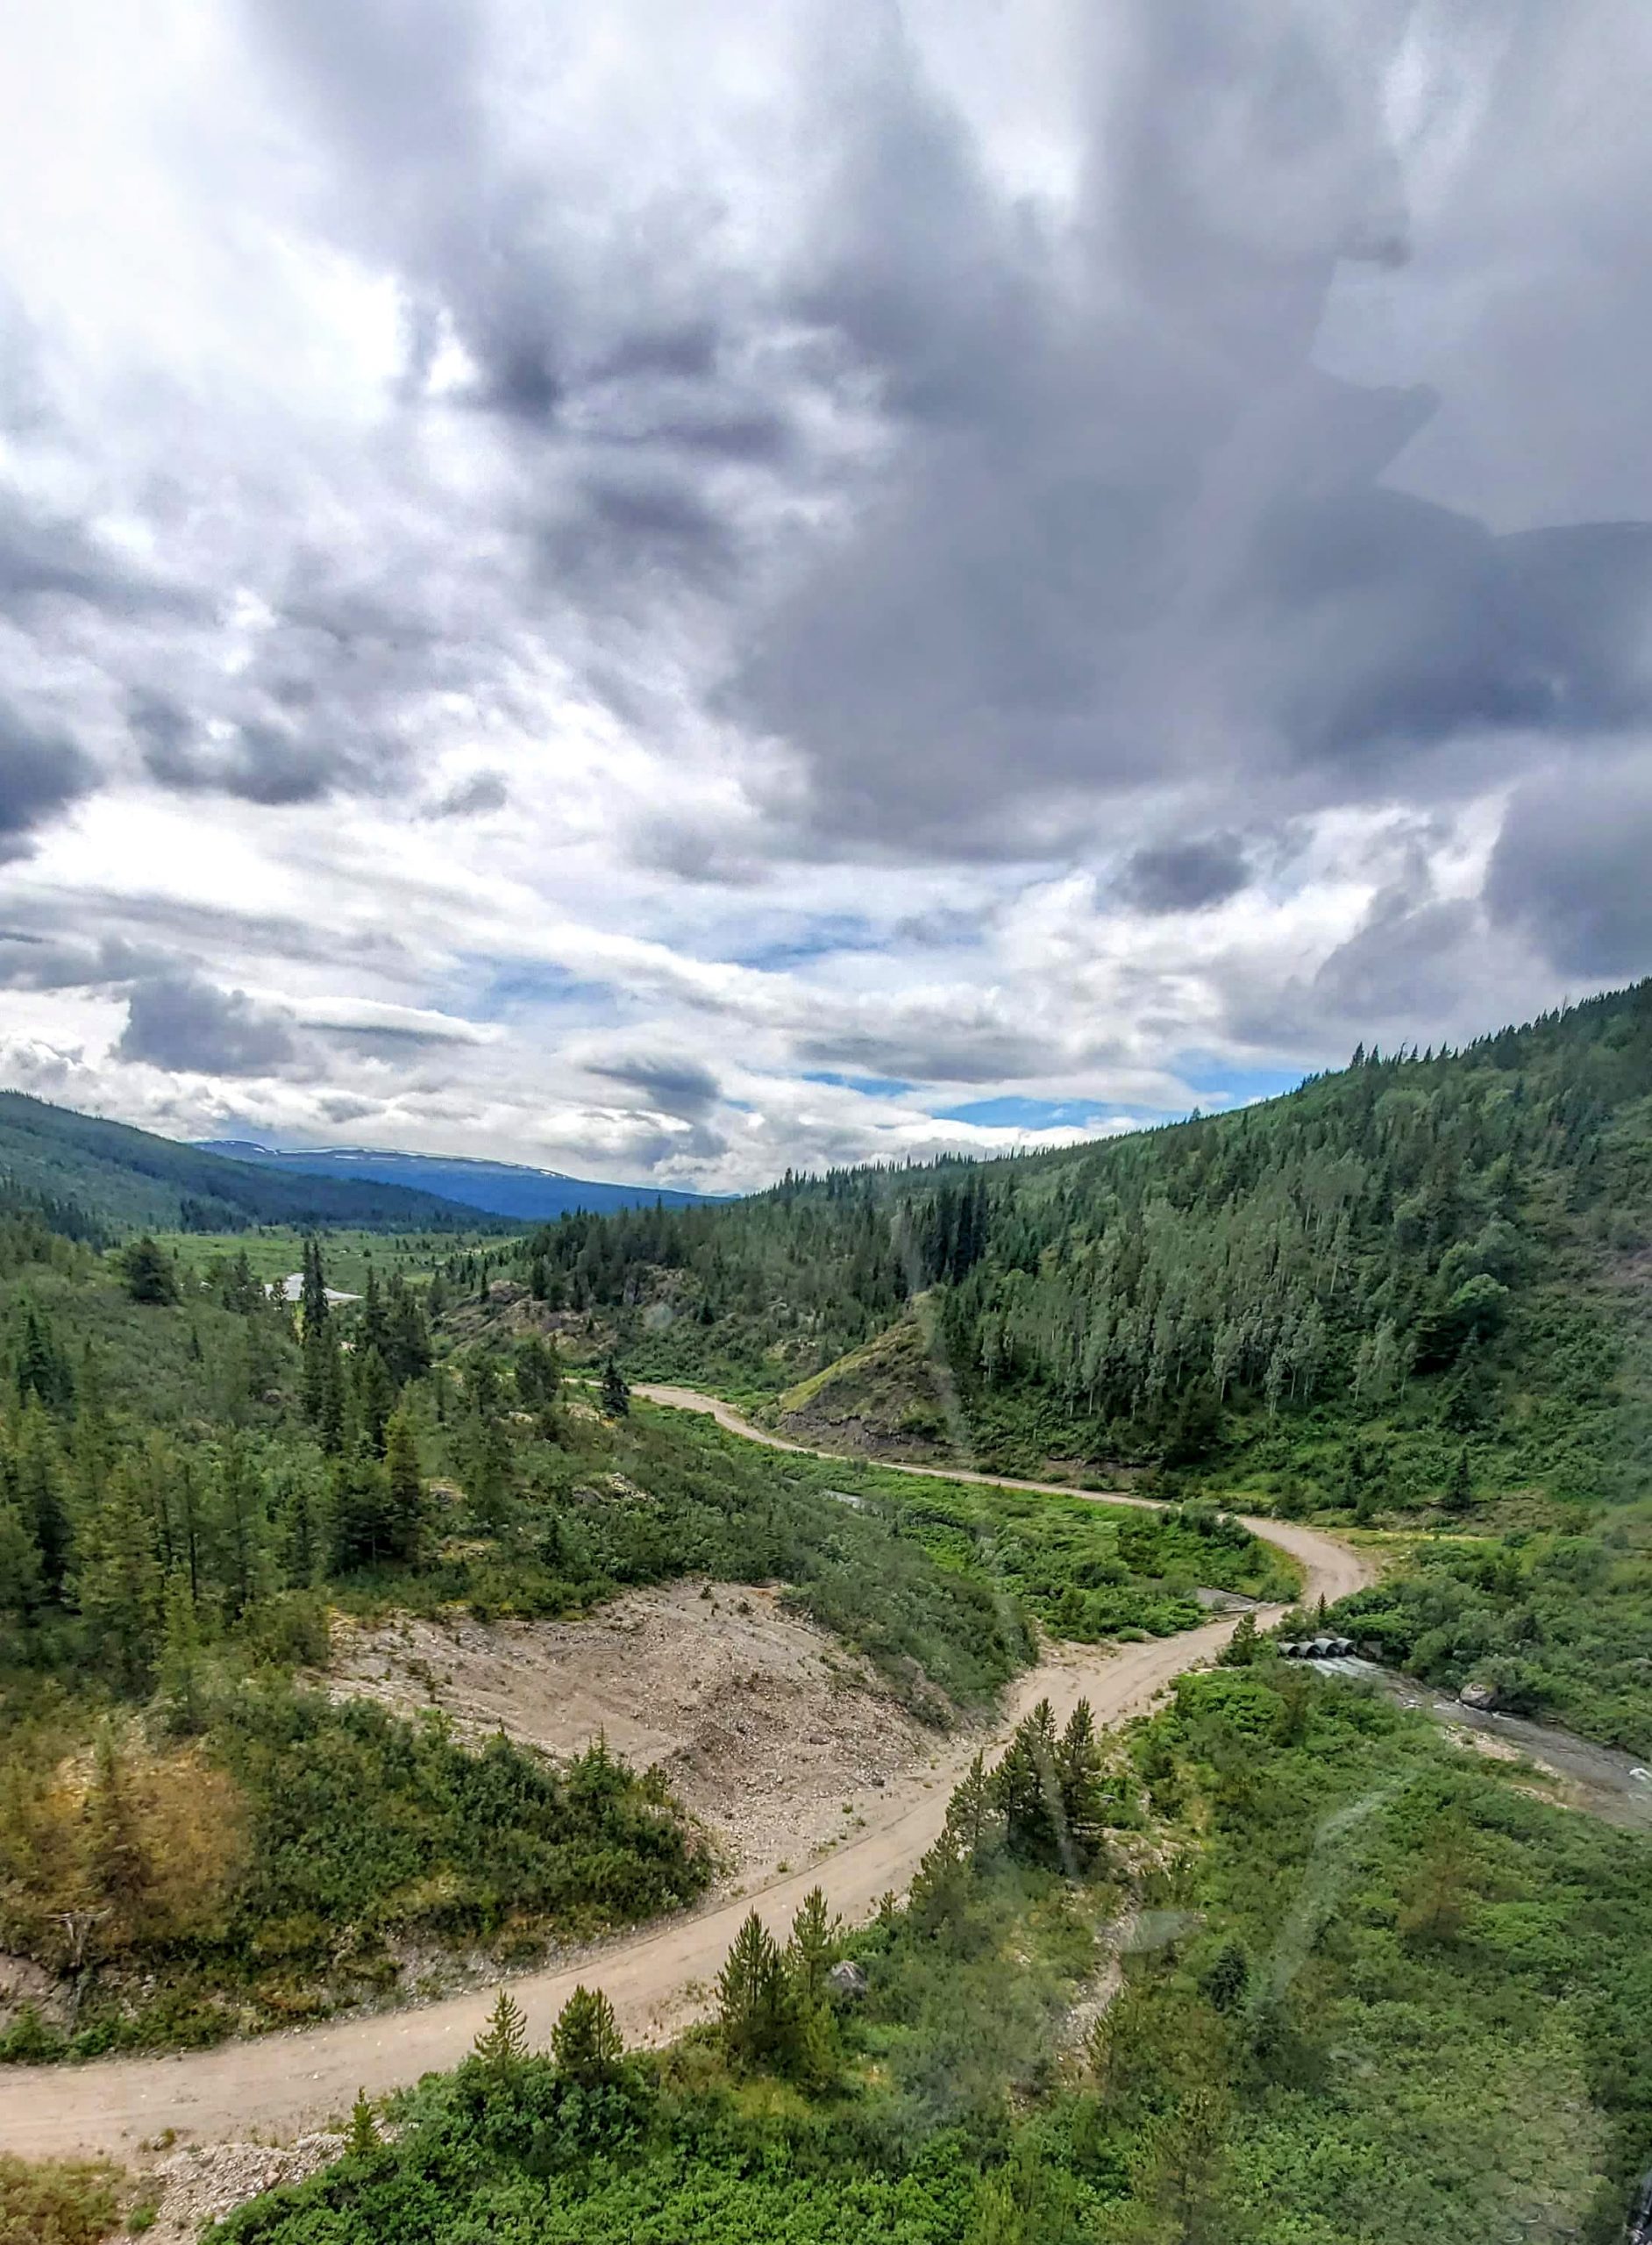
Jock Creek access road to Shasta Project site.
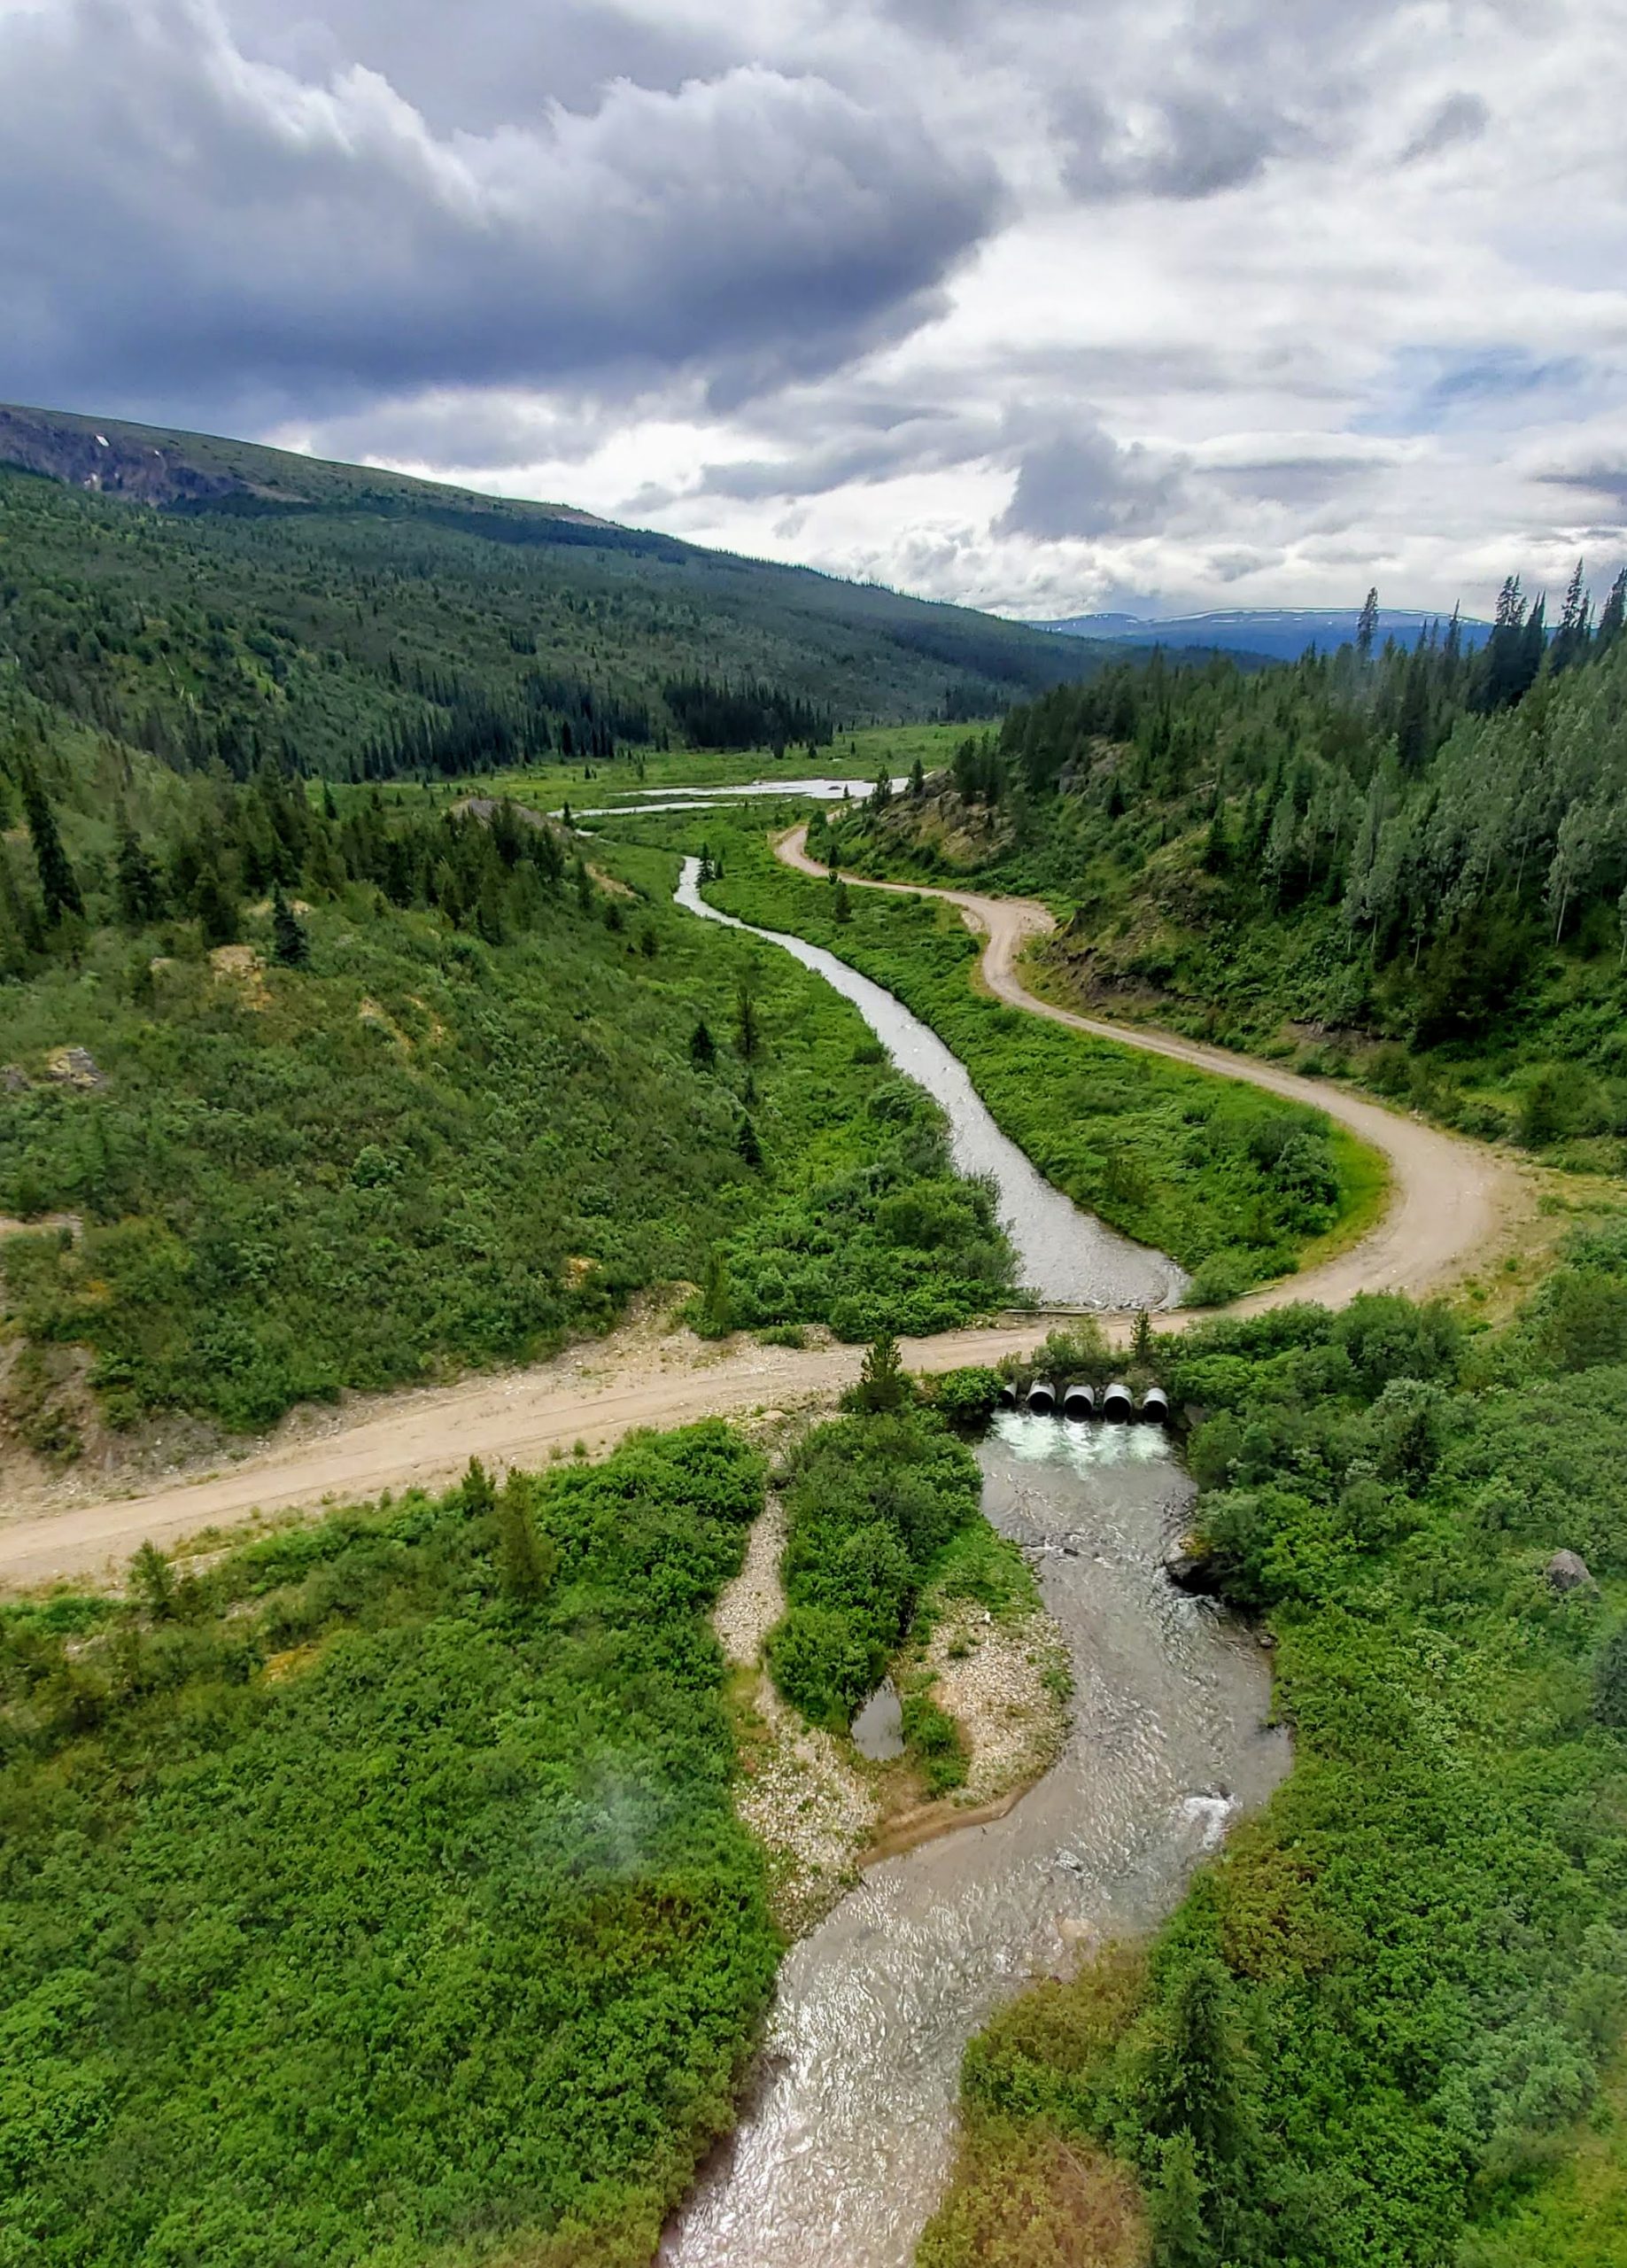
Well managed and established culverts at Jock Creek ensure the roads stay in good condition year round.
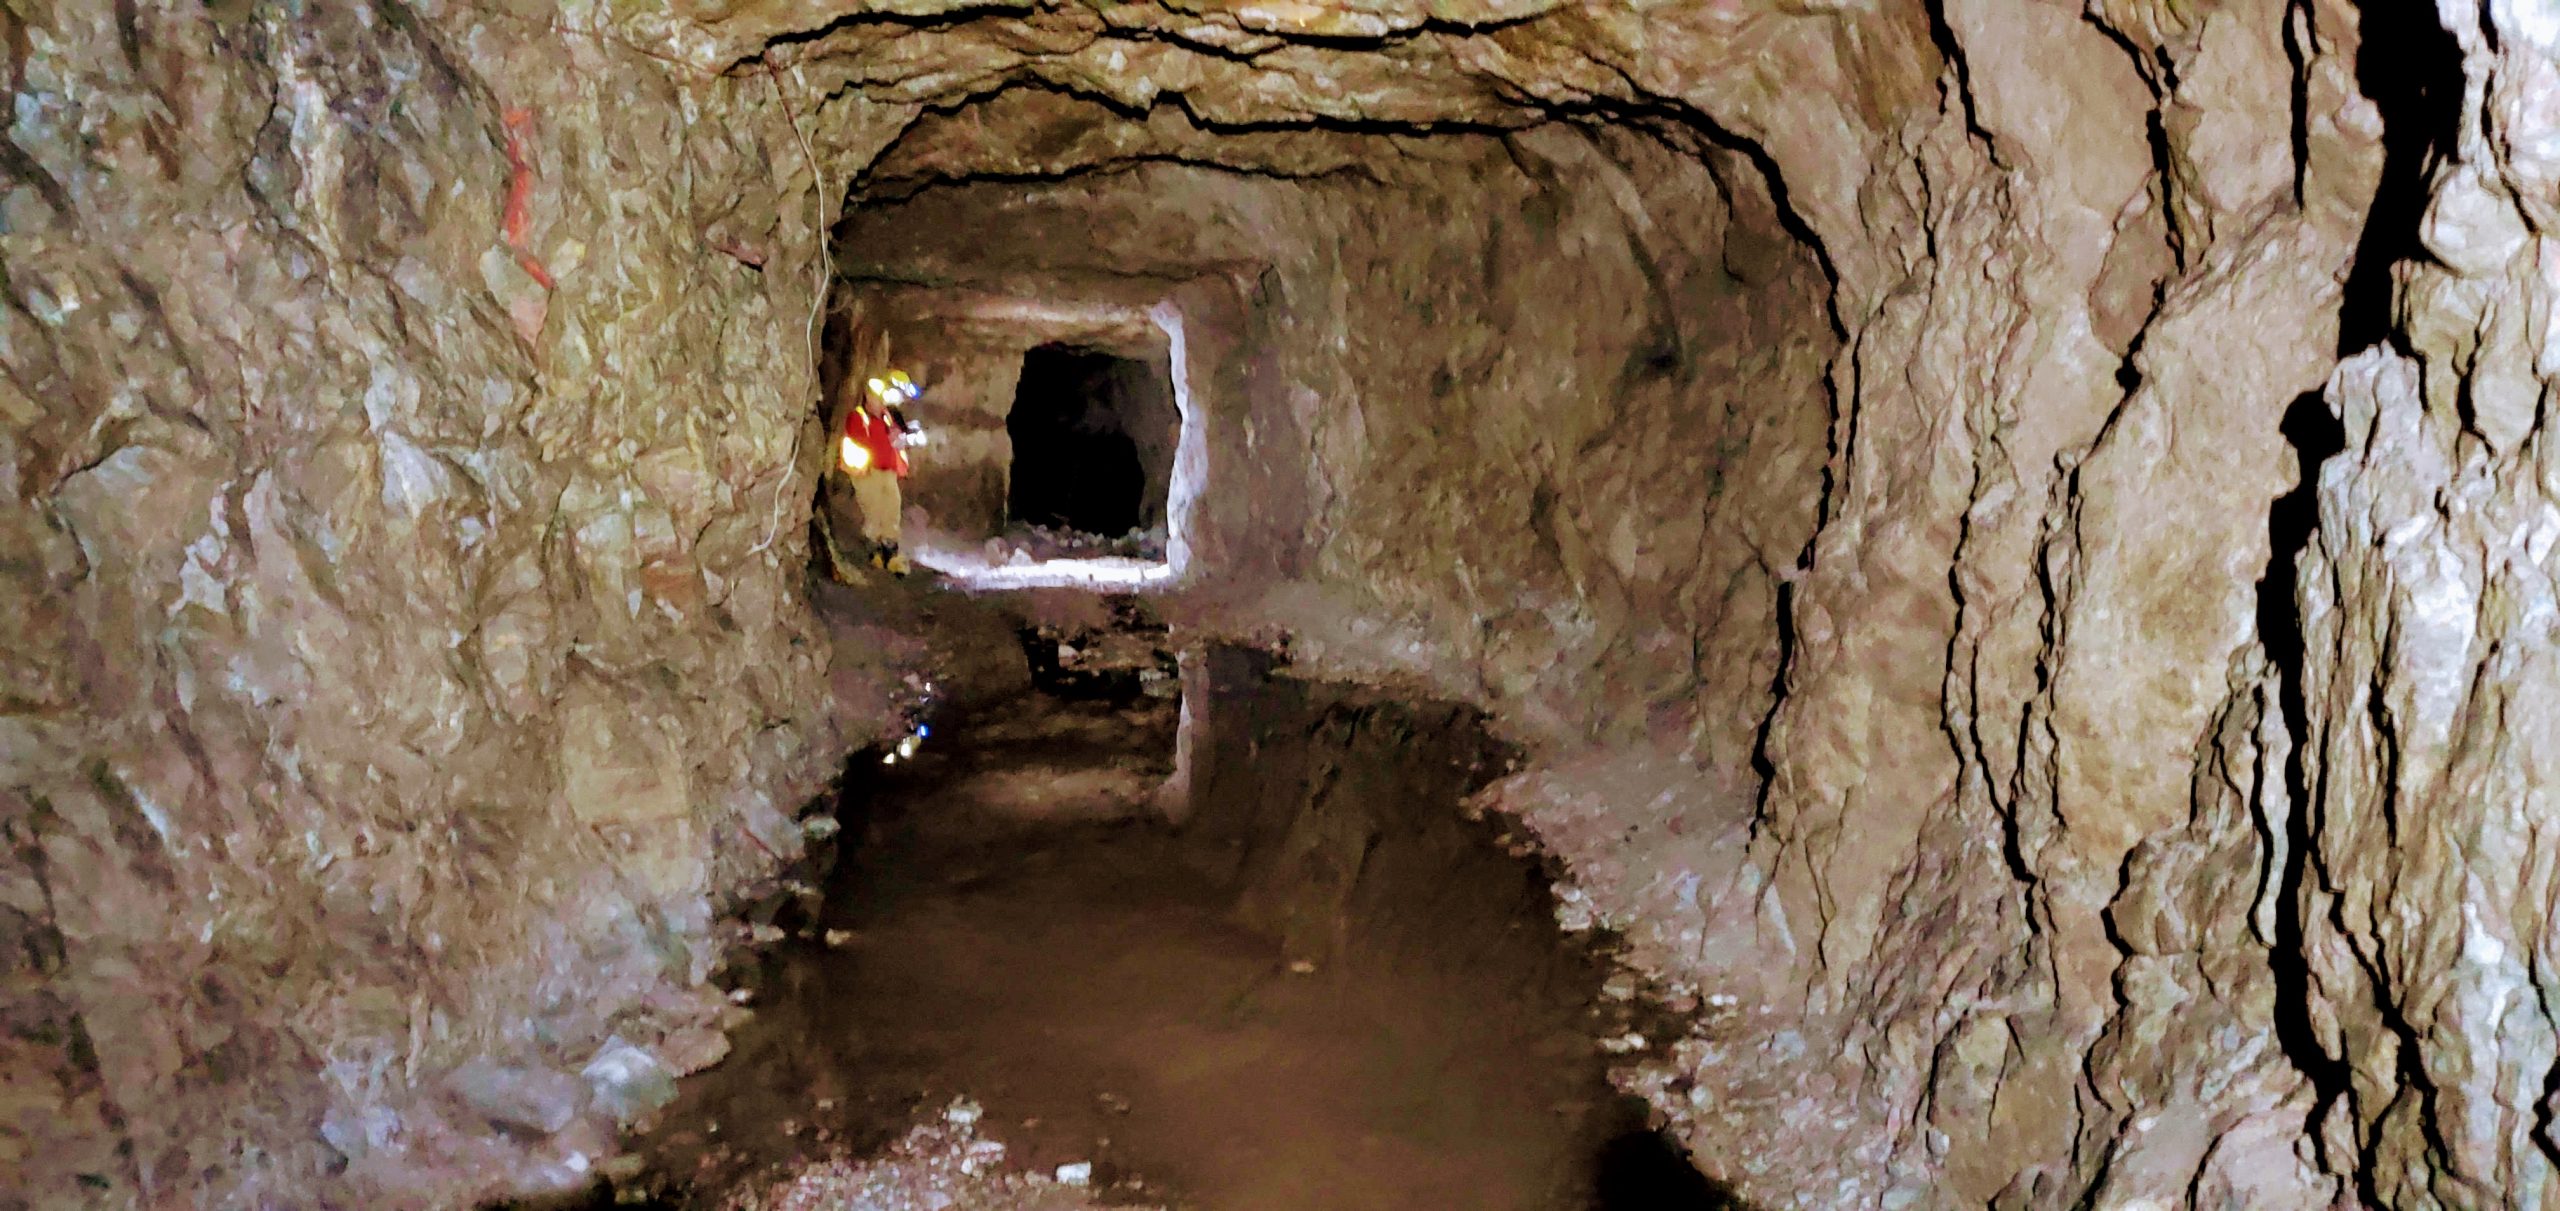
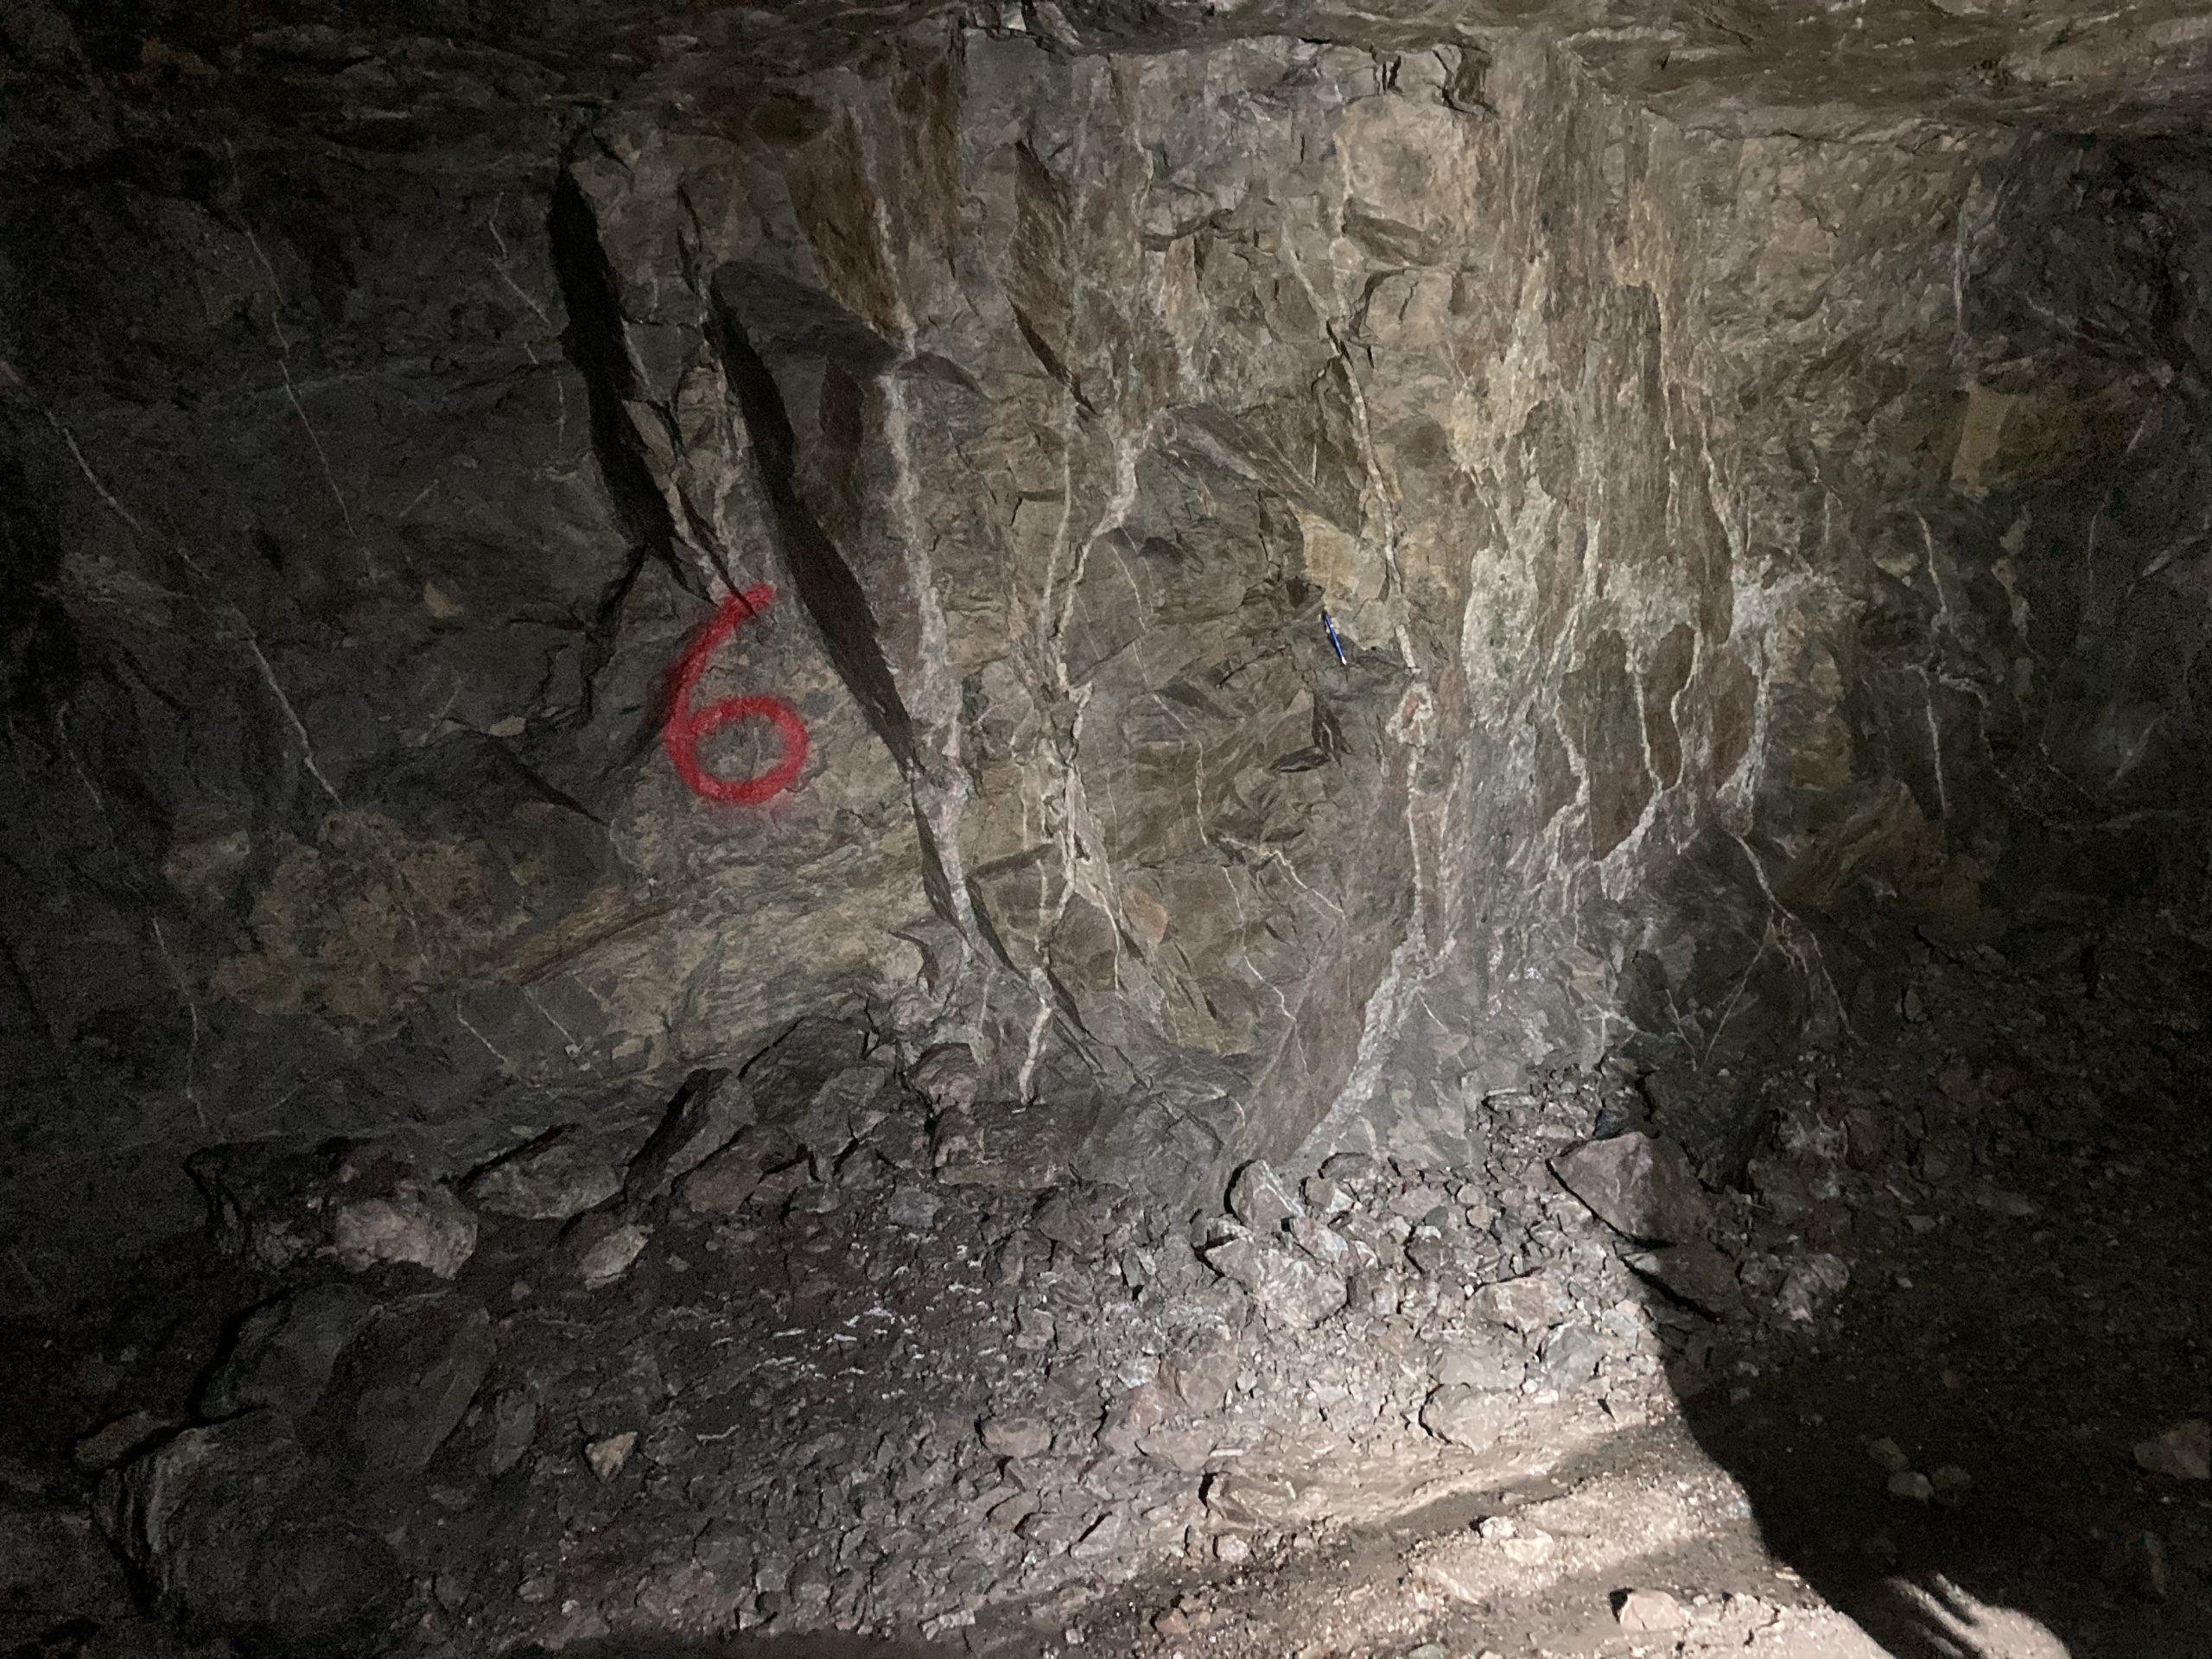
Example of state and scale of underground workings at Shasta (taken October 2020)
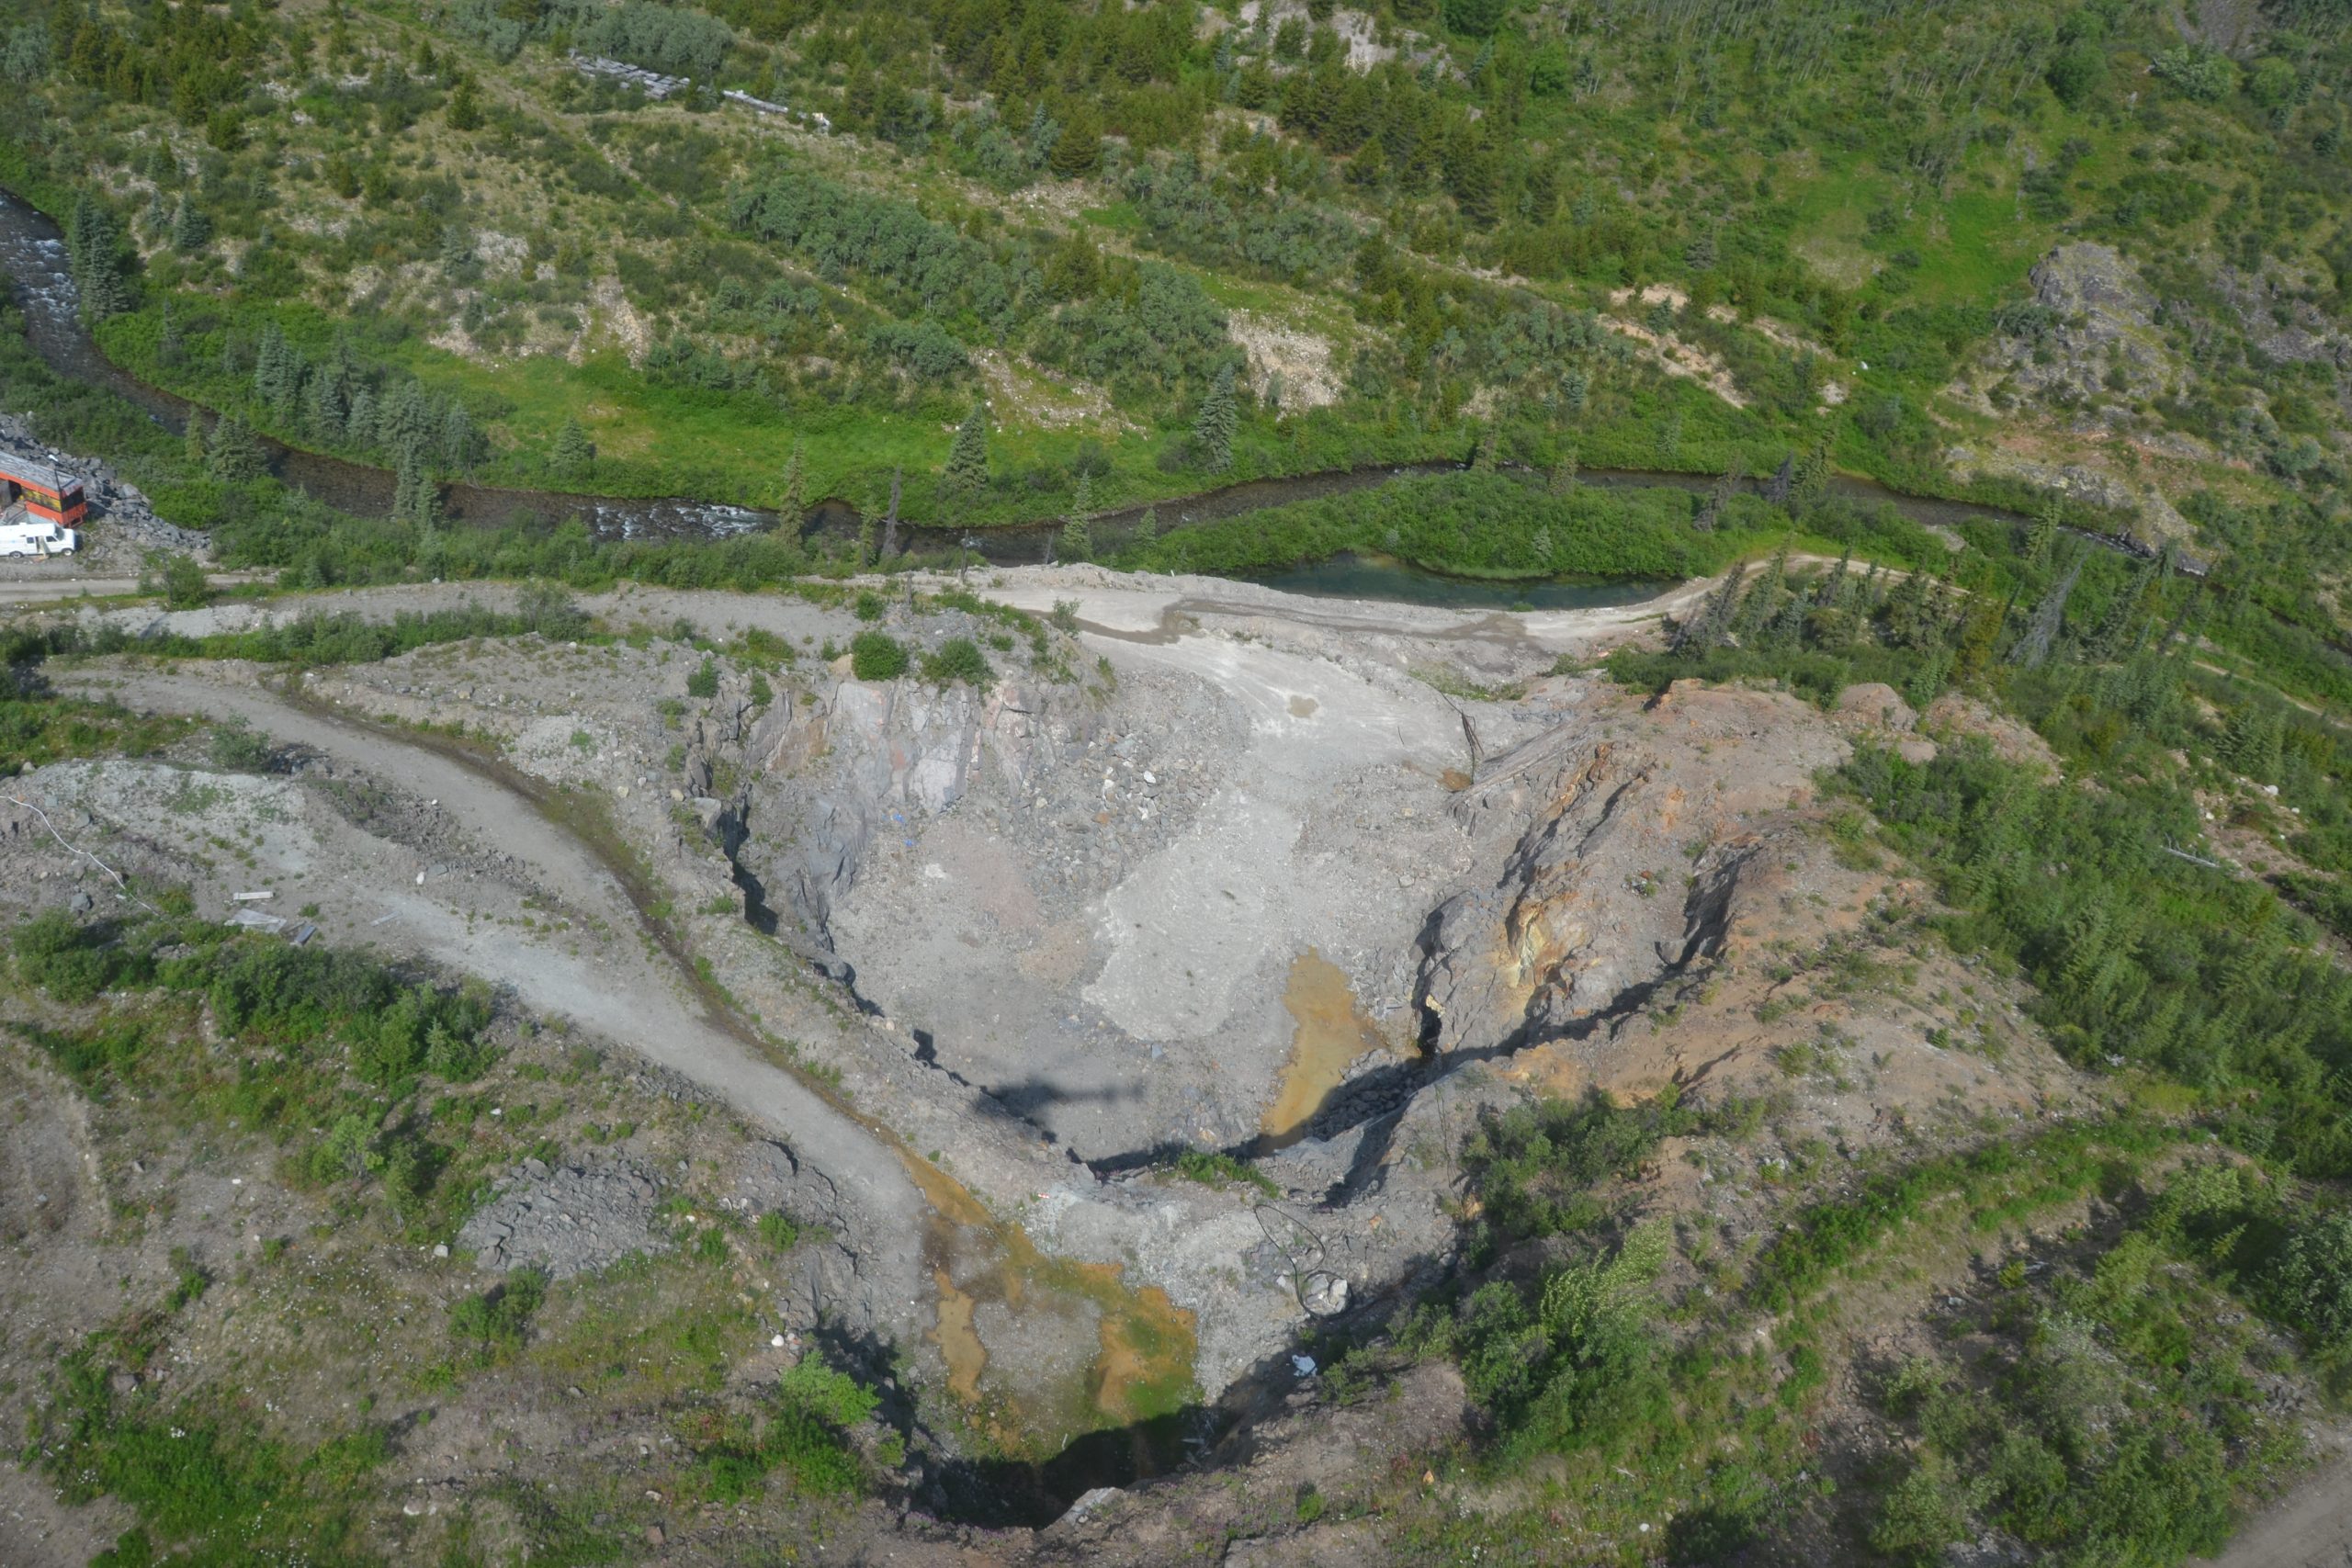
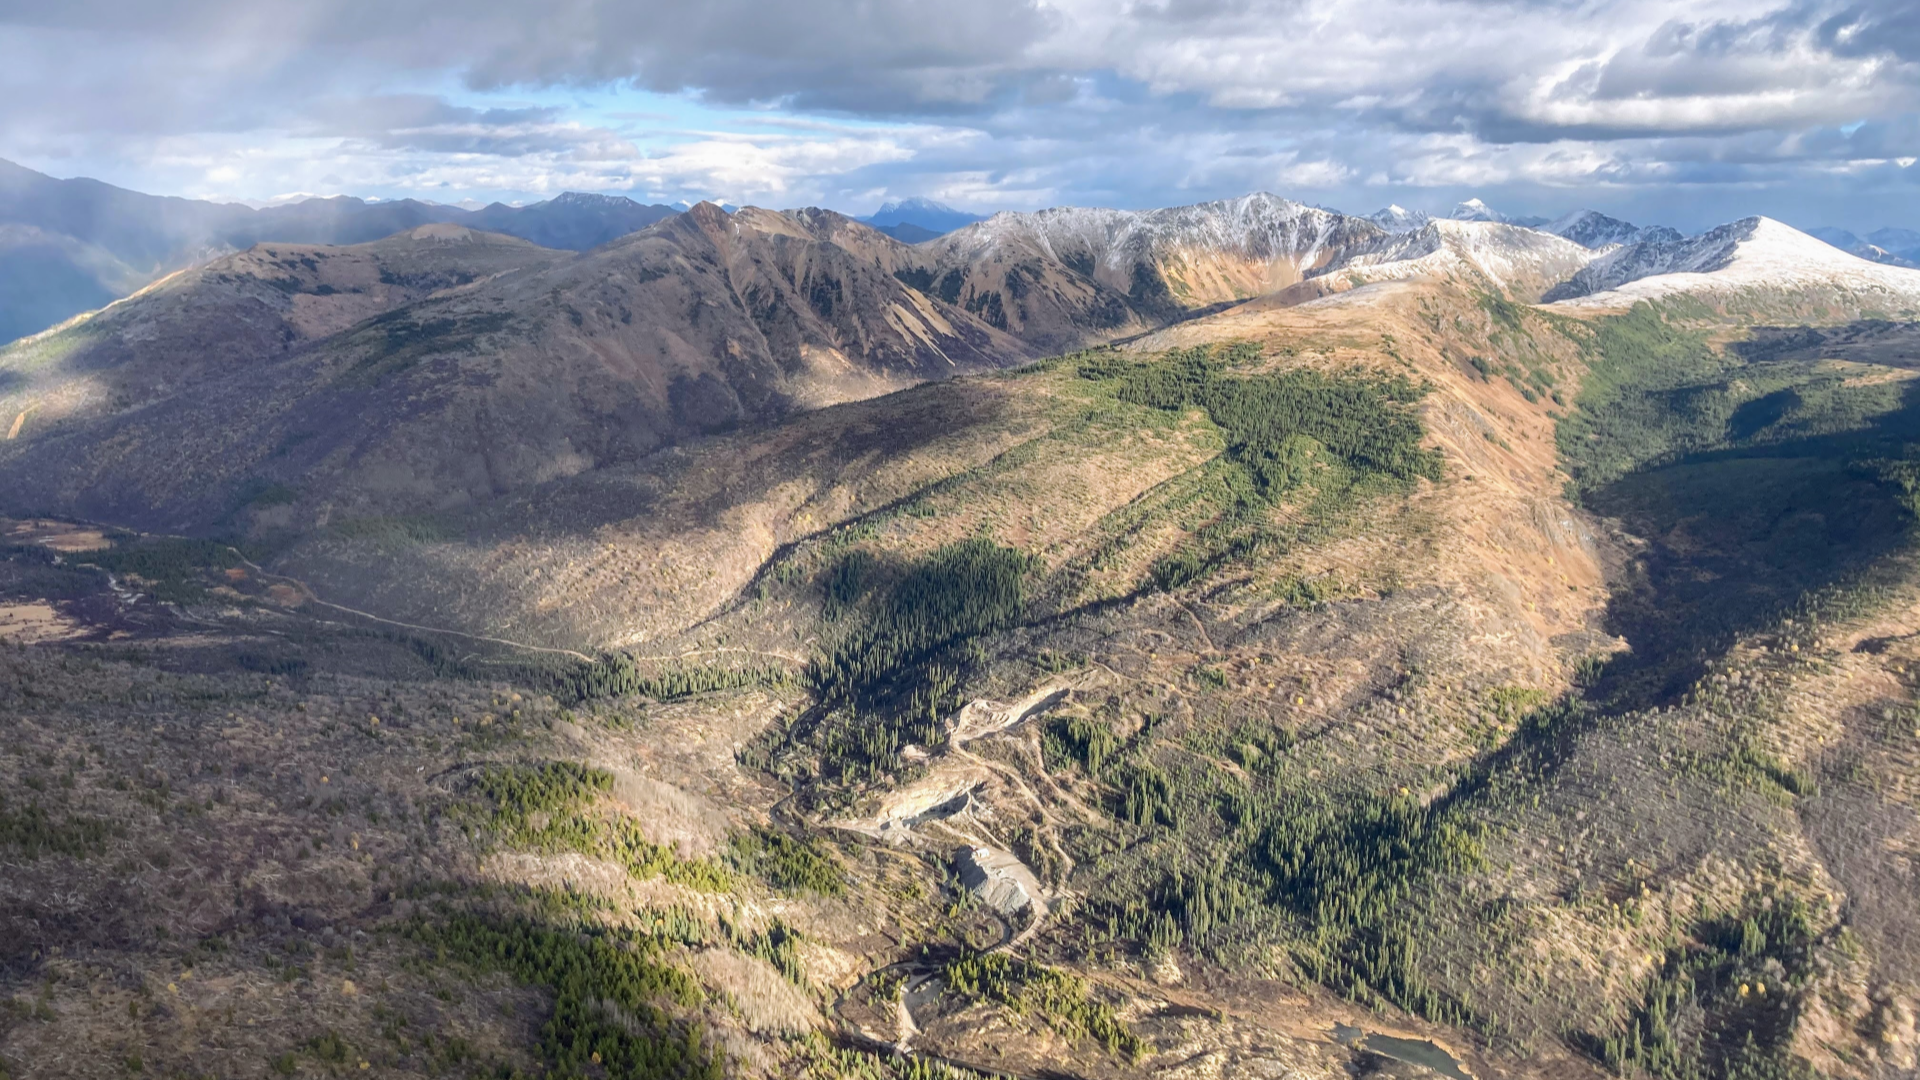
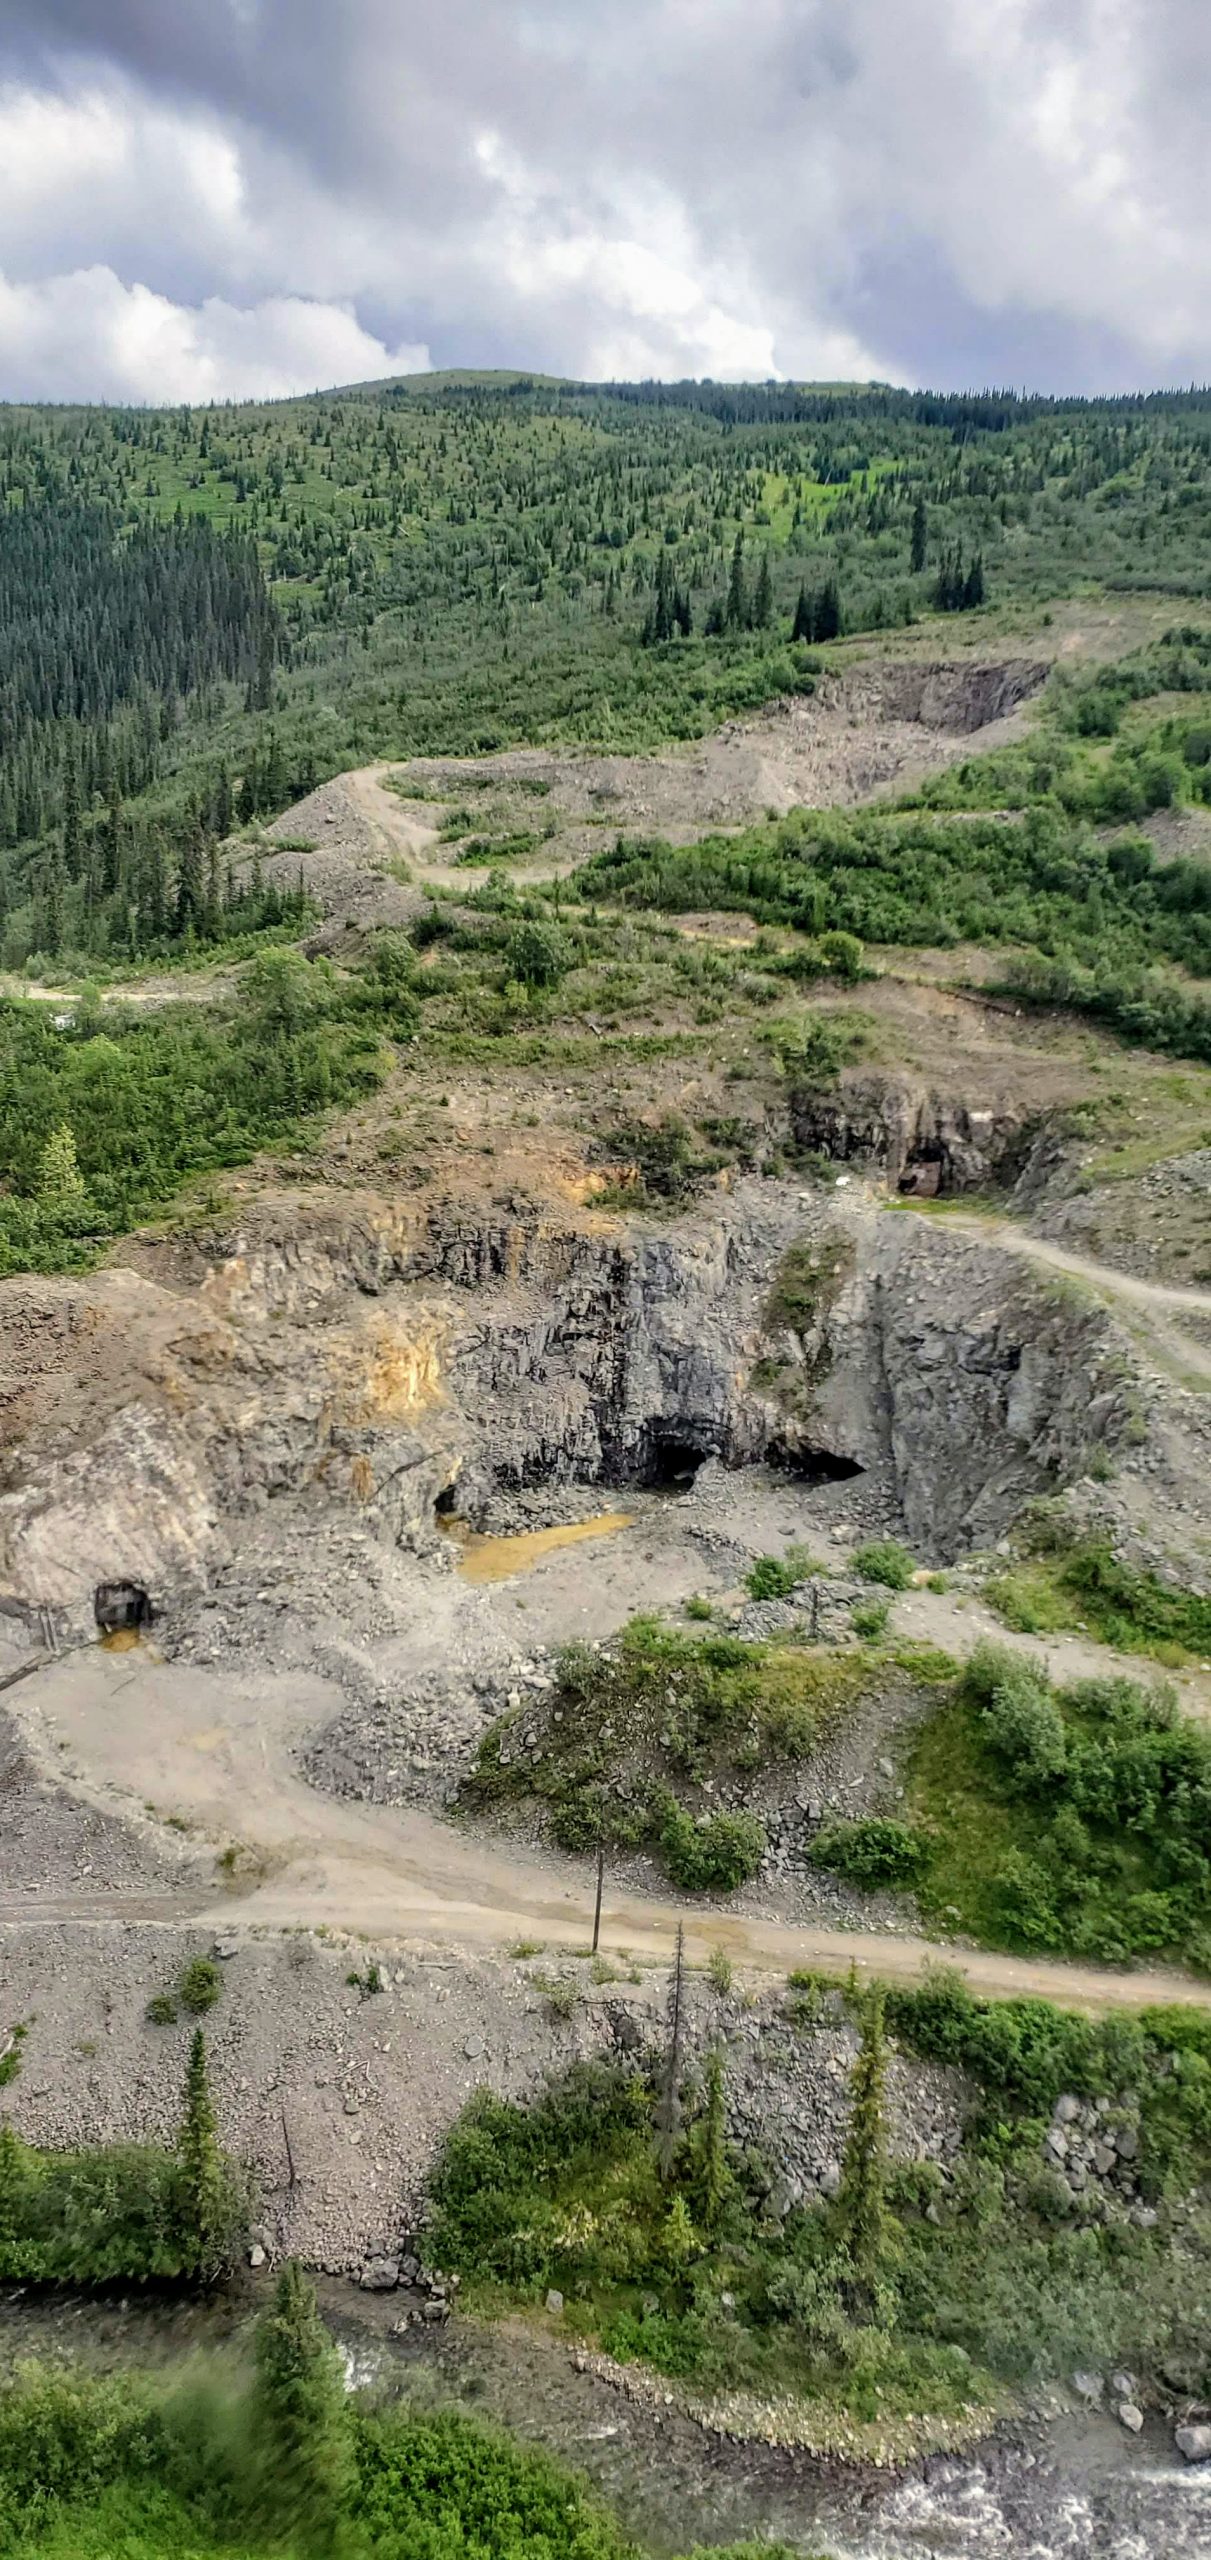
Aerial view of Creek Pit
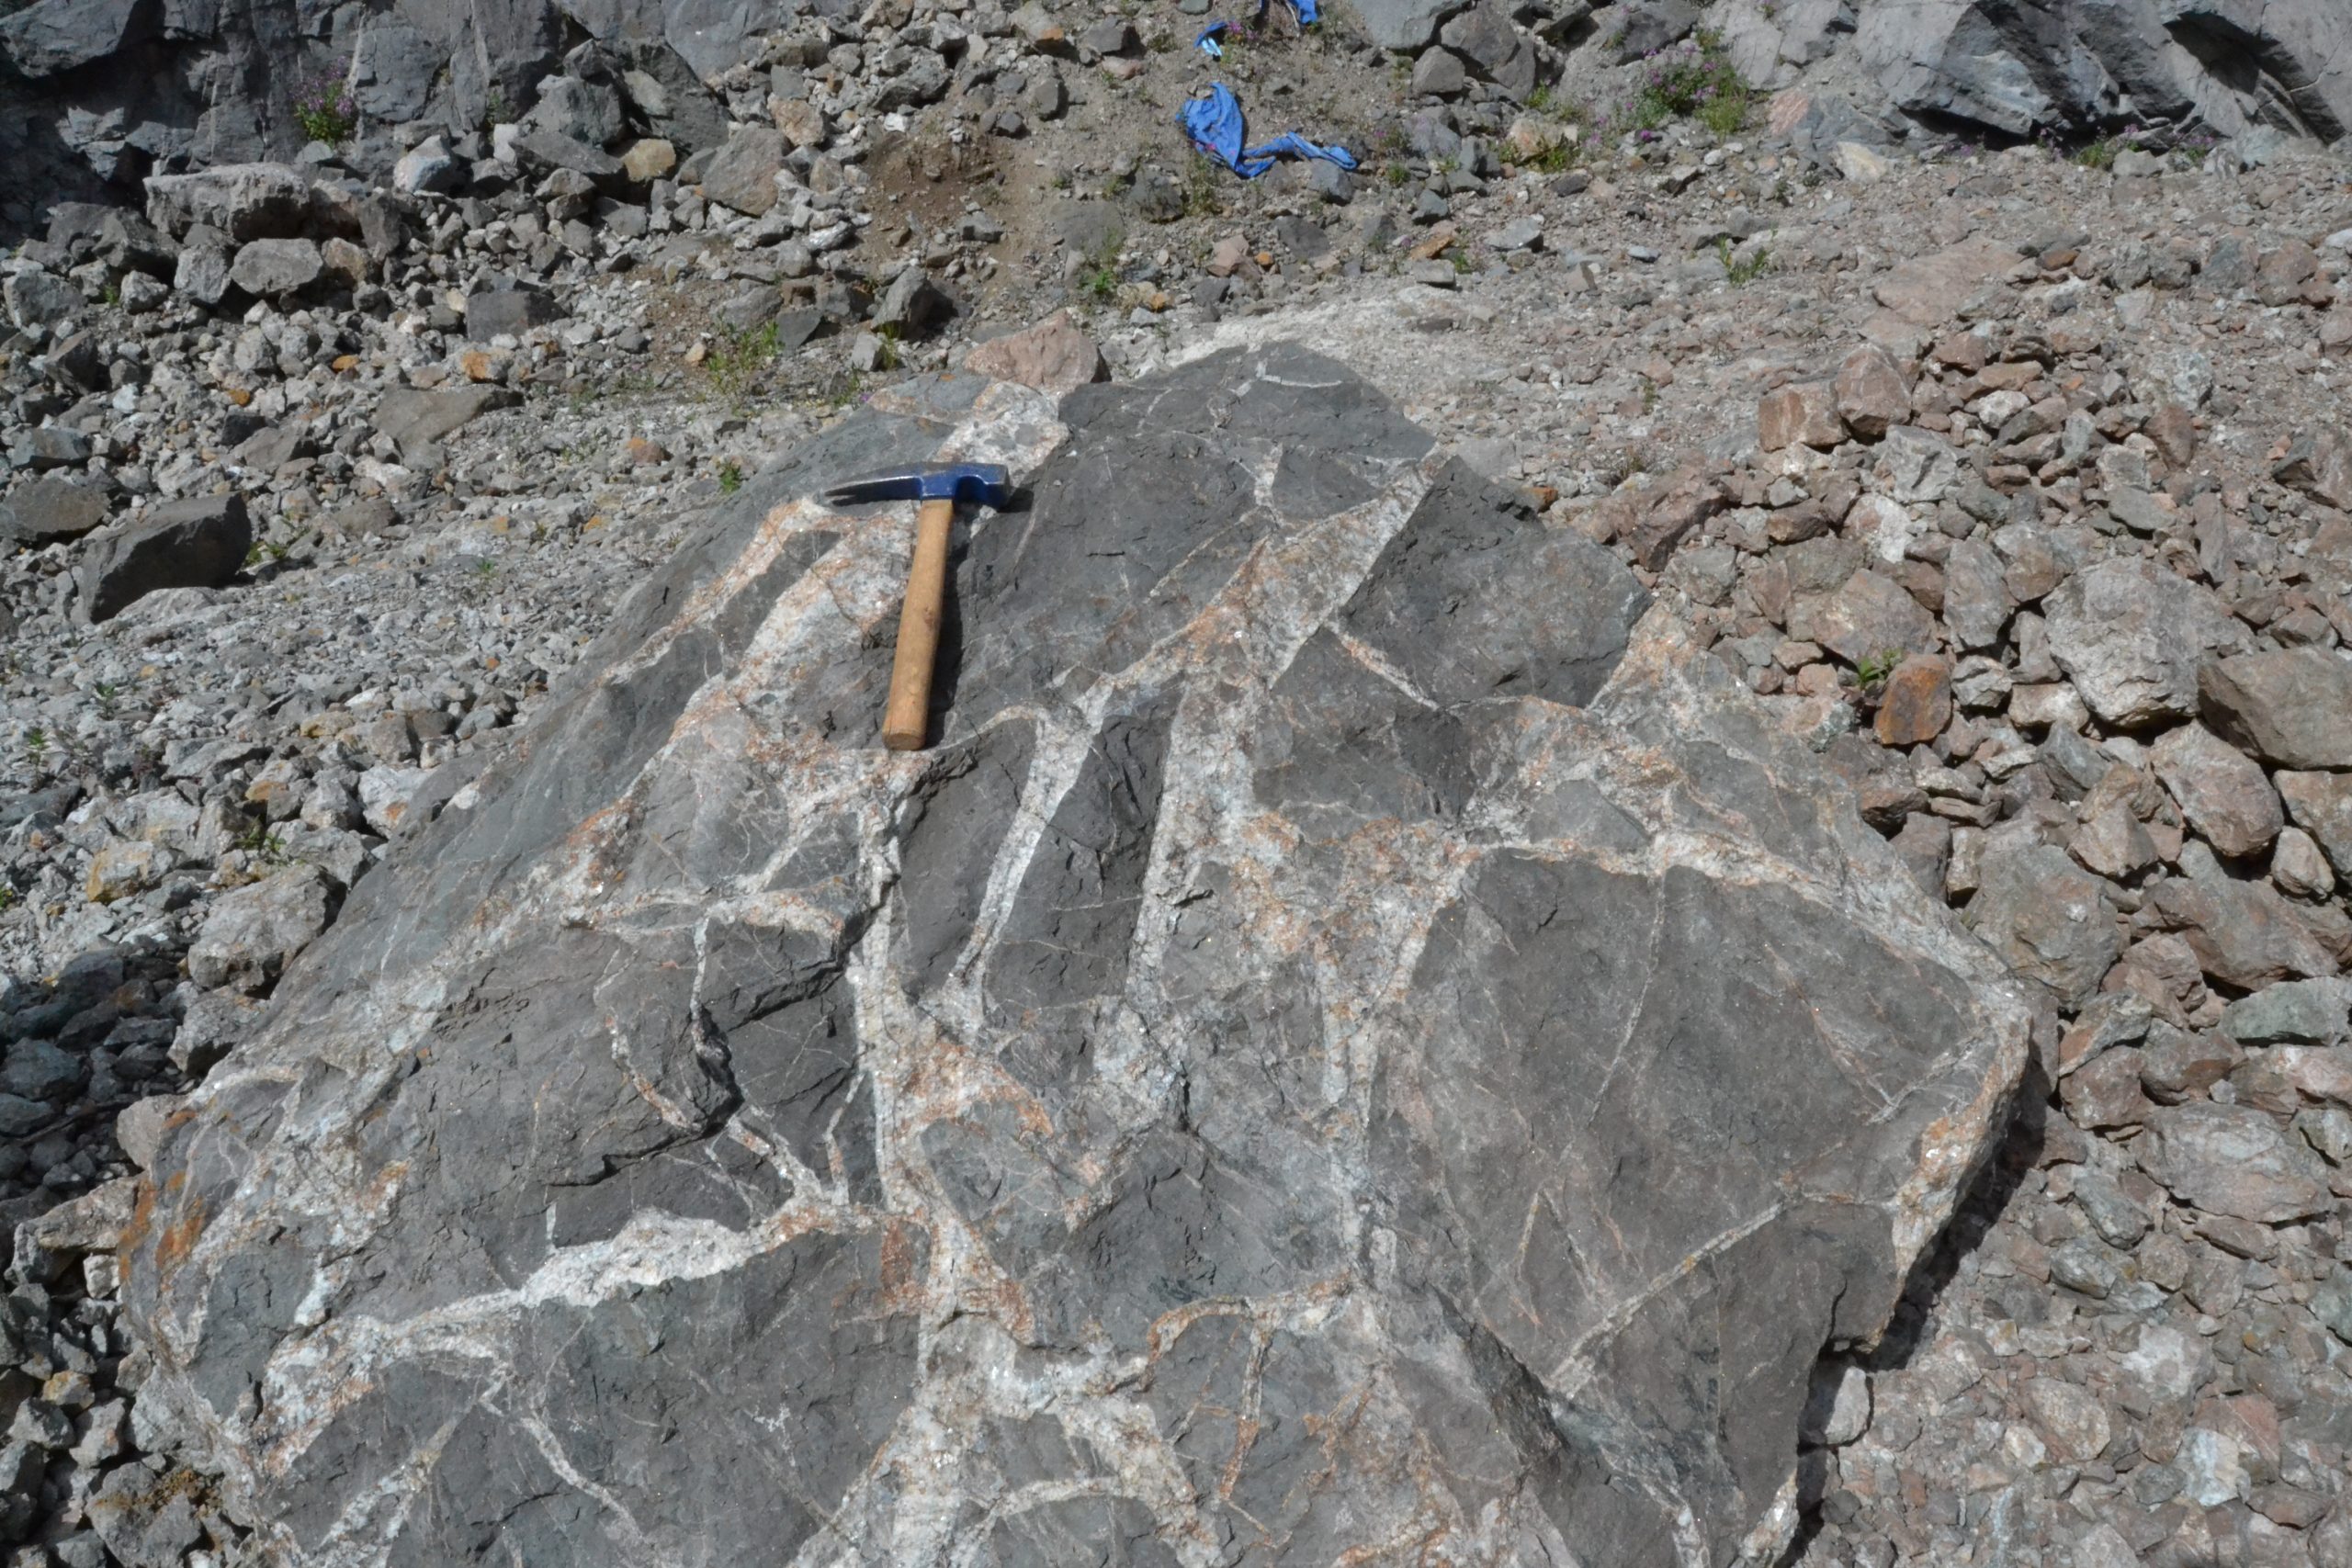
Boulder of breccia from the Shasta Fault and ore zone.
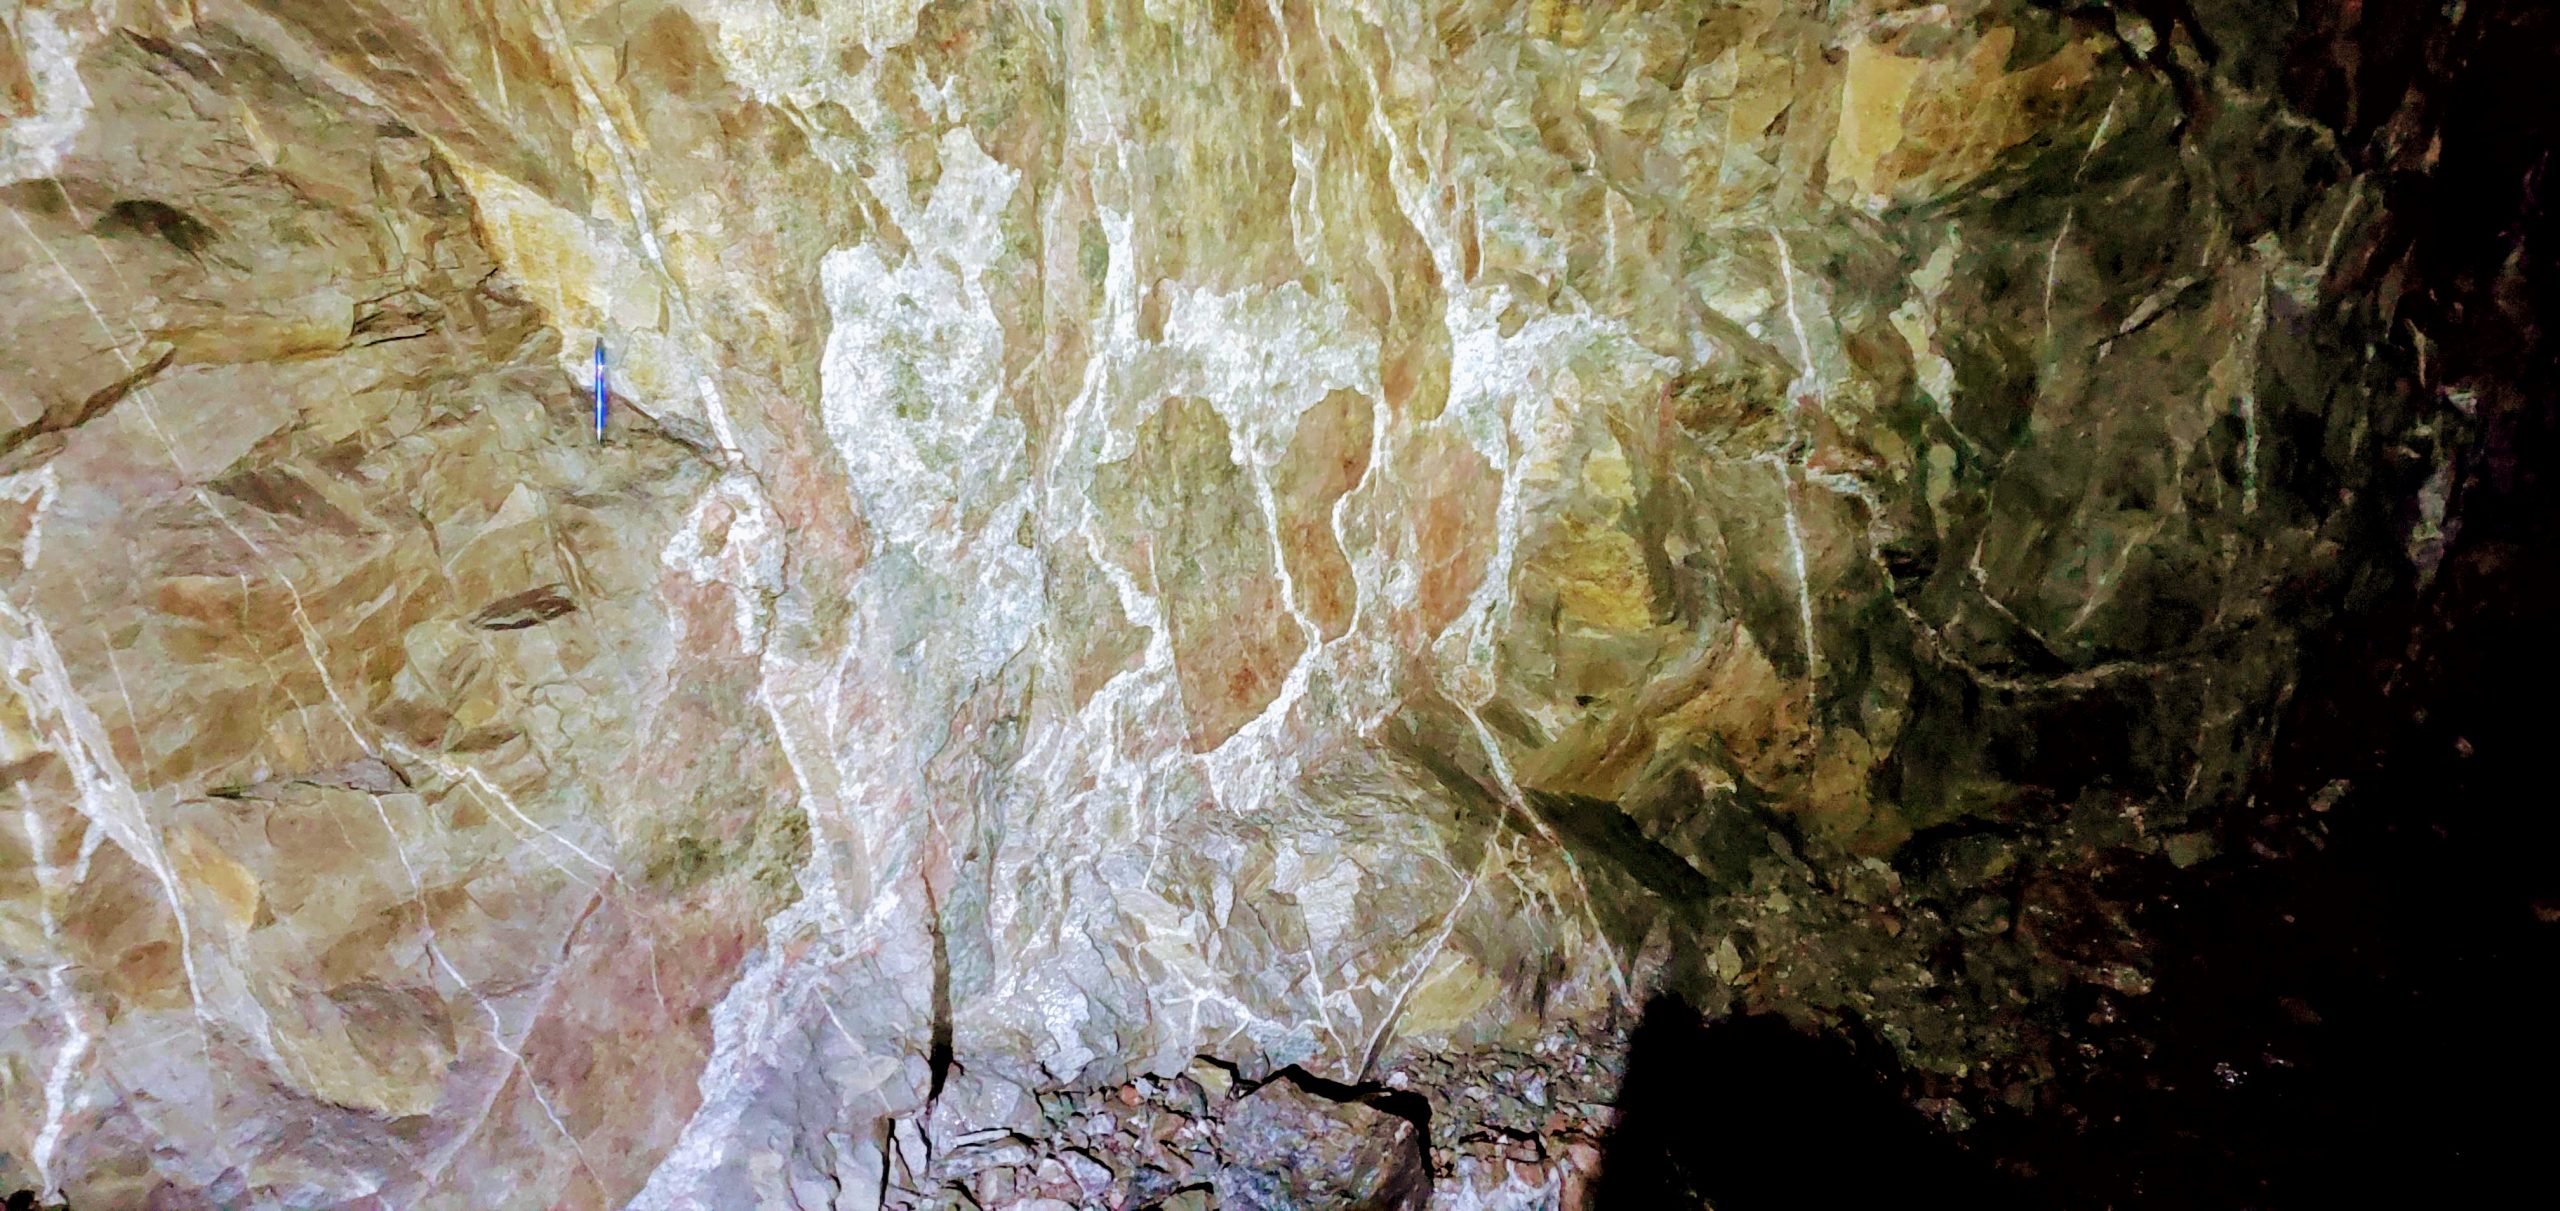
In situ ore at Shasta - comprised of brecciated volcaniclastic rocks with quartz infill.
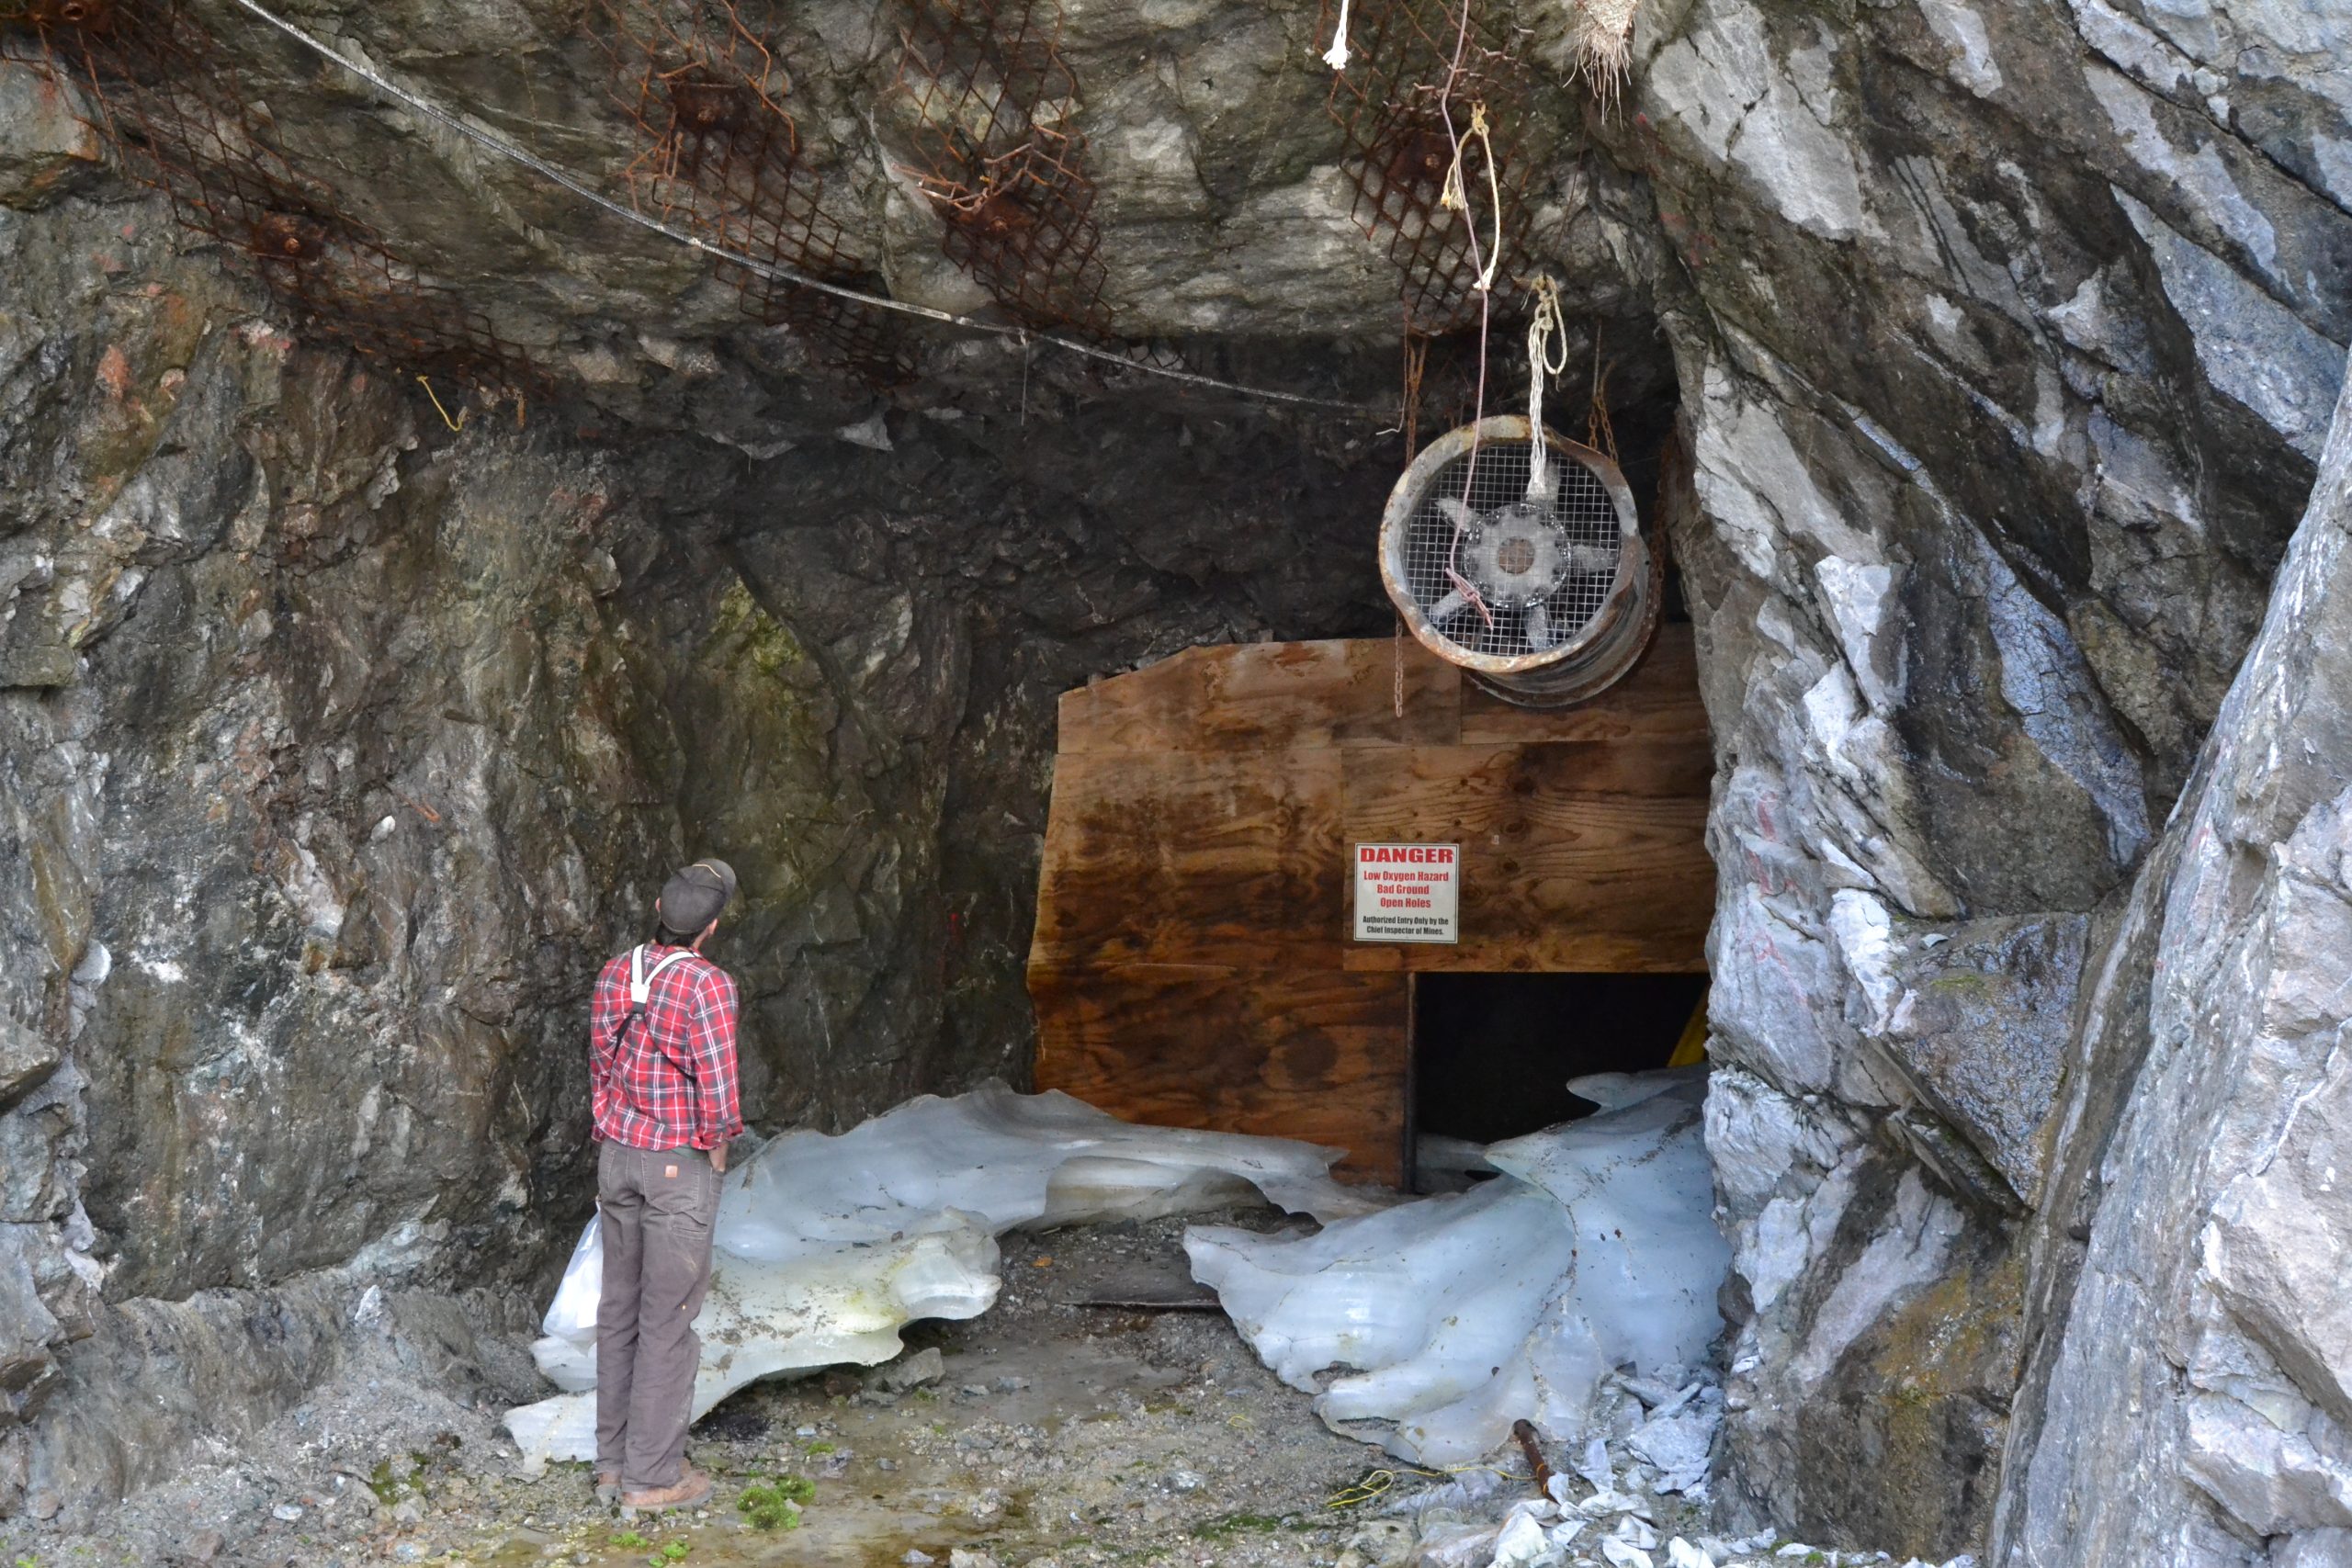
One of the underground access portals in the floor of the Creek Pit, showing 3 meter by 3 meter scale.
Historic activity (2012) in the Creek Pit, removing ore from surface to be sent to nearby Baker Mill.
Drill core from 1980's onwards is stored close to the pits. Pile is in relatively good condition and should be recoverable.
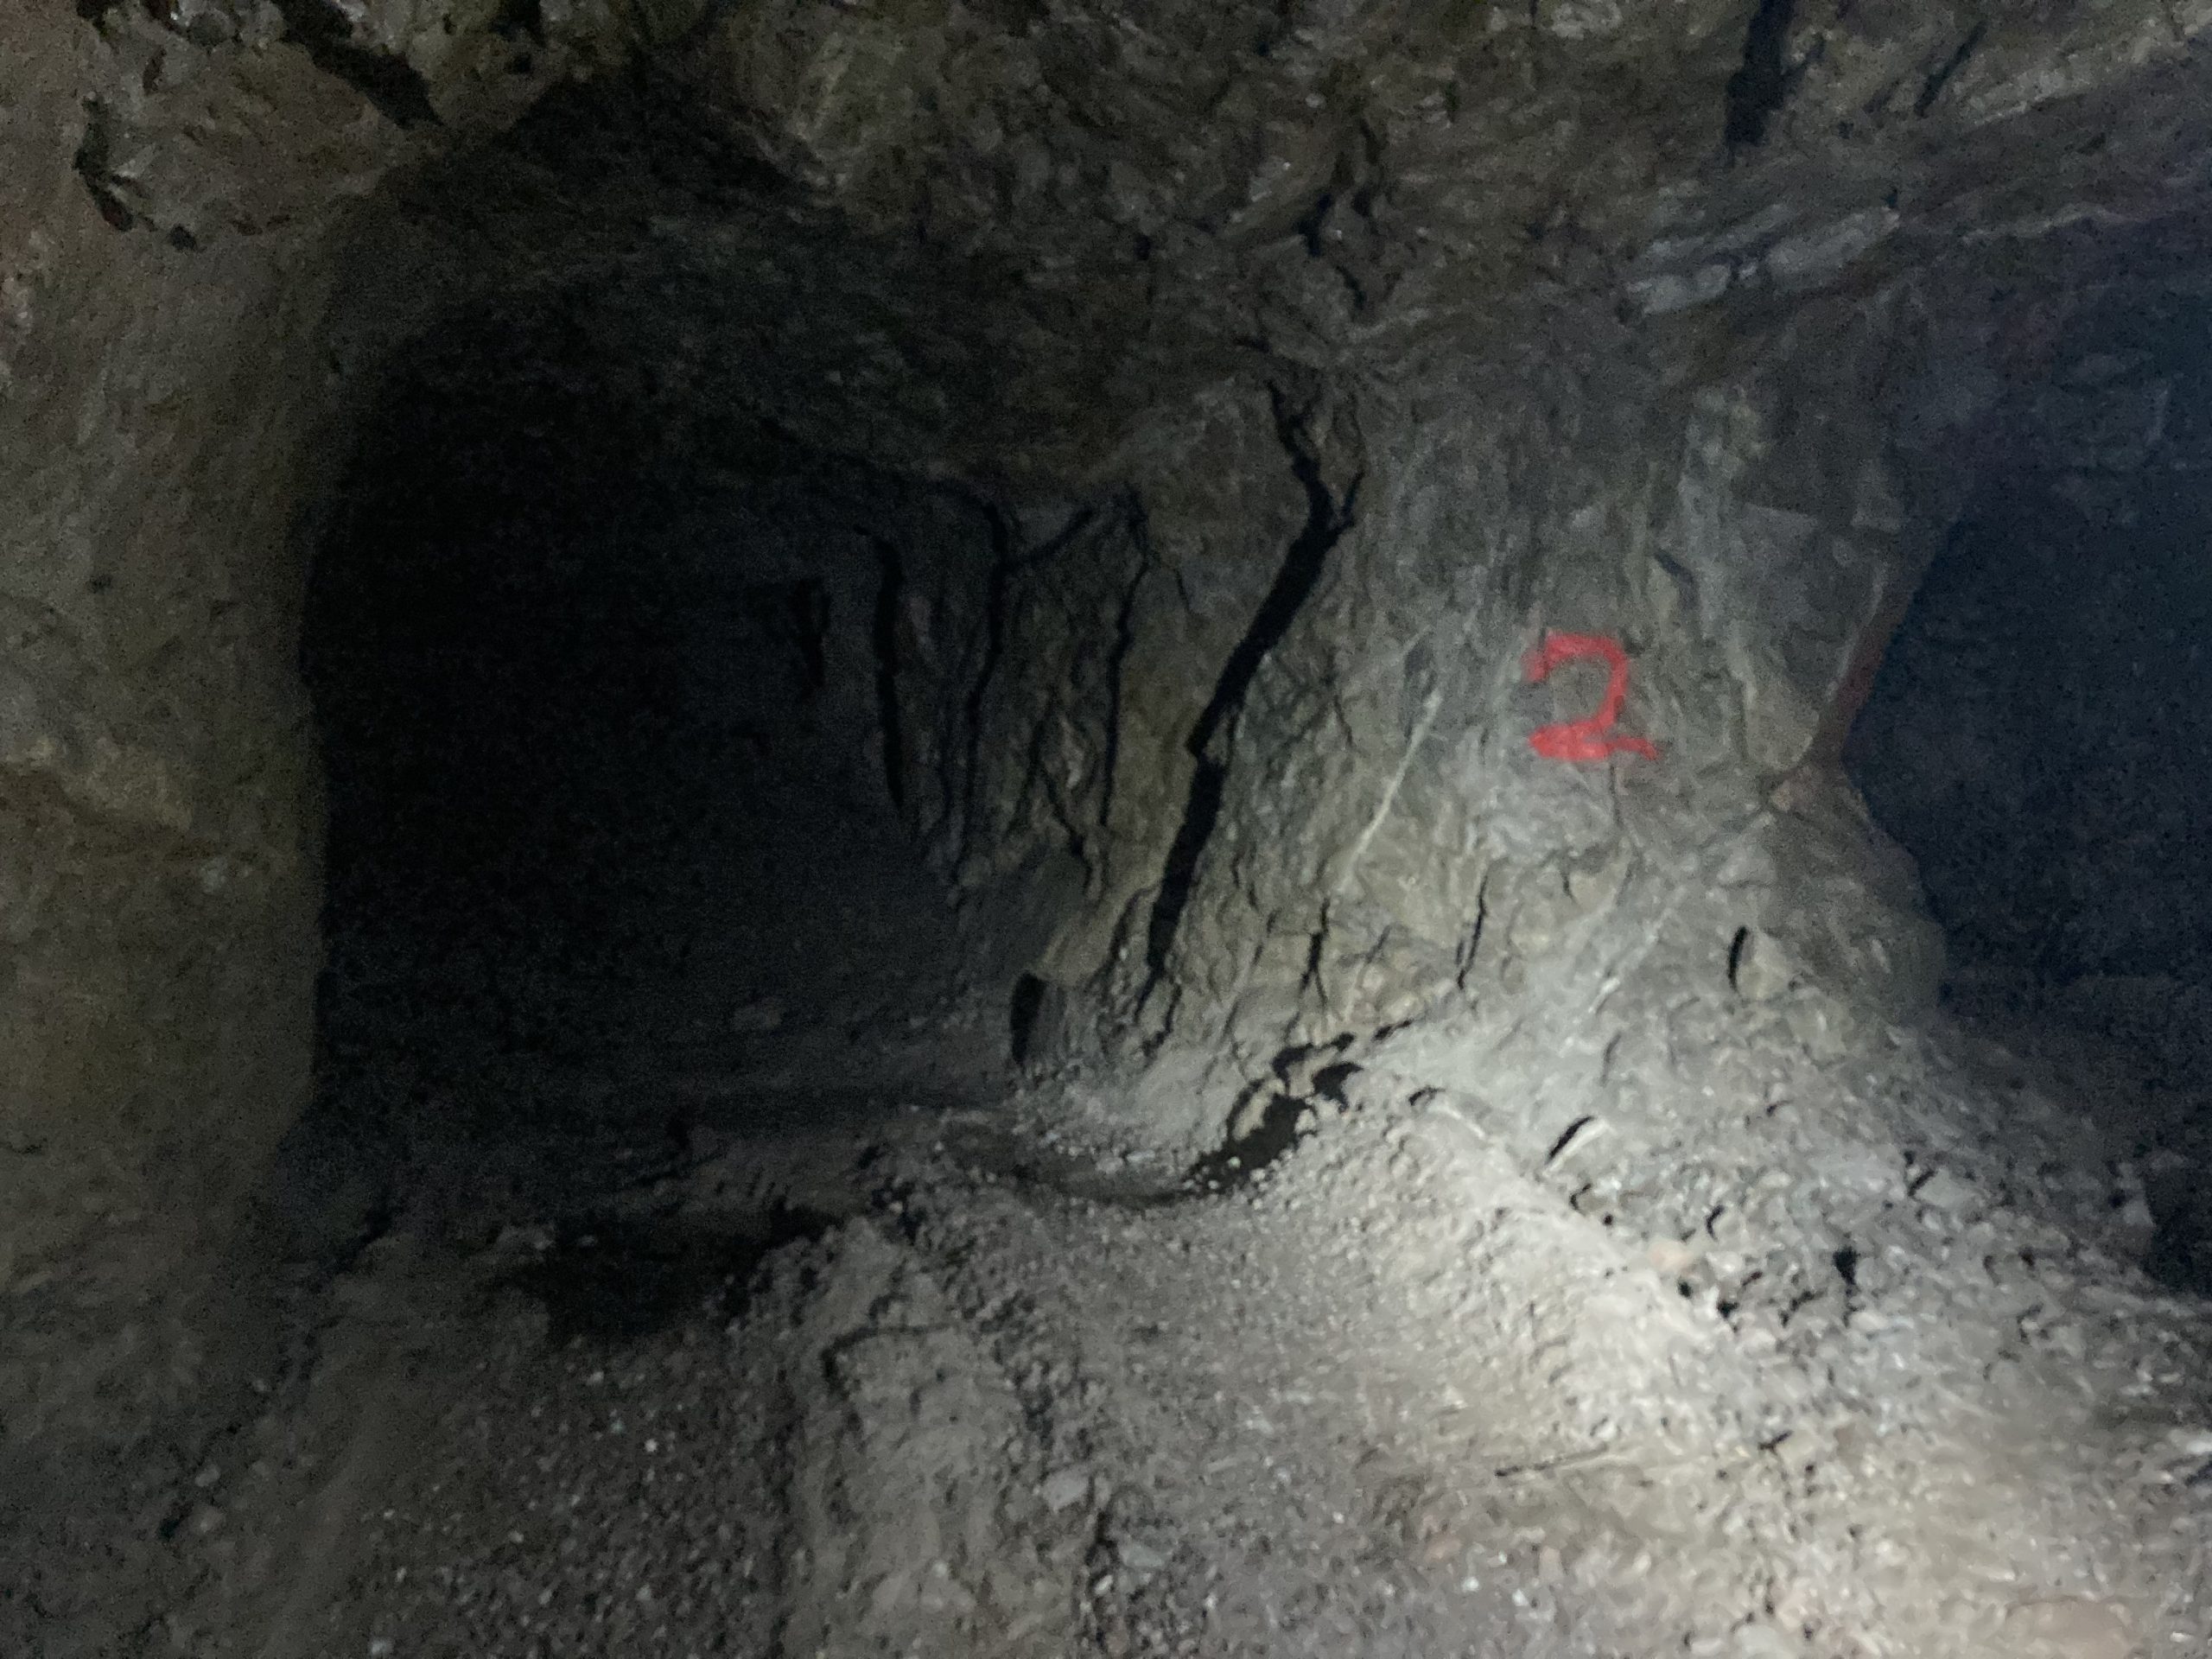
Split in underground workings to access additional levels and drill stations.
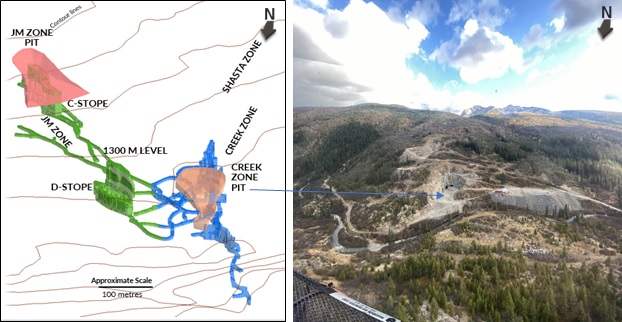
Side by side comparison of surface and underground workings.
Brecciated material and quartz veining within the Shasta fault zone.