
The global anti-aging market for anti-wrinkle products is driven by increase in consumer consciousness and surge in awareness about aging signs among the younger generation. Moreover, increase in the geriatric population and rise in expenditure on cosmetics used to reduce wrinkles and fine lines in emerging countries are factors contributing to the growth of the global market. Furthermore, recent acquisitions and distribution strategies have led to increase in the geographical reach of key players. For instance, in November 2018, Procter & Gamble acquired Merck KGaA’s consumer health business. The acquisition is expected to help Proctor & Gamble increase its OTC geographical scale, category footprint, and brand portfolio. However, rise in side effects of anti-wrinkle products is expected to restrain the global anti-aging market for anti-wrinkle products.
Based on product, the global anti aging market for anti-wrinkle products has been segmented into creams, serums, gels, and others. The creams segment is projected to account for major share of the market during the forecast period, attributed to increase in the number of women using anti-wrinkle creams to reduce signs of aging and availability of a range of branded creams with anti-aging effect. In terms of target group, the market has been bifurcated into male and female. The female segment accounted for the largest market share in 2018 and the trend is anticipated to continue during the forecast period. Based on ingredient, the global anti-aging market for anti-wrinkle products has been classified into retinoids, hyaluronic acids, alpha hydroxy acids, and others. In terms of treatment, the market has been divided into body treatment and facial treatment. Based on distribution channel, the global anti-aging market for anti-wrinkle products has been categorized into pharmacies, stores, and online stores. The online stores segment is expected to expand at the fastest CAGR due to increase in the availability of cosmetics online and high consumer preference for online shopping due to discounts and offers.
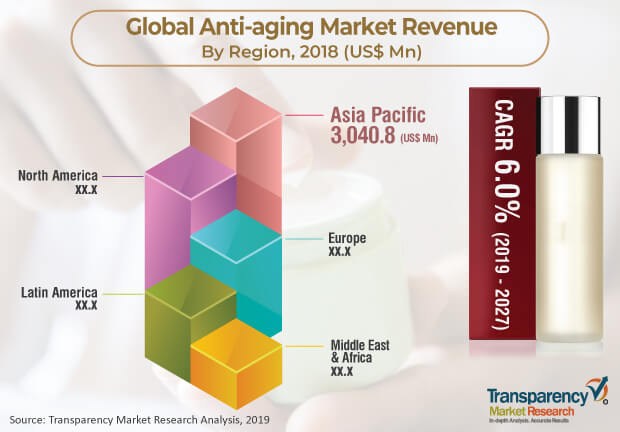
In terms of region, the global anti-aging market for anti-wrinkle products has been segmented into North America, Europe, Asia Pacific, Latin America, and Middle East & Africa. North America accounted for the largest share of the global market in 2018. Rise in concerns about personal care, lifestyle changes, and awareness about harmful effects of pollution on skin are factors likely to accelerate the growth of the market in North America. In Europe, the market is driven by availability of cosmetic products at affordable prices, rise in awareness about preventive skin care, and demand for branded cosmetics for facial treatment. The market in Asia Pacific is anticipated to grow at a rapid pace due to rise in awareness about anti-wrinkle products among adults and increase in per capita spending. Moreover, popularity of anti-aging creams is increasing in India, Japan, South Korea, and other emerging countries in Asia Pacific. Acquisitions by market players in the cosmetic industry is expected to boost the growth of the market in the region. For instance, in October 2018, Johnson & Johnson acquired Ci:z Holdings Co., Ltd., a Japan-based company focused on the development, marketing, and distribution of a broad range of dermocosmetic, cosmetic, and skincare products. The anti-aging market for anti-wrinkle products in Latin America and Middle East & Africa is expected to be driven by rise in consumer preference for skin brightening & anti-wrinkle creams, emphasis on personal care, and extensive marketing strategies adopted by skin care product manufacturers.
Major players operating in the global anti-aging market for anti-wrinkle products include Procter & Gamble Co., Johnson & Johnson, Unilever plc, Shiseido Company, Limited, ZO Skin Health, Inc., L’Oréal Paris, The Estée Lauder Companies, Inc., Beiersdorf, and PHYTOMER.
Anti-aging Market - Overview
Anti-aging creams are predominantly moisturizer-based cosmeceutical skin care products marketed with the promise of making the consumer look younger by reducing, masking or preventing signs of skin aging. These signs are laxity (sagging), rhytids (wrinkles), and photoaging, which includes erythema (redness), dyspigmentation (brown discolorations), solar elastosis (yellowing), keratoses (abnormal growths), and poor texture. Despite great demand, many anti-aging products and treatments have not been proven to give lasting or major positive effects. One study found that the best performing anti-aging creams reduced wrinkles by less than 10% over 12 weeks, which is not noticeable to the human eye. Another study found that anti-aging moisturizers were as effective as high-priced anti-wrinkle creams. Moisturizing creams work to plump up skin, making wrinkles appear smaller. Look for ingredients including glycerin and hyaluronic acid as they attract and bind water into the top layers of skin.
Anti-aging creams often are moisturizers with active ingredients that offer additional benefits. These added ingredients are intended to improve skin tone, texture, fine lines and wrinkles. The effectiveness of these products depends in part on your skin type and the active ingredient or ingredients.
The Food and Drug Administration (FDA) classifies anti-aging creams and lotions as cosmetics, which are defined as having no medical value. So, the FDA regulates them less strictly than it does drugs. This means that cosmetic products don't undergo the same rigorous testing for safety and effectiveness that topically applied medications undergo. Because the FDA doesn't evaluate anti-aging products for effectiveness, there's no guarantee that any OTC product will reduce your wrinkles.
Under the law, cosmetics must be safe when consumers use them according to product labeling, or the way in which the products are customarily used. But the law does not require cosmetics to be approved by FDA before they go on the market. Drugs, however, must have FDA approval for both safety and effectiveness before they go on the market.
The global anti-aging market for anti-wrinkle products has been segmented as below:
|
Product |
|
|
Target Group |
|
|
Ingredient |
|
|
Treatment |
|
|
Distribution Channel |
|
|
Region |
|
Anti-aging market for anti-wrinkle products was valued at US$ 8,400.0 Mn in 2018 and to reach US$ 13,940.3 Mn by 2027
Anti-aging market for anti-wrinkle products is projected to expand at a CAGR of 6.0% from 2019 to 2027
Anti-aging market for anti-wrinkle products is driven by increase in consumer consciousness and surge in awareness about aging signs among the younger generation
The creams segment is projected to account for major share of the market during the forecast period
Key players operating in the global anti-aging market for anti-wrinkle products include Procter & Gamble Co., Johnson & Johnson, Unilever plc, Shiseido Company, Limited, ZO Skin Health, Inc., L’Oréal Paris
1. Preface
1.1. Market Definition and Scope
1.2. Market Segmentation
1.3. Key Research Objectives
1.4. Research Highlights
2. Assumptions and Research Methodology
3. Executive Summary: Global Anti-aging Market for Anti-Wrinkle Products
4. Market Overview
4.1. Introduction
4.1.1. Product Definition
4.1.2. Industry Evolution / Developments
4.2. Overview
4.3. Market Dynamics
4.3.1. Drivers
4.3.2. Restraints
4.3.3. Opportunities
4.4. Global Anti-aging Market for Anti-Wrinkle Products Analysis and Forecast, 2017–2027
4.4.1. Market Revenue Projections (US$ Mn)
4.5. Porter’s Five Force Analysis
5. Market Outlook
5.1. Price Comparison Analysis (2018)
5.2. Key Vendor and Distributor Analysis
5.3. Overview of Major Brands
5.4. Patent Landscape
5.5. Product Pipeline and Clinical Trial Overview
6. Global Anti-aging Market for Anti-Wrinkle Products Analysis and Forecast, by Product
6.1. Introduction & Definition
6.2. Key Findings / Developments
6.3. Market Value & Volume Forecast, by Product, 2017–2027
6.3.1. Gels
6.3.2. Serums
6.3.3. Creams
6.3.4. Others
6.4. Market Attractiveness, by Product
7. Global Anti-aging Market for Anti-Wrinkle Products Analysis and Forecast, by Target Group
7.1. Introduction & Definition
7.2. Key Findings / Developments
7.3. Market Value & Volume Forecast, by Target Group, 2017–2027
7.3.1. Male
7.3.2. Female
7.4. Market Attractiveness, by Target Group
8. Global Anti-aging Market for Anti-Wrinkle Products Analysis and Forecast, by Ingredient
8.1. Introduction & Definition
8.2. Key Findings / Developments
8.3. Market Value & Volume Forecast, by Ingredient, 2017–2027
8.3.1. Retinoids
8.3.2. Hyaluronic Acids
8.3.3. Alpha Hydroxy Acids
8.3.4. Others
8.4. Market Attractiveness, by Ingredient
9. Global Anti-aging Market for Anti-Wrinkle Products Analysis and Forecast, by Treatment
9.1. Introduction & Definition
9.2. Key Findings / Developments
9.3. Market Value & Volume Forecast, by Treatment, 2017–2027
9.3.1. Body Care
9.3.2. Facial Care
9.4. Market Attractiveness, by Treatment
10. Global Anti-aging Market for Anti-Wrinkle Products Analysis and Forecast, by Distribution Channel
10.1. Introduction & Definition
10.2. Key Findings / Developments
10.3. Market Value & Volume Forecast, by Distribution Channel, 2017–2027
10.3.1. Pharmacies
10.3.2. Stores
10.3.3. Online Stores
10.4. Market Attractiveness, by Distribution Channel
11. Global Anti-aging Market for Anti-Wrinkle Products Analysis and Forecast, by Region
11.1. Key Findings
11.2. Market Value & Volume Forecast, by Region
11.2.1. North America
11.2.2. Europe
11.2.3. Asia Pacific
11.2.4. Latin America
11.2.5. Middle East & Africa
11.3. Market Attractiveness, by Region
12. North America Anti-aging Market for Anti-Wrinkle Products Analysis and Forecast
12.1. Introduction
12.1.1. Key Findings
12.2. Market Value & Volume Forecast, by Product, 2017–2027
12.2.1. Gels
12.2.2. Serums
12.2.3. Creams
12.2.4. Others
12.3. Market Value & Volume Forecast, by Target Group, 2017–2027
12.3.1. Male
12.3.2. Female
12.4. Market Value & Volume Forecast, by Ingredient, 2017–2027
12.4.1. Retinoids
12.4.2. Hyaluronic Acids
12.4.3. Alpha Hydroxy Acids
12.4.4. Others
12.5. Market Value & Volume Forecast, by Treatment, 2017–2027
12.5.1. Body Care
12.5.2. Facial Care
12.6. Market Value & Volume Forecast, by Distribution Channel, 2017–2027
12.6.1. Pharmacies
12.6.2. Stores
12.6.3. Online Stores
12.7. Market Value & Volume Forecast, by Country, 2017–2027
12.7.1. U.S.
12.7.2. Canada
12.8. Market Attractiveness Analysis
12.8.1. By Product
12.8.2. By Target Group
12.8.3. By Ingredient
12.8.4. By Treatment
12.8.5. By Distribution Channel
12.8.6. By Country
13. Europe Anti-aging Market for Anti-Wrinkle Products Analysis and Forecast
13.1. Introduction
13.1.1. Key Findings
13.2. Market Value & Volume Forecast, by Product, 2017–2027
13.2.1. Gels
13.2.2. Serums
13.2.3. Creams
13.2.4. Others
13.3. Market Value & Volume Forecast, by Target Group, 2017–2027
13.3.1. Male
13.3.2. Female
13.4. Market Value & Volume Forecast, by Ingredient, 2017–2027
13.4.1. Retinoids
13.4.2. Hyaluronic Acids
13.4.3. Alpha Hydroxy Acids
13.4.4. Others
13.5. Market Value & Volume Forecast, by Treatment, 2017–2027
13.5.1. Body Care
13.5.2. Facial Care
13.6. Market Value & Volume Forecast, by Distribution Channel, 2017–2027
13.6.1. Pharmacies
13.6.2. Stores
13.6.3. Online Stores
13.7. Market Value & Volume Forecast, by Country/Sub-region, 2017–2027
13.7.1. Germany
13.7.2. France
13.7.3. U.K.
13.7.4. Spain
13.7.5. Italy
13.7.6. Rest of Europe
13.8. Market Attractiveness Analysis
13.8.1. By Product
13.8.2. By Target Group
13.8.3. By Ingredient
13.8.4. By Treatment
13.8.5. By Distribution Channel
13.8.6. By Country/Sub-region
14. Asia Pacific Anti-aging Market for Anti-Wrinkle Products Analysis and Forecast
14.1. Introduction
14.1.1. Key Findings
14.2. Market Value & Volume Forecast, by Product, 2017–2027
14.2.1. Gels
14.2.2. Serums
14.2.3. Creams
14.2.4. Others
14.3. Market Value & Volume Forecast, by Target Group, 2017–2027
14.3.1. Male
14.3.2. Female
14.4. Market Value & Volume Forecast, by Ingredient, 2017–2027
14.4.1. Retinoids
14.4.2. Hyaluronic Acids
14.4.3. Alpha Hydroxy Acids
14.4.4. Others
14.5. Market Value & Volume Forecast, by Treatment, 2017–2027
14.5.1. Body Care
14.5.2. Facial Care
14.6. Market Value & Volume Forecast, by Distribution Channel, 2017–2027
14.6.1. Pharmacies
14.6.2. Stores
14.6.3. Online Stores
14.7. Market Value & Volume Forecast, by Country/Sub-region, 2017–2027
14.7.1. India
14.7.2. China
14.7.3. Japan
14.7.4. Australia & New Zealand
14.7.5. Rest of Asia Pacific
14.8. Market Attractiveness Analysis
14.8.1. By Product
14.8.2. By Target Group
14.8.3. By Ingredient
14.8.4. By Treatment
14.8.5. By Distribution Channel
14.8.6. By Country/Sub-region
15. Latin America Anti-aging Market for Anti-Wrinkle Products Analysis and Forecast
15.1. Introduction
15.1.1. Key Findings
15.2. Market Value & Volume Forecast, by Product, 2017–2027
15.2.1. Gels
15.2.2. Serums
15.2.3. Creams
15.2.4. Others
15.3. Market Value & Volume Forecast, by Target Group, 2017–2027
15.3.1. Male
15.3.2. Female
15.4. Market Value & Volume Forecast, by Ingredient, 2017–2027
15.4.1. Retinoids
15.4.2. Hyaluronic Acids
15.4.3. Alpha Hydroxy Acids
15.4.4. Others
15.5. Market Value & Volume Forecast, by Treatment, 2017–2027
15.5.1. Body Care
15.5.2. Facial Care
15.6. Market Value & Volume Forecast, by Distribution Channel, 2017–2027
15.6.1. Pharmacies
15.6.2. Stores
15.6.3. Online Stores
15.7. Market Value & Volume Forecast, by Country/Sub-region, 2017–2027
15.7.1. Brazil
15.7.2. Mexico
15.7.3. Rest of Latin America
15.8. Market Attractiveness Analysis
15.8.1. By Product
15.8.2. By Target Group
15.8.3. By Ingredient
15.8.4. By Treatment
15.8.5. By Distribution Channel
15.8.6. By Country/Sub-region
16. Middle East & Africa Anti-aging Market for Anti-Wrinkle Products Analysis and Forecast
16.1. Introduction
16.1.1. Key Findings
16.2. Market Value & Volume Forecast, by Product, 2017–2027
16.2.1. Gels
16.2.2. Serums
16.2.3. Creams
16.2.4. Others
16.3. Market Value & Volume Forecast, by Target Group, 2017–2027
16.3.1. Male
16.3.2. Female
16.4. Market Value & Volume Forecast, by Ingredient, 2017–2027
16.4.1. Retinoids
16.4.2. Hyaluronic Acids
16.4.3. Alpha Hydroxy Acids
16.4.4. Others
16.5. Market Value & Volume Forecast, by Treatment, 2017–2027
16.5.1. Body Care
16.5.2. Facial Care
16.6. Market Value & Volume Forecast, by Distribution Channel, 2017–2027
16.6.1. Pharmacies
16.6.2. Stores
16.6.3. Online Stores
16.7. Market Value & Volume Forecast, by Country/Sub-region, 2017–2027
16.7.1. GCC Countries
16.7.2. South Africa
16.7.3. Rest of Middle East & Africa
16.8. Market Attractiveness Analysis
16.8.1. By Product
16.8.2. By Target Group
16.8.3. By Ingredient
16.8.4. By Treatment
16.8.5. By Distribution Channel
16.8.6. By Country/Sub-region
17. Competition Landscape
17.1. Global Anti-aging Market for Anti-wrinkle Products Position Analysis, by Company
17.2. Market Player - Competition Matrix (By Tier and Size of companies)
17.3. Company Profiles
17.3.1. Procter & Gamble Co.
17.3.2. Johnson & Johnson
17.3.3.Unilever plc
17.3.4. Shiseido Company, Limited
17.3.5. ZO Skin Health, Inc.
17.3.6. L’Oréal Paris
17.3.7. The Estée Lauder Companies, Inc.
17.3.8. Beiersdorf
17.3.9. PHYTOMER
List of Tables
Table 01: Global Anti-aging Market for Anti-wrinkle Products Value (US$ Mn) Forecast, by Product , 2017–2027
Table 02: Global Anti-aging Market for Anti-wrinkle Products Value (US$ Mn) Forecast, by Target Group, 2017–2027
Table 03: Global Anti-aging Market for Anti-wrinkle Products Value (US$ Mn) Forecast, by Ingredient, 2017–2027
Table 04: Global Anti-aging Market for Anti-wrinkle Products Value (US$ Mn) Forecast, by Treatment, 2017–2027
Table 05: Global Anti-aging Market for Anti-wrinkle Products Value (US$ Mn) Forecast, by Distribution Channel, 2017–2027
Table 06: Global Anti-aging Market for Anti-wrinkle Products Value (US$ Mn) Forecast, by Region, 2017–2027
Table 07: North America Anti-aging Market for Anti-Wrinkle Products Value (US$ Mn) Forecast, by Product, 2017–2027
Table 08: North America Anti-aging Market for Anti-Wrinkle Products Value (US$ Mn) Forecast, by Target Group, 2017–2027
Table 09: North America Anti-aging Market for Anti-Wrinkle Products Value (US$ Mn) Forecast, by Ingredient, 2017–2027
Table 10: North America Anti-aging Market for Anti-Wrinkle Products Value (US$ Mn) Forecast, by Treatment, 2017–2027
Table 11: North America Anti-aging Market for Anti-Wrinkle Products Value (US$ Mn) Forecast, by Distribution Channel, 2017–2027
Table 12: North America Anti-aging Market for Anti-Wrinkle Products Value (US$ Mn) Forecast, by Country, 2017–2027
Table 13: Europe Anti-aging Market for Anti-Wrinkle Products Value (US$ Mn) Forecast, by Product, 2017–2027
Table 14: Europe Anti-aging Market for Anti-Wrinkle Products Value (US$ Mn) Forecast, by Target Group, 2017–2027
Table 15: Europe Anti-aging Market for Anti-Wrinkle Products Value (US$ Mn) Forecast, by Ingredient, 2017–2027
Table 16: Europe Anti-aging Market for Anti-Wrinkle Products Value (US$ Mn) Forecast, by Treatment, 2017–2027
Table 17: Europe Anti-aging Market for Anti-Wrinkle Products Value (US$ Mn) Forecast, by Distribution Channel, 2017–2027
Table 18: Europe Anti-aging Market for Anti-Wrinkle Products Value (US$ Mn) Forecast, by Country/Sub-region, 2017–2027
Table 19: Asia Pacific Anti-aging Market for Anti-Wrinkle Products Value (US$ Mn) Forecast, by Product, 2017–2027
Table 20: Asia Pacific Anti-aging Market for Anti-Wrinkle Products Value (US$ Mn) Forecast, by Target Group, 2017–2027
Table 21: Asia Pacific Anti-aging Market for Anti-Wrinkle Products Value (US$ Mn) Forecast, by Ingredient, 2017–2027
Table 22: Asia Pacific Anti-aging Market for Anti-Wrinkle Products Value (US$ Mn) Forecast, by Treatment, 2017–2027
Table 23: Asia Pacific Anti-aging Market for Anti-Wrinkle Products Value (US$ Mn) Forecast, by Distribution Channel, 2017–2027
Table 24: Asia Pacific Anti-aging Market for Anti-Wrinkle Products Size (US$ Mn) Forecast, by Country/Sub-region, 2017–2027
Table 25: Latin America Anti-aging Market for Anti-Wrinkle Products Value (US$ Mn) Forecast, by Product, 2017–2027
Table 26: Latin America Anti-aging Market for Anti-Wrinkle Products Value (US$ Mn) Forecast, by Target Group, 2017–2027
Table 27: Latin America Anti-aging Market for Anti-Wrinkle Products Value (US$ Mn) Forecast, by Ingredient, 2017–2027
Table 28: Latin America Anti-aging Market for Anti-Wrinkle Products Value (US$ Mn) Forecast, by Treatment, 2017–2027
Table 30: Latin America Anti-aging Market for Anti-Wrinkle Products Size (US$ Mn) Forecast, by Country/Sub-region, 2017–2027
Table 31: Middle East & Africa Anti-aging Market for Anti-Wrinkle Products Value (US$ Mn) Forecast, by Product, 2017–2027
Table 32: Middle East & Africa Anti-aging Market for Anti-wrinkle Products Value (US$ Mn) Forecast, by Target Group, 2017–2027
Table 33: Middle East & Africa Anti-aging Market for Anti-Wrinkle Products Value (US$ Mn) Forecast, by Ingredient, 2017–2027
Table 34: Middle East & Africa Anti-aging Market for Anti-Wrinkle Products Value (US$ Mn) Forecast, by Treatment, 2017–2027
Table 35: Middle East & Africa Anti-aging Market for Anti-Wrinkle Products Value (US$ Mn) Forecast, by Distribution Channel, 2017–2027
Table 36: Middle East & Africa Anti-aging Market for Anti-Wrinkle Products Revenue (US$ Mn) Forecast, by Country/Sub-region, 2017–2027
List of Figures
Figure 01: Global Anti-aging Market for Anti-wrinkle Products Size (US$ Mn) Forecast and Y-o-Y Growth (%) Projection, 2017–2027
Figure 02: Global Anti-aging Market for Anti-wrinkle Products Value Share, by Treatment, 2019
Figure 03: Global Anti-aging Market for Anti-wrinkle Products Value Share, by Ingredient, 2019
Figure 04: Global Anti-aging Market for Anti-wrinkle Products Value Share, by Product, 2019
Figure 05: Global Anti-aging Market for Anti-wrinkle Products Value Share, by Distribution Channel, 2019
Figure 06: Global Anti-aging Market for Anti-wrinkle Products Value Share, by Target Group, 2019
Figure 07: Global Anti-aging Market for Anti-wrinkle Products Value Share, by Region, 2019
Figure 08: Clinical Trial Analysis by Phase
Figure 09: Clinical Trial Analysis by Status
Figure 10: Clinical Trial Analysis by Completion and Termination Rate
Figure 11: Clinical Trial Analysis by Region
Figure 12: Global Anti-aging Market for Anti-wrinkle Products Value Share Analysis, by Product, 2018 and 2027
Figure 13: Global Anti-aging Market for Anti-wrinkle Products Attractiveness Analysis, by Product, 2019–2027
Figure 14: Global Anti-aging Market for Anti-wrinkle Products Revenue (US$ Mn) and Y-o-Y Growth (%), by Serums, 2017–2027
Figure 15: Global Anti-aging Market for Anti-wrinkle Products Revenue (US$ Mn) and Y-o-Y Growth (%), by Creams, 2017–2027
Figure 16: Global Anti-aging Market for Anti-wrinkle Products Revenue (US$ Mn) and Y-o-Y Growth (%), by Gels, 2017–2027
Figure 17: Global Anti-aging Market for Anti-wrinkle Products Revenue (US$ Mn) and Y-o-Y Growth (%), by Others, 2017–2027
Figure 18: Global Anti-aging Market for Anti-wrinkle Products Value Share Analysis, by Target Group, 2018 and 2027
Figure 19: Global Anti-aging Market for Anti-Wrinkle Products Attractiveness Analysis, by Target Group, 2019–2027
Figure 20: Global Anti-aging Market for Anti-wrinkle Products Revenue (US$ Mn) and Y-o-Y Growth (%), by Male, 2017–2027
Figure 21: Global Anti-aging Market for Anti-wrinkle Products Revenue (US$ Mn) and Y-o-Y Growth (%), by Female, 2017–2027
Figure 22: Global Anti-aging Market for Anti-wrinkle Products Value Share Analysis, by Ingredient, 2018 and 2027
Figure 23: Global Anti-aging Market for Anti-wrinkle Products Attractiveness Analysis, by Ingredient, 2019–2027
Figure 24: Global Anti-aging Market for Anti-wrinkle Products Revenue (US$ Mn) and Y-o-Y Growth (%), by Retinoids, 2017–2027
Figure 25: Global Anti-aging Market for Anti-wrinkle Products Revenue (US$ Mn) and Y-o-Y Growth (%), by Hyaluronic Acids, 2017–2027
Figure 26: Global Anti-aging Market for Anti-wrinkle Products Revenue (US$ Mn) and Y-o-Y Growth (%), by Alpha Hydroxy Acids, 2017–2027
Figure 29: Global Anti-aging Market for Anti-wrinkle Products Attractiveness Analysis, by Treatment, 2019–2027
Figure 30: Global Anti-aging Market for Anti-wrinkle Products Revenue (US$ Mn) and Y-o-Y Growth (%), by Body Care Treatment, 2017–2027
Figure 31: Global Anti-aging Market for Anti-wrinkle Products Revenue (US$ Mn) and Y-o-Y Growth (%), by Facial Care Treatment, 2017–2027
Figure 32: Global Anti-aging Market for Anti-wrinkle Products Value Share Analysis, by Distribution Channel, 2018 and 2027
Figure 33: Global Anti-aging Market for Anti-wrinkle Products Attractiveness Analysis, by Distribution Channel, 2019–2027
Figure 34: Global Anti-aging Market for Anti-wrinkle Products Revenue (US$ Mn) and Y-o-Y Growth (%) Forecast, by Pharmacies, 2017–2027
Figure 35: Global Anti-aging Market for Anti-wrinkle Products Revenue (US$ Mn) and Y-o-Y Growth (%) Forecast, by Stores, 2017–2027
Figure 36: Global Anti-aging Market for Anti-wrinkle Products Revenue (US$ Mn) and Y-o-Y Growth (%) Forecast, by Online Stores, 2017–2027
Figure 38: Global Anti-aging Market for Anti-wrinkle Products Attractiveness, by Region, 2019–2026
Figure 37: Global Anti-aging Market for Anti-wrinkle Products Value Share, by Region, 2018 and 2027
Figure 39: North America Anti-aging Market for Anti-Wrinkle Products Value (US$ Mn) Forecast and Y-o-Y Growth (%) Projection, 2017–2027
Figure 40: North America Anti-aging Market for Anti-Wrinkle Products Value Share Analysis, by Product, 2018 and 2027
Figure 41: North America Anti-aging Market for Anti-Wrinkle Products Attractiveness Analysis, by Product, 2019–2027
Figure 42: North America Anti-aging Market for Anti-Wrinkle Products Value Share Analysis, by Target Group, 2018 and 2027
Figure 43: North America Anti-aging Market for Anti-Wrinkle Products Attractiveness Analysis, by Target Group, 2019–2027
Figure 44: North America Anti-aging Market for Anti-Wrinkle Products Value Share Analysis, by Ingredient, 2018 and 2027
Figure 45: North America Anti-aging Market for Anti-Wrinkle Products Attractiveness Analysis, by Ingredient, 2019–2027
Figure 46: North America Anti-aging Market for Anti-Wrinkle Products Value Share Analysis, by Treatment, 2018 and 2027
Figure 47: North America Anti-aging Market for Anti-Wrinkle Products Attractiveness Analysis, by Treatment, 2019–2027
Figure 48: North America Anti-aging Market for Anti-Wrinkle Products Value Share Analysis, by Distribution Channel, 2018 and 2027
Figure 49: North America Anti-aging Market for Anti-Wrinkle Products Attractiveness Analysis, by Distribution Channel, 2019–2027
Figure 50: North America Anti-aging Market for Anti-Wrinkle Products Value Share Analysis, by Country, 2019 and 2027
Figure 51: North America Anti-aging Market for Anti-Wrinkle Products Attractiveness Analysis, by Country, 2019–2027
Figure 52: Europe Anti-aging Market for Anti-Wrinkle Products Value (US$ Mn) Forecast and Y-o-Y Growth (%) Projection, 2017–2027
Figure 53: Europe Anti-aging Market for Anti-Wrinkle Products Value Share Analysis, by Product, 2018 and 2027
Figure 54: Europe Anti-aging Market for Anti-Wrinkle Products Attractiveness Analysis, by Product, 2019–2027
Figure 55: Europe Anti-aging Market for Anti-Wrinkle Products Value Share Analysis, by Target Group, 2018 and 2027
Figure 56: Europe Anti-aging Market for Anti-Wrinkle Products Attractiveness Analysis, by Target Group, 2019–2027
Figure 57: Europe Anti-aging Market for Anti-Wrinkle Products Value Share Analysis, by Ingredient, 2018 and 2027
Figure 58: Europe Anti-aging Market for Anti-Wrinkle Products Attractiveness Analysis, by Ingredient, 2019–2027
Figure 59: Europe Anti-aging Market for Anti-Wrinkle Products Value Share Analysis, by Treatment, 2018 and 2027
Figure 60: Europe Anti-aging Market for Anti-Wrinkle Products Attractiveness Analysis, by Treatment, 2019–2027
Figure 61: Europe Anti-aging Market for Anti-Wrinkle Products Value Share Analysis, by Distribution Channel, 2018 and 2027
Figure 62: Europe Anti-aging Market for Anti-Wrinkle Products Attractiveness Analysis, by Distribution Channel, 2019–2027
Figure 63: Europe Anti-aging Market for Anti-Wrinkle Products Value Share Analysis, by Country/Sub-region, 2018 and 2027
Figure 64: Europe Anti-aging Market for Anti-Wrinkle Products Attractiveness Analysis, by Country/Sub-region, 2019–2027
Figure 65: Asia Pacific Anti-aging Market for Anti-Wrinkle Products Size (US$ Mn) Forecast and Y-o-Y Growth (%) Projection, 2017–2027
Figure 66: Asia Pacific Anti-aging Market for Anti-Wrinkle Products Value Share Analysis, by Product, 2018 and 2027
Figure 67: Asia Pacific Anti-aging Market for Anti-Wrinkle Products Attractiveness Analysis, by Product, 2019–2027
Figure 68: Asia Pacific Anti-aging Market for Anti-Wrinkle Products Value Share & Attractiveness Analysis, by Target Group
Figure 69: Asia Pacific Anti-aging Market for Anti-Wrinkle Products Attractiveness Analysis, by Target Group, 2019–2027
Figure 70: Asia Pacific Anti-aging Market for Anti-Wrinkle Products Value Share Analysis, by Ingredient, 2018 and 2027
Figure 71: Asia Pacific Anti-aging Market for Anti-Wrinkle Products Attractiveness Analysis, by Ingredient, 2019–2027
Figure 72: Asia Pacific Anti-aging Market for Anti-Wrinkle Products Value Share Analysis, by Treatment, 2018 and 2027
Figure 73: Asia Pacific Anti-aging Market for Anti-Wrinkle Products Attractiveness Analysis, by Treatment, 2019–2027
Figure 74: Asia Pacific Anti-aging Market for Anti-Wrinkle Products Value Share Analysis, by Distribution Channel, 2018 and 2027
Figure 75: Asia Pacific Anti-aging Market for Anti-Wrinkle Products Attractiveness Analysis, by Distribution Channel, 2019–2027
Figure 76: Asia Pacific Anti-aging Market for Anti-Wrinkle Products Value Share Analysis, by Country/Sub-region, 2018 and 2027
Figure 77: Asia Pacific Anti-aging Market for Anti-Wrinkle Products Attractiveness Analysis, by Country/Sub-region, 2019–2027
Figure 78: Latin America Anti-aging Market for Anti-Wrinkle Products Size (US$ Mn) Forecast and Y-o-Y Growth (%) Projection, 2017–2027
Figure 79: Latin America Anti-aging Market for Anti-Wrinkle Products Value Share Analysis, by Product, 2018 and 2027
Figure 80: Latin America Anti-aging Market for Anti-Wrinkle Products Attractiveness Analysis, by Product, 2019–2027
Figure 81: Latin America Anti-aging Market for Anti-Wrinkle Products Value Share Analysis, by Target Group, 2018 and 2027
Figure 82: Latin America Anti-aging Market for Anti-Wrinkle Products Attractiveness Analysis, by Target Group, 2019–2027
Figure 83: Latin America Anti-aging Market for Anti-Wrinkle Products Value Share Analysis, by Ingredient, 2018 and 2027
Figure 84: Latin America Anti-aging Market for Anti-Wrinkle Products Attractiveness Analysis, by Ingredient, 2019–2027
Figure 85: Latin America Anti-aging Market for Anti-Wrinkle Products Value Share Analysis, by Treatment, 2018 and 2027
Figure 86: Latin America Anti-aging Market for Anti-Wrinkle Products Attractiveness Analysis, by Treatment, 2019–2027
Figure 87: Latin America Anti-aging Market for Anti-Wrinkle Products Value Share Analysis, by Distribution Channel, 2018 and 2027
Figure 88: Latin America Anti-aging Market for Anti-Wrinkle Products Attractiveness Analysis, by Distribution Channel, 2019–2027
Figure 89: Latin America Anti-aging Market for Anti-Wrinkle Products Value Share Analysis, by Country/Sub-region, 2018 and 2027
Figure 90: Latin America Anti-aging Market for Anti-Wrinkle Products Attractiveness Analysis, by Country/Sub-region, 2019–2027
Figure 91: Middle East & Africa Anti-aging Market for Anti-Wrinkle Products Value (US$ Mn) Forecast and Y-o-Y Growth (%) Projection, 2017–2027
Figure 92: Middle East & Africa Anti-aging Market for Anti-Wrinkle Products Value Share Analysis, by Product, 2018 and 2027
Figure 93: Middle East & Africa Anti-aging Market for Anti-Wrinkle Products Attractiveness Analysis, by Product, 2019–2027
Figure 94: Middle East & Africa Anti-aging Market for Anti-Wrinkle Products Value Share Analysis, by Target Group, 2018 and 2027
Figure 95: Middle East & Africa Anti-aging Market for Anti-Wrinkle Products Attractiveness Analysis, by Target Group, 2019–2027
Figure 96: Middle East & Africa Anti-aging Market for Anti-Wrinkle Products Value Share Analysis, by Ingredient, 2018 and 2027
Figure 97: Middle East & Africa Anti-aging Market for Anti-Wrinkle Products Attractiveness Analysis, by Ingredient, 2019–2027
Figure 98: Middle East & Africa Anti-aging Market for Anti-Wrinkle Products Value Share Analysis, by Treatment, 2018 and 2027
Figure 99: Middle East & Africa Anti-aging Market for Anti-Wrinkle Products Attractiveness Analysis, by Treatment, 2019–2027
Figure 100: Middle East & Africa Anti-aging Market for Anti-Wrinkle Products Value Share Analysis, by Distribution Channel, 2018 and 2027
Figure 101: Middle East & Africa Anti-aging Market for Anti-Wrinkle Products Attractiveness Analysis, by Distribution Channel, 2019–2027
Figure 102: Middle East & Africa Anti-aging Market for Anti-Wrinkle Products Value Share Analysis, by Country/Sub-region, 2018 and 2027
Figure 103: Middle East & Africa Anti-aging Market for Anti-Wrinkle Products Attractiveness Analysis, by Country/Sub-region, 2019–2027
Copyright © Transparency Market Research, Inc. All Rights reserved
Trust Online


Anti-aging Market Insights, 2019-2027