
Analysts’ Viewpoint on Agrochemical Services Market Scenario
Agrochemicals play a crucial role in modern industrialized and intensive farming methods. They make possible the growth of food on previously uncultivatable land and maximize the yield of a given soil. Agrochemical analysis service assists farmers with the analysis and optimal usage of agrochemicals in farming. These services help provide new insights through testing and inspections. Companies manufacturing agrochemicals are conducting research & development activities to implement solutions that enable continuous advances in products while keeping costs down. Many regulatory hurdles and strategic obstacles can cause costly time-to-market delays in the industry. Agrochemical product services assist in overcoming these regulatory challenges. This is driving the global agrochemical services market.
Agrochemicals are engineered chemical or biological formulations used for improvements in quality and yield of crops. Types of agrochemical services are classified into fertilizers and pesticides. Agrochemical service is required to increase the production of food through formulation of different seeds and agrochemicals. Testing of soil is necessary to increase soil fertility. Soil testing also provides the information necessary to make intelligent decisions on the amount and composition needed to achieve a selected yield goal for a specific soil-climate management system. Regulatory guidance helps develop regulatory strategy and submissions, substantiate waiver requests and read-across arguments, formulate exposure limits and residue tolerances, provide product safety and efficacy evaluation, and conduct human health and environmental risk assessments.
Request a sample to get extensive insights into the Agrochemical Services Market
Demand for agrochemicals, such as herbicides, pesticides, and rodenticides, is rising due to the rapid growth of population, increase in need for food production, and economic growth. Majority of developing counties are striving to expand the area of arable land in order to meet the needs of the surging population. Agrochemicals help increase crop productivity. Demand for all types of farming, including horticulture, dairy farming, crop shifting, and floriculture, has been increasing across the globe. This is driving the future of agrochemical services.
Rise in demand for crop protection chemicals to safeguard against crop losses and increase yield; growth in consumer demand for sustainably produced food; and agrochemicals’ role in tackling climate change are agrochemical services market growth factors. Agrochemicals help reduce the need to convert forests into farmlands, thereby reducing potential greenhouse gas (GHG) emissions. Formulating services help improve storage, handling, safety, application, and effectiveness of agrochemicals. They enhance other active ingredients’ ability to eliminate pests, while using the minimum amount of active ingredients.
The need for soil testing and inspection methods is anticipated to rise due to the increase in usage of synthetic fertilizers and chemicals on crops. Growth in soil contamination caused by industrial effluents and wastewater has further triggered the demand for testing and inspection activities for agrochemicals. This is boosting the global agrochemical services market.
Governments of various countries are focusing on developing capabilities of pesticide testing laboratories, improving sampling process, and strengthening import inspection and registration for new biopesticides in order to increase crop production. Thus, most countries are investing significantly in agrochemicals. This is likely to drive the agrochemical services market.
About one-third of the food produced in the world is consumed by humans every year. According to the UN Environment Programme, approximately 1.3 billion tons of food gets wasted. Fruits and vegetables, and roots and tubers have the highest wastage rate. Approximately 40% of losses occur at post-harvest and processing levels in developing countries, while more than 40% of losses take place at retail and consumer levels in industrialized countries. Global agricultural productivity is not rising as fast as the demand for food, amid the impact of climate change, which has reduced productivity growth by 21% across the globe. In drier regions of Africa and Latin America, climate change has slowed productivity growth by as much as 34%.
Implementation of agrochemical services provides a low-cost method to increase production output per hectare of land and give farmers a high economic return for their labor and investment. According to the Agrochemical Federation of India, the usage of agrochemicals has increased productivity by 25%-50% in the country. Agrochemical testing service helps maintain soil conditioners, acidifiers, and nutrients.
Request a custom report on Agrochemical Services Market
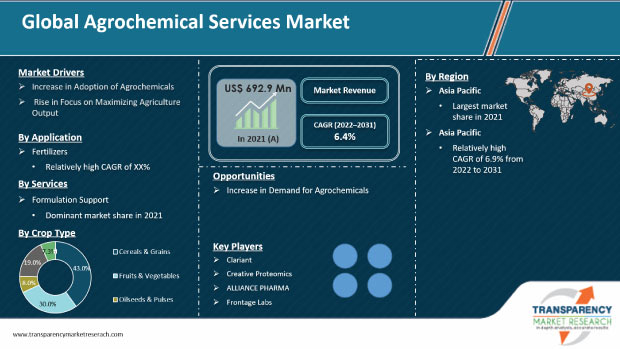
Based on services, the global agrochemical services market has been segregated into formulation support, testing & inspection, regulatory guidance, off-patent active solutions, and others. The formulation support segment held major share of 39% of the global market in 2021. It is estimated to dominate the market during the forecast period. Formulation of agrochemicals improves its storage, handling, safety, application, or effectiveness. The testing & inspection segment accounted for 27.25% share of the market in 2021. The testing & inspection segment is estimated to grow at a steady pace during the forecast period due to the rise in modern industrialization and intensive farming methods.
In terms of crop type, the global agrochemical services market has been divided into cereals & grains, oilseeds & pulses, fruits & vegetables, and others. The cereals & grains segment held major share of 48.5% of the global market in 2021. It is estimated to dominate the market during the forecast period due to the increase in demand for food quality and safety. The fruits & vegetables segment held 30.5% share of the market in 2021. The segment is estimated to grow at a steady pace during the forecast period.
Asia Pacific accounted for prominent share of 30.6% of the global market in 2021. The market in the region is projected to grow at a significant pace during the forecast period. China is a key market for agrochemical services in Asia Pacific, holding more than 78.3% share of the agrochemical services market in the region. The usage of agrochemicals in agriculture is increasing rapidly in developing countries, especially in Southeast Asia. China and India are the prominent agrochemical-producing countries in Asia. Latin America is also a key market for agrochemical services. The region held 25% share of the global market in 2021.
The global agrochemical services market is consolidated, with a small number of large-scale vendors controlling majority of the share. Several organizations are investing significantly in the study of agrochemical services. Key players operating in global agrochemical services market are Clariant, Creative Proteomics, ALLIANCE PHARMA, Frontage Labs, Intertek Group plc, PerkinElmer Inc, Bioneeds India Pvt. Ltd., Labcorp Drug Development, Baroda Agro Chemicals Ltd, JRF Global, and PI Industries.
Each of these players has been profiled in global agrochemical services market report based on parameters such as company overview, financial overview, business strategies, product portfolio, business segments, and recent developments.
|
Attribute |
Detail |
|
Market Size Value in 2021 |
US$ 692.9 Mn |
|
Market Forecast Value in 2031 |
US$ 1.27 Bn |
|
Growth Rate (CAGR) |
6.4% |
|
Forecast Period |
2022–2031 |
|
Historical Data Available for |
2020 |
|
Quantitative Units |
US$ Mn/Bn for Value |
|
Market Analysis |
It includes cross segment analysis at global as well as regional level. Furthermore, qualitative analysis includes drivers, restraints, opportunities, key trends, Porter’s Five Forces analysis, value chain analysis, and key trend analysis. |
|
Competition Landscape |
|
|
Format |
Electronic (PDF) + Excel |
|
Market Segmentation |
|
|
Regions Covered |
|
|
Countries Covered |
|
|
Companies Profiled |
|
|
Customization Scope |
Available upon request |
|
Pricing |
Available upon request |
The agrochemical services market stood at US$ 692.9 Mn in 2021.
The agrochemical services market is expected to grow at a CAGR of 6.4% from 2022 to 2031.
Increase in adoption of agrochemicals and rise in focus on maximizing agriculture output.
The cereals & grains segment accounted for 49.3% share of the agrochemical services market in 2021.
Asia Pacific is more attractive for vendors in the agrochemical services market.
Clariant, Creative Proteomics, ALLIANCE PHARMA, Frontage Labs, Intertek Group plc, PerkinElmer Inc, Bioneeds India Pvt. Ltd., Labcorp Drug Development, Baroda Agro Chemicals Ltd, JRF Global, and PI Industries.
1. Executive Summary
1.1. Agrochemical Services Market Snapshot
1.2. Current Market and Future Potential
2. Market Overview
2.1. Market Segmentation
2.2. Market Trends
2.3. Market Dynamics
2.3.1. Drivers
2.3.2. Restraints
2.3.3. Opportunities
2.4. Porter’s Five Forces Analysis
2.5. Regulatory Analysis
2.6. Value Chain Analysis
2.6.1. List of Key Manufacturers
2.6.2. List of Suppliers/ Distributors
2.6.3. List of Potential Customers
3. COVID-19 Impact Analysis
4. Production Output Analysis, 2020
5. Price Trend Analysis
6. Global Agrochemical Services Market Analysis and Forecast, by Services, 2020–2031
6.1. Introduction and Definitions
6.2. Global Agrochemical Services Market Value (US$ Mn) Forecast, by Services, 2020–2031
6.2.1. Formulation Support
6.2.2. Testing & Inspection
6.2.3. Regulatory Guidance
6.2.4. Off-Patent Active Solutions
6.2.5. Others
6.3. Global Agrochemical Services Market Attractiveness, by Services
7. Global Agrochemical Services Market Analysis and Forecast, by Crop Type, 2020–2031
7.1. Introduction and Definitions
7.2. Global Agrochemical Services Market Value (US$ Mn) Forecast, by Crop Type, 2020–2031
7.2.1. Cereals & Grains
7.2.2. Fruits & Vegetables
7.2.3. Oilseeds & Pulses
7.2.4. Others
7.3. Global Agrochemical Services Market Attractiveness, by Crop Type
8. Global Agrochemical Services Market Analysis and Forecast, by Application, 2020–2031
8.1. Introduction and Definitions
8.2. Global Agrochemical Services Market Value (US$ Mn) Forecast, by Application, 2020–2031
8.2.1. Insecticides
8.2.2. Fungicides
8.2.3. Herbicides
8.2.4. Fertilizers
8.2.5. Others
8.3. Global Agrochemical Services Market Attractiveness, by Application
9. Global Agrochemical Services Market Analysis and Forecast, by Region, 2020–2031
9.1. Key Findings
9.2. Global Agrochemical Services Market Value (US$ Mn) Forecast, by Region, 2020–2031
9.2.1. North America
9.2.2. Europe
9.2.3. Asia Pacific
9.2.4. Middle East & Africa
9.2.5. Latin America
9.3. Global Agrochemical Services Market Attractiveness, by Region
10. North America Agrochemical Services Market Analysis and Forecast, 2020–2031
10.1. Key Findings
10.2. North America Agrochemical Services Market Value (US$ Mn) Forecast, by Services, 2020–2031
10.3. North America Agrochemical Services Market Value (US$ Mn) Forecast, by Crop Type, 2020–2031
10.4. North America Agrochemical Services Market Value (US$ Mn) Forecast, by Application, 2020–2031
10.5. North America Agrochemical Services Market Value (US$ Mn) Forecast, by Country, 2020–2031
10.5.1. U.S. Agrochemical Services Market Value (US$ Mn) Forecast, by Services, 2020–2031
10.5.2. U.S. Agrochemical Services Market Value (US$ Mn) Forecast, by Crop Type, 2020–2031
10.5.3. U.S. Agrochemical Services Market Value (US$ Mn) Forecast, by Application, 2020–2031
10.5.4. Canada Agrochemical Services Market Value (US$ Mn) Forecast, by Services, 2020–2031
10.5.5. Canada Agrochemical Services Market Value (US$ Mn) Forecast, by Crop Type, 2020–2031
10.5.6. Canada Agrochemical Services Market Value (US$ Mn) Forecast, by Application, 2020–2031
10.6. North America Agrochemical Services Market Attractiveness Analysis
11. Europe Agrochemical Services Market Analysis and Forecast, 2020–2031
11.1. Key Findings
11.2. Europe Agrochemical Services Market Value (US$ Mn) Forecast, by Services, 2020–2031
11.3. Europe Agrochemical Services Market Value (US$ Mn) Forecast, by Crop Type, 2020–2031
11.4. Europe Agrochemical Services Market Value (US$ Mn) Forecast, by Application, 2020–2031
11.5. Europe Agrochemical Services Market Value (US$ Mn) Forecast, by Country and Sub-region, 2020-2031
11.5.1. Germany Agrochemical Services Market Value (US$ Mn) Forecast, by Services, 2020–2031
11.5.2. Germany Agrochemical Services Market Value (US$ Mn) Forecast, by Crop Type, 2020–2031
11.5.3. Germany Agrochemical Services Market Value (US$ Mn) Forecast, by Application, 2020–2031
11.5.4. France Agrochemical Services Market Value (US$ Mn) Forecast, by Services, 2020–2031
11.5.5. France Agrochemical Services Market Value (US$ Mn) Forecast, by Crop Type, 2020–2031
11.5.6. France Agrochemical Services Market Value (US$ Mn) Forecast, by Application, 2020–2031
11.5.7. U.K. Agrochemical Services Market Value (US$ Mn) Forecast, by Services, 2020–2031
11.5.8. U.K. Agrochemical Services Market Value (US$ Mn) Forecast, by Crop Type, 2020–2031
11.5.9. U.K. Agrochemical Services Market Value (US$ Mn) Forecast, by Application, 2020–2031
11.5.10. Italy Agrochemical Services Market Value (US$ Mn) Forecast, by Services, 2020–2031
11.5.11. Italy. Agrochemical Services Market Value (US$ Mn) Forecast, by Crop Type, 2020–2031
11.5.12. Italy Agrochemical Services Market Value (US$ Mn) Forecast, by Application, 2020–2031
11.5.13. Russia & CIS Agrochemical Services Market Value (US$ Mn) Forecast, by Services, 2020–2031
11.5.14. Russia & CIS Agrochemical Services Market Value (US$ Mn) Forecast, by Crop Type, 2020–2031
11.5.15. Russia & CIS Agrochemical Services Market Value (US$ Mn) Forecast, by Application, 2020–2031
11.5.16. Rest of Europe Agrochemical Services Market Value (US$ Mn) Forecast, by Services, 2020–2031
11.5.17. Rest of Europe Agrochemical Services Market Value (US$ Mn) Forecast, by Crop Type, 2020–2031
11.5.18. Rest of Europe Agrochemical Services Market Value (US$ Mn) Forecast, by Application, 2020–2031
11.6. Europe Agrochemical Services Market Attractiveness Analysis
12. Asia Pacific Agrochemical Services Market Analysis and Forecast, 2020–2031
12.1. Key Findings
12.2. Asia Pacific Agrochemical Services Market Value (US$ Mn) Forecast, by Services
12.3. Asia Pacific Agrochemical Services Market Value (US$ Mn) Forecast, by Crop Type, 2020–2031
12.4. Asia Pacific Agrochemical Services Market Value (US$ Mn) Forecast, by Application, 2020–2031
12.5. Asia Pacific Agrochemical Services Market Value (US$ Mn) Forecast, by Country and Sub-region, 2020-2031
12.5.1. China Agrochemical Services Market Value (US$ Mn) Forecast, by Services, 2020–2031
12.5.2. China Agrochemical Services Market Value (US$ Mn) Forecast, by Crop Type, 2020–2031
12.5.3. China Agrochemical Services Market Value (US$ Mn) Forecast, by Application, 2020–2031
12.5.4. Japan Agrochemical Services Market Value (US$ Mn) Forecast, by Services, 2020–2031
12.5.5. Japan Agrochemical Services Market Value (US$ Mn) Forecast, by Crop Type, 2020–2031
12.5.6. Japan Agrochemical Services Market Value (US$ Mn) Forecast, by Application, 2020–2031
12.5.7. India Agrochemical Services Market Value (US$ Mn) Forecast, by Services, 2020–2031
12.5.8. India Agrochemical Services Market Value (US$ Mn) Forecast, by Crop Type, 2020–2031
12.5.9. India Agrochemical Services Market Value (US$ Mn) Forecast, by Application, 2020–2031
12.5.10. ASEAN Agrochemical Services Market Value (US$ Mn) Forecast, by Services, 2020–2031
12.5.11. ASEAN Agrochemical Services Market Value (US$ Mn) Forecast, by Crop Type, 2020–2031
12.5.12. ASEAN Agrochemical Services Market Value (US$ Mn) Forecast, by Application, 2020–2031
12.5.13. Rest of Asia Pacific Agrochemical Services Market Value (US$ Mn) Forecast, by Services, 2020–2031
12.5.14. Rest of Asia Pacific Agrochemical Services Market Value (US$ Mn) Forecast, by Crop Type, 2020–2031
12.5.15. Rest of Asia Pacific Agrochemical Services Market Value (US$ Mn) Forecast, by Application, 2020–2031
12.6. Asia Pacific Agrochemical Services Market Attractiveness Analysis
13. Latin America Agrochemical Services Market Analysis and Forecast, 2020–2031
13.1. Key Findings
13.2. Latin America Agrochemical Services Market Value (US$ Mn) Forecast, by Services, 2020–2031
13.3. Latin America Agrochemical Services Market Value (US$ Mn) Forecast, by Crop Type, 2020–2031
13.4. Latin America Agrochemical Services Market Value (US$ Mn) Forecast, by Application, 2020–2031
13.5. Latin America Agrochemical Services Market Value (US$ Mn) Forecast, by Country and Sub-region, 2020-2031
13.5.1. Brazil Agrochemical Services Market Value (US$ Mn) Forecast, by Services, 2020–2031
13.5.2. Brazil Agrochemical Services Market Value (US$ Mn) Forecast, by Crop Type, 2020–2031
13.5.3. Brazil Agrochemical Services Market Value (US$ Mn) Forecast, by Application, 2020–2031
13.5.4. Mexico Agrochemical Services Market Value (US$ Mn) Forecast, by Services, 2020–2031
13.5.5. Mexico Agrochemical Services Market Value (US$ Mn) Forecast, by Crop Type, 2020–2031
13.5.6. Mexico Agrochemical Services Market Value (US$ Mn) Forecast, by Application, 2020–2031
13.5.7. Rest of Latin America Agrochemical Services Market Value (US$ Mn) Forecast, by Services, 2020–2031
13.5.8. Rest of Latin America Agrochemical Services Market Value (US$ Mn) Forecast, by Crop Type, 2020–2031
13.5.9. Rest of Latin America Agrochemical Services Market Value (US$ Mn) Forecast, by Application, 2020–2031
13.6. Latin America Agrochemical Services Market Attractiveness Analysis
14. Middle East & Africa Agrochemical Services Market Analysis and Forecast, 2020–2031
14.1. Key Findings
14.2. Middle East & Africa Agrochemical Services Market Value (US$ Mn) Forecast, by Services, 2020–2031
14.3. Middle East & Africa Agrochemical Services Market Value (US$ Mn) Forecast, by Crop Type, 2020–2031
14.4. Middle East & Africa Agrochemical Services Market Value (US$ Mn) Forecast, by Application, 2020–2031
14.5. Middle East & Africa Agrochemical Services Market Value (US$ Mn) Forecast, by Country and Sub-region, 2020-2031
14.5.1. GCC Agrochemical Services Market Value (US$ Mn) Forecast, by Services, 2020–2031
14.5.2. GCC Agrochemical Services Market Value (US$ Mn) Forecast, by Crop Type, 2020–2031
14.5.3. GCC Agrochemical Services Market Value (US$ Mn) Forecast, by Application, 2020–2031
14.5.4. South Africa Agrochemical Services Market Value (US$ Mn) Forecast, by Services, 2020–2031
14.5.5. South Africa Agrochemical Services Market Value (US$ Mn) Forecast, by Crop Type, 2020–2031
14.5.6. South Africa Agrochemical Services Market Value (US$ Mn) Forecast, by Application, 2020–2031
14.5.7. Rest of Middle East & Africa Agrochemical Services Market Value (US$ Mn) Forecast, by Services, 2020–2031
14.5.8. Rest of Middle East & Africa Agrochemical Services Market Value (US$ Mn) Forecast, by Crop Type, 2020–2031
14.5.9. Rest of Middle East & Africa Agrochemical Services Market Value (US$ Mn) Forecast, by Application, 2020–2031
14.6. Middle East & Africa Agrochemical Services Market Attractiveness Analysis
15. Competition Landscape
15.1. Global Agrochemical Service Company Market Share Analysis, 2020
15.2. Company Profiles (Details – Overview, Financials, Recent Developments, and Strategy)
15.2.1. Clariant
15.2.1.1. Company Description
15.2.1.2. Business Overview
15.2.1.3. Financial Overview
15.2.1.4. Strategic Overview
15.2.2. Creative Proteomics
15.2.2.1. Company Description
15.2.2.2. Business Overview
15.2.2.3. Financial Overview
15.2.2.4. Strategic Overview
15.2.3. ALLIANCE PHARMA
15.2.3.1. Company Description
15.2.3.2. Business Overview
15.2.3.3. Financial Overview
15.2.3.4. Strategic Overview
15.2.4. Frontage Labs
15.2.4.1. Company Description
15.2.4.2. Business Overview
15.2.4.3. Financial Overview
15.2.4.4. Strategic Overview
15.2.5. Intertek Group plc
15.2.5.1. Company Description
15.2.5.2. Business Overview
15.2.5.3. Financial Overview
15.2.5.4. Strategic Overview
15.2.6. PerkinElmer Inc
15.2.6.1. Company Description
15.2.6.2. Business Overview
15.2.6.3. Financial Overview
15.2.6.4. Strategic Overview
15.2.7. Bioneeds India Pvt. Ltd
15.2.7.1. Company Description
15.2.7.2. Business Overview
15.2.7.3. Financial Overview
15.2.7.4. Strategic Overview
15.2.8. Labcorp Drug Development
15.2.8.1. Company Description
15.2.8.2. Business Overview
15.2.8.3. Financial Overview
15.2.8.4. Strategic Overview
15.2.9. Baroda Agro Chemicals Ltd
15.2.9.1. Company Description
15.2.9.2. Business Overview
15.2.9.3. Financial Overview
15.2.9.4. Strategic Overview
15.2.10. JRF Global
15.2.10.1. Company Description
15.2.10.2. Business Overview
15.2.10.3. Financial Overview
15.2.10.4. Strategic Overview
15.2.11. PI Industries
15.2.11.1. Company Description
15.2.11.2. Business Overview
15.2.11.3. Financial Overview
15.2.11.4. Strategic Overview
16. Primary Research: Key Insights
17. Appendix
List of Tables
Table 1: Global Agrochemical Services Market Forecast, by Services, 2020–2031
Table 2: Global Agrochemical Services Market Value (US$ Mn) Forecast, by Services, 2020–2031
Table 3: Global Agrochemical Services Market Forecast, by Crop Type, 2020–2031
Table 4: Global Agrochemical Services Market Value (US$ Mn) Forecast, by Crop Type, 2020–2031
Table 5: Global Agrochemical Services Market Forecast, by Application, 2020–2031
Table 6: Global Agrochemical Services Market Value (US$ Mn) Forecast, by Application, 2020–2031
Table 7: Global Agrochemical Services Market Forecast, by Region, 2020–2031
Table 8: Global Agrochemical Services Market Value (US$ Mn) Forecast, by Region, 2020–2031
Table 9: North America Agrochemical Services Market Forecast, by Services, 2020–2031
Table 10: North America Agrochemical Services Market Value (US$ Mn) Forecast, by Services, 2020–2031
Table 11: North America Agrochemical Services Market Forecast, by Crop Type, 2020–2031
Table 12: North America Agrochemical Services Market Value (US$ Mn) Forecast, by Crop Type, 2020–2031
Table 13: North America Agrochemical Services Market Forecast, by Application, 2020–2031
Table 14: North America Agrochemical Services Market Value (US$ Mn) Forecast, by Application, 2020–2031
Table 15: North America Agrochemical Services Market Forecast, by Country, 2020–2031
Table 16: North America Agrochemical Services Market Value (US$ Mn) Forecast, by Country, 2020–2031
Table 17: U.S. Agrochemical Services Market Forecast, by Services, 2020–2031
Table 18: U.S. Agrochemical Services Market Value (US$ Mn) Forecast, by Services, 2020–2031
Table 19: U.S. Agrochemical Services Market Forecast, by Crop Type, 2020–2031
Table 20: U.S. Agrochemical Services Market Value (US$ Mn) Forecast, by Crop Type, 2020–2031
Table 21: U.S. Agrochemical Services Market Forecast, by Application, 2020–2031
Table 22: U.S. Agrochemical Services Market Value (US$ Mn) Forecast, by Application, 2020–2031
Table 23: Canada Agrochemical Services Market Forecast, by Services, 2020–2031
Table 24: Canada Agrochemical Services Market Value (US$ Mn) Forecast, by Services, 2020–2031
Table 25: Canada Agrochemical Services Market Forecast, by Crop Type, 2020–2031
Table 26: Canada Agrochemical Services Market Value (US$ Mn) Forecast, by Crop Type, 2020–2031
Table 27: Canada Agrochemical Services Market Forecast, by Application, 2020–2031
Table 28: Canada Agrochemical Services Market Value (US$ Mn) Forecast, by Application, 2020–2031
Table 29: Europe Agrochemical Services Market Forecast, by Services, 2020–2031
Table 30: Europe Agrochemical Services Market Value (US$ Mn) Forecast, by Services, 2020–2031
Table 31: Europe Agrochemical Services Market Forecast, by Crop Type, 2020–2031
Table 32: Europe Agrochemical Services Market Value (US$ Mn) Forecast, by Crop Type, 2020–2031
Table 33: Europe Agrochemical Services Market Forecast, by Application, 2020–2031
Table 34: Europe Agrochemical Services Market Value (US$ Mn) Forecast, by Application, 2020–2031
Table 35: Europe Agrochemical Services Market Forecast, by Country and Sub-region, 2020–2031
Table 36: Europe Agrochemical Services Market Value (US$ Mn) Forecast, by Country and Sub-region, 2020–2031
Table 37: Germany Agrochemical Services Market Forecast, by Services, 2020–2031
Table 38: Germany Agrochemical Services Market Value (US$ Mn) Forecast, by Services, 2020–2031
Table 39: Germany Agrochemical Services Market Forecast, by Crop Type, 2020–2031
Table 40: Germany Agrochemical Services Market Value (US$ Mn) Forecast, by Crop Type, 2020–2031
Table 41: Germany Agrochemical Services Market Forecast, by Application, 2020–2031
Table 42: Germany Agrochemical Services Market Value (US$ Mn) Forecast, by Application, 2020–2031
Table 43: France Agrochemical Services Market Forecast, by Services, 2020–2031
Table 44: France Agrochemical Services Market Value (US$ Mn) Forecast, by Services, 2020–2031
Table 45: France Agrochemical Services Market Forecast, by Crop Type, 2020–2031
Table 46: France Agrochemical Services Market Value (US$ Mn) Forecast, by Crop Type, 2020–2031
Table 47: France Agrochemical Services Market Forecast, by Application, 2020–2031
Table 48: France Agrochemical Services Market Value (US$ Mn) Forecast, by Application, 2020–2031
Table 49: U.K. Agrochemical Services Market Forecast, by Services, 2020–2031
Table 50: U.K. Agrochemical Services Market Value (US$ Mn) Forecast, by Services, 2020–2031
Table 51: U.K. Agrochemical Services Market Forecast, by Crop Type, 2020–2031
Table 52: U.K. Agrochemical Services Market Value (US$ Mn) Forecast, by Crop Type, 2020–2031
Table 53: U.K. Agrochemical Services Market Forecast, by Application, 2020–2031
Table 54: U.K. Agrochemical Services Market Value (US$ Mn) Forecast, by Application, 2020–2031
Table 55: Italy Agrochemical Services Market Forecast, by Services, 2020–2031
Table 56: Italy Agrochemical Services Market Value (US$ Mn) Forecast, by Services, 2020–2031
Table 57: Italy Agrochemical Services Market Forecast, by Crop Type, 2020–2031
Table 58: Italy Agrochemical Services Market Value (US$ Mn) Forecast, by Crop Type, 2020–2031
Table 59: Italy Agrochemical Services Market Forecast, by Application, 2020–2031
Table 60: Italy Agrochemical Services Market Value (US$ Mn) Forecast, by Application, 2020–2031
Table 61: Spain Agrochemical Services Market Forecast, by Services, 2020–2031
Table 62: Spain Agrochemical Services Market Value (US$ Mn) Forecast, by Services, 2020–2031
Table 63: Spain Agrochemical Services Market Forecast, by Crop Type, 2020–2031
Table 64: Spain Agrochemical Services Market Value (US$ Mn) Forecast, by Crop Type, 2020–2031
Table 65: Spain Agrochemical Services Market Forecast, by Application, 2020–2031
Table 66: Spain Agrochemical Services Market Value (US$ Mn) Forecast, by Application, 2020–2031
Table 67: Russia & CIS Agrochemical Services Market Forecast, by Services, 2020–2031
Table 68: Russia & CIS Agrochemical Services Market Value (US$ Mn) Forecast, by Services, 2020–2031
Table 69: Russia & CIS Agrochemical Services Market Forecast, by Crop Type, 2020–2031
Table 70: Russia & CIS Agrochemical Services Market Value (US$ Mn) Forecast, by Crop Type, 2020–2031
Table 71: Russia & CIS Agrochemical Services Market Forecast, by Application, 2020–2031
Table 72: Russia & CIS Agrochemical Services Market Value (US$ Mn) Forecast, by Application, 2020–2031
Table 73: Rest of Europe Agrochemical Services Market Forecast, by Services, 2020–2031
Table 74: Rest of Europe Agrochemical Services Market Value (US$ Mn) Forecast, by Services, 2020–2031
Table 75: Rest of Europe Agrochemical Services Market Forecast, by Crop Type, 2020–2031
Table 76: Rest of Europe Agrochemical Services Market Value (US$ Mn) Forecast, by Crop Type, 2020–2031
Table 77: Rest of Europe Agrochemical Services Market Forecast, by Application, 2020–2031
Table 78: Rest of Europe Agrochemical Services Market Value (US$ Mn) Forecast, by Application, 2020–2031
Table 79: Asia Pacific Agrochemical Services Market Forecast, by Services, 2020–2031
Table 80: Asia Pacific Agrochemical Services Market Value (US$ Mn) Forecast, by Services, 2020–2031
Table 81: Asia Pacific Agrochemical Services Market Forecast, by Crop Type, 2020–2031
Table 82: Asia Pacific Agrochemical Services Market Value (US$ Mn) Forecast, by Crop Type, 2020–2031
Table 83: Asia Pacific Agrochemical Services Market Forecast, by Application, 2020–2031
Table 84: Asia Pacific Agrochemical Services Market Value (US$ Mn) Forecast, by Application, 2020–2031
Table 85: Asia Pacific Agrochemical Services Market Forecast, by Country and Sub-region, 2020–2031
Table 86: Asia Pacific Agrochemical Services Market Value (US$ Mn) Forecast, by Country and Sub-region, 2020–2031
Table 87: China Agrochemical Services Market Forecast, by Services, 2020–2031
Table 88: China Agrochemical Services Market Value (US$ Mn) Forecast, by Services 2020–2031
Table 89: China Agrochemical Services Market Forecast, by Crop Type, 2020–2031
Table 90: China Agrochemical Services Market Value (US$ Mn) Forecast, by Crop Type, 2020–2031
Table 91: China Agrochemical Services Market Forecast, by Application, 2020–2031
Table 92: China Agrochemical Services Market Value (US$ Mn) Forecast, by Application, 2020–2031
Table 93: Japan Agrochemical Services Market Forecast, by Services, 2020–2031
Table 94: Japan Agrochemical Services Market Value (US$ Mn) Forecast, by Services, 2020–2031
Table 95: Japan Agrochemical Services Market Forecast, by Crop Type, 2020–2031
Table 96: Japan Agrochemical Services Market Value (US$ Mn) Forecast, by Crop Type, 2020–2031
Table 97: Japan Agrochemical Services Market Forecast, by Application, 2020–2031
Table 98: Japan Agrochemical Services Market Value (US$ Mn) Forecast, by Application, 2020–2031
Table 99: India Agrochemical Services Market Forecast, by Services, 2020–2031
Table 100: India Agrochemical Services Market Value (US$ Mn) Forecast, by Services, 2020–2031
Table 101: India Agrochemical Services Market Forecast, by Crop Type, 2020–2031
Table 102: India Agrochemical Services Market Value (US$ Mn) Forecast, by Crop Type, 2020–2031
Table 103: India Agrochemical Services Market Forecast, by Application, 2020–2031
Table 104: India Agrochemical Services Market Value (US$ Mn) Forecast, by Application, 2020–2031
Table 105: India Agrochemical Services Market Forecast, by Application, 2020–2031
Table 106: India Agrochemical Services Market Value (US$ Mn) Forecast, by Application 2020–2031
Table 107: ASEAN Agrochemical Services Market Forecast, by Services, 2020–2031
Table 108: ASEAN Agrochemical Services Market Value (US$ Mn) Forecast, by Services, 2020–2031
Table 109: ASEAN Agrochemical Services Market Forecast, by Crop Type, 2020–2031
Table 110: ASEAN Agrochemical Services Market Value (US$ Mn) Forecast, by Crop Type, 2020–2031
Table 111: ASEAN Agrochemical Services Market Forecast, by Application, 2020–2031
Table 112: ASEAN Agrochemical Services Market Value (US$ Mn) Forecast, by Application, 2020–2031
Table 113: Rest of Asia Pacific Agrochemical Services Market Forecast, by Services, 2020–2031
Table 114: Rest of Asia Pacific Agrochemical Services Market Value (US$ Mn) Forecast, by Services, 2020–2031
Table 115: Rest of Asia Pacific Agrochemical Services Market Forecast, by Crop Type, 2020–2031
Table 116: Rest of Asia Pacific Agrochemical Services Market Value (US$ Mn) Forecast, by Crop Type, 2020–2031
Table 117: Rest of Asia Pacific Agrochemical Services Market Forecast, by Application, 2020–2031
Table 118: Rest of Asia Pacific Agrochemical Services Market Value (US$ Mn) Forecast, by Application, 2020–2031
Table 119: Latin America Agrochemical Services Market Forecast, by Services, 2020–2031
Table 120: Latin America Agrochemical Services Market Value (US$ Mn) Forecast, by Services, 2020–2031
Table 121: Latin America Agrochemical Services Market Forecast, by Crop Type, 2020–2031
Table 122: Latin America Agrochemical Services Market Value (US$ Mn) Forecast, by Crop Type, 2020–2031
Table 123: Latin America Agrochemical Services Market Forecast, by Application, 2020–2031
Table 124: Latin America Agrochemical Services Market Value (US$ Mn) Forecast, by Application, 2020–2031
Table 125: Latin America Agrochemical Services Market Forecast, by Country and Sub-region, 2020–2031
Table 126: Latin America Agrochemical Services Market Value (US$ Mn) Forecast, by Country and Sub-region, 2020–2031
Table 127: Brazil Agrochemical Services Market Forecast, by Services, 2020–2031
Table 128: Brazil Agrochemical Services Market Value (US$ Mn) Forecast, by Services, 2020–2031
Table 129: Brazil Agrochemical Services Market Forecast, by Crop Type, 2020–2031
Table 130: Brazil Agrochemical Services Market Value (US$ Mn) Forecast, by Crop Type, 2020–2031
Table 131: Brazil Agrochemical Services Market Forecast, by Application, 2020–2031
Table 132: Brazil Agrochemical Services Market Value (US$ Mn) Forecast, by Application, 2020–2031
Table 133: Mexico Agrochemical Services Market Forecast, by Services, 2020–2031
Table 134: Mexico Agrochemical Services Market Value (US$ Mn) Forecast, by Services, 2020–2031
Table 135: Mexico Agrochemical Services Market Forecast, by Crop Type, 2020–2031
Table 136: Mexico Agrochemical Services Market Value (US$ Mn) Forecast, by Crop Type, 2020–2031
Table 137: Mexico Agrochemical Services Market Forecast, by Application, 2020–2031
Table 138: Mexico Agrochemical Services Market Value (US$ Mn) Forecast, by Application, 2020–2031
Table 139: Rest of Latin America Agrochemical Services Market Forecast, by Services, 2020–2031
Table 140: Rest of Latin America Agrochemical Services Market Value (US$ Mn) Forecast, by Services, 2020–2031
Table 141: Rest of Latin America Agrochemical Services Market Forecast, by Crop Type, 2020–2031
Table 142: Rest of Latin America Agrochemical Services Market Value (US$ Mn) Forecast, by Crop Type, 2020–2031
Table 143: Rest of Latin America Agrochemical Services Market Forecast, by Application, 2020–2031
Table 144: Rest of Latin America Agrochemical Services Market Value (US$ Mn) Forecast, by Application, 2020–2031
Table 145: Middle East & Africa Agrochemical Services Market Forecast, by Services, 2020–2031
Table 146: Middle East & Africa Agrochemical Services Market Value (US$ Mn) Forecast, by Services, 2020–2031
Table 147: Middle East & Africa Agrochemical Services Market Forecast, by Crop Type, 2020–2031
Table 148: Middle East & Africa Agrochemical Services Market Value (US$ Mn) Forecast, by Crop Type, 2020–2031
Table 149: Middle East & Africa Agrochemical Services Market Forecast, by Application, 2020–2031
Table 150: Middle East & Africa Agrochemical Services Market Value (US$ Mn) Forecast, by Application, 2020–2031
Table 151: Middle East & Africa Agrochemical Services Market Forecast, by Country and Sub-region, 2020–2031
Table 152: Middle East & Africa Agrochemical Services Market Value (US$ Mn) Forecast, by Country and Sub-region, 2020–2031
Table 153: GCC Agrochemical Services Market Forecast, by Services, 2020–2031
Table 154: GCC Agrochemical Services Market Value (US$ Mn) Forecast, by Services, 2020–2031
Table 155: GCC Agrochemical Services Market Forecast, by Crop Type, 2020–2031
Table 156: GCC Agrochemical Services Market Value (US$ Mn) Forecast, by Crop Type, 2020–2031
Table 157: GCC Agrochemical Services Market Forecast, by Application, 2020–2031
Table 158: GCC Agrochemical Services Market Value (US$ Mn) Forecast, by Application, 2020–2031
Table 159: South Africa Agrochemical Services Market Forecast, by Services, 2020–2031
Table 160: South Africa Agrochemical Services Market Value (US$ Mn) Forecast, by Services, 2020–2031
Table 161: South Africa Agrochemical Services Market Forecast, by Crop Type, 2020–2031
Table 162: South Africa Agrochemical Services Market Value (US$ Mn) Forecast, by Crop Type, 2020–2031
Table 163: South Africa Agrochemical Services Market Forecast, by Application, 2020–2031
Table 164: South Africa Agrochemical Services Market Value (US$ Mn) Forecast, by Application, 2020–2031
Table 165: Rest of Middle East & Africa Agrochemical Services Market Forecast, by Services, 2020–2031
Table 166: Rest of Middle East & Africa Agrochemical Services Market Value (US$ Mn) Forecast, by Services, 2020–2031
Table 167: Rest of Middle East & Africa Agrochemical Services Market Forecast, by Crop Type, 2020–2031
Table 168: Rest of Middle East & Africa Agrochemical Services Market Value (US$ Mn) Forecast, by Crop Type, 2020–2031
Table 169: Rest of Middle East & Africa Agrochemical Services Market Forecast, by Application, 2020–2031
Table 170: Rest of Middle East & Africa Agrochemical Services Market Value (US$ Mn) Forecast, by Application, 2020–2031
List of Figures
Figure 1: Global Agrochemical Services Market Volume Share Analysis, by Services, 2020, 2025, and 2031
Figure 2: Global Agrochemical Services Market Attractiveness, by Services
Figure 3: Global Agrochemical Services Market Volume Share Analysis, by Crop Type, 2020, 2025, and 2031
Figure 4: Global Agrochemical Services Market Attractiveness, by Crop Type
Figure 5: Global Agrochemical Services Market Volume Share Analysis, by Application, 2020, 2025, and 2031
Figure 6: Global Agrochemical Services Market Attractiveness, by Application
Figure 7: Global Agrochemical Services Market Volume Share Analysis, by Region, 2020, 2025, and 2031
Figure 8: Global Agrochemical Services Market Attractiveness, by Region
Figure 9: North America Agrochemical Services Market Volume Share Analysis, by Services, 2020, 2025, and 2031
Figure 10: North America Agrochemical Services Market Attractiveness, by Services
Figure 11: North America Agrochemical Services Market Attractiveness, by Services
Figure 12: North America Agrochemical Services Market Volume Share Analysis, by Crop Type, 2020, 2025, and 2031
Figure 13: North America Agrochemical Services Market Attractiveness, by Crop Type
Figure 14: North America Agrochemical Services Market Volume Share Analysis, by Application, 2020, 2025, and 2031
Figure 15: North America Agrochemical Services Market Attractiveness, by Application
Figure 16: North America Agrochemical Services Market Attractiveness, by Country
Figure 17: Europe Agrochemical Services Market Volume Share Analysis, by Services, 2020, 2025, and 2031
Figure 18: Europe Agrochemical Services Market Attractiveness, by Services
Figure 19: Europe Agrochemical Services Market Volume Share Analysis, by Crop Type, 2020, 2025, and 2031
Figure 20: Europe Agrochemical Services Market Attractiveness, by Crop Type
Figure 21: Europe Agrochemical Services Market Volume Share Analysis, by Application, 2020, 2025, and 2031
Figure 22: Europe Agrochemical Services Market Attractiveness, by Application
Figure 23: Europe Agrochemical Services Market Volume Share Analysis, by Country and Sub-region, 2020, 2025, and 2031
Figure 24: Europe Agrochemical Services Market Attractiveness, by Country and Sub-region
Figure 25: Asia Pacific Agrochemical Services Market Volume Share Analysis, by Services, 2020, 2025, and 2031
Figure 26: Asia Pacific Agrochemical Services Market Attractiveness, by Services
Figure 27: Asia Pacific Agrochemical Services Market Volume Share Analysis, by Crop Type, 2020, 2025, and 2031
Figure 28: Asia Pacific Agrochemical Services Market Attractiveness, by Crop Type
Figure 29: Asia Pacific Agrochemical Services Market Volume Share Analysis, by Application, 2020, 2025, and 2031
Figure 30: Asia Pacific Agrochemical Services Market Attractiveness, by Application
Figure 31: Asia Pacific Agrochemical Services Market Volume Share Analysis, by Country and Sub-region, 2020, 2025, and 2031
Figure 32: Asia Pacific Agrochemical Services Market Attractiveness, by Country and Sub-region
Figure 33: Latin America Agrochemical Services Market Volume Share Analysis, by Services, 2020, 2025, and 2031
Figure 34: Latin America Agrochemical Services Market Attractiveness, by Services
Figure 35: Latin America Agrochemical Services Market Volume Share Analysis, by Crop Type, 2020, 2025, and 2031
Figure 36: Latin America Agrochemical Services Market Attractiveness, by Crop Type
Figure 37: Latin America Agrochemical Services Market Volume Share Analysis, by Application, 2020, 2025, and 2031
Figure 38: Latin America Agrochemical Services Market Attractiveness, by Application
Figure 39: Latin America Agrochemical Services Market Volume Share Analysis, by Country and Sub-region, 2020, 2025, and 2031
Figure 40: Latin America Agrochemical Services Market Attractiveness, by Country and Sub-region
Figure 41: Middle East & Africa Agrochemical Services Market Volume Share Analysis, by Services, 2020, 2025, and 2031
Figure 42: Middle East & Africa Agrochemical Services Market Attractiveness, by Services
Figure 43: Middle East & Africa Agrochemical Services Market Volume Share Analysis, by Crop Type, 2020, 2025, and 2031
Figure 44: Middle East & Africa Agrochemical Services Market Attractiveness, by Crop Type
Figure 45: Middle East & Africa Agrochemical Services Market Volume Share Analysis, by Application, 2020, 2025, and 2031
Figure 46: Middle East & Africa Agrochemical Services Market Attractiveness, by Application
Figure 47: Middle East & Africa Agrochemical Services Market Volume Share Analysis, by Country and Sub-region, 2020, 2025, and 2031
Figure 48: Middle East & Africa Agrochemical Services Market Attractiveness, by Country and Sub-region
Copyright © Transparency Market Research, Inc. All Rights reserved
Trust Online


Agrochemicals Services Market