
Analysts’ Viewpoint on Spring Water Market Scenario
Consumers across the globe have been increasingly becoming health conscious since the outbreak of the coronavirus pandemic. Bottled water sales are expected to be high in the near future, with consumers choosing glass bottles over plastic owing to their purported antiviral properties. Rise in sale of spring water across different distribution channels, increase in launch of products containing spring water, and surge in demand for natural spring water are anticipated to augment the global spring water market during the forecast period.
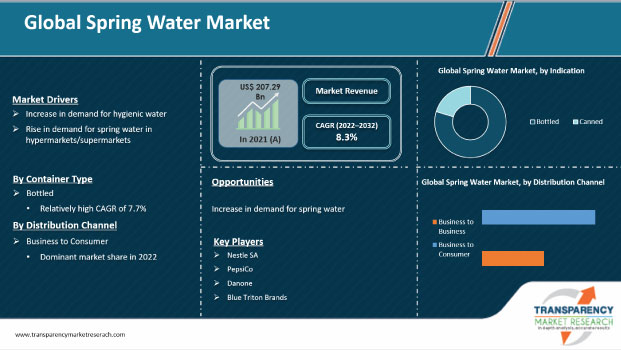
Spring water comes from an underground aquifer. It comes from a subterranean source from which water naturally rises to the surface. Spring water varies in terms of mineral content and Total Dissolved Solids (TDS) levels; both of these are impacted by the location. Demand for nutrient-fortified water has been increasing among working professionals, travelers, and in-house consumers. Products labeled alkaline, electrolyte-rich, and fortified with added hydrogen or oxygen have been gaining popularity of late. According to the Natural Resources Defense Council (NRDC), the FDA regulates bottled water insufficiently, allowing producers to brand their product "spring water" even if it does not originate from a natural spring. Carbonated or sparkling spring water can be a good alternative for sugary drinks. The market for spring water is estimated to witness a healthy growth rate during the forecast period, owing to the increase in awareness about the benefits of spring water for skin. Rise in demand for flow spring water and spring mountain water is creating lucrative opportunities for players operating in the global spring water market.
Request a sample to get extensive insights into the Spring Water Market
The global canned spring water market is anticipated to grow at the fastest rate, with a valuation of US$ 46,002.2 Mn by the end of 2022. Concerns regarding numerous health issues caused by contaminated water, such as neurological disorders, reproductive issues, and gastrointestinal diseases, have boosted the global demand for hygienic and clean bottled or canned spring water. Bottled water manufacturers claim that seals of their bottles protect water from bacterial contamination regardless of storage time. Healthy mineral water is becoming more popular across the globe. As a result, bottled water makers are increasingly focusing on developing improved and new water products, while ensuring that all essential attributes of naturalness and hydration of traditional plain water are retained. This has resulted in several product launches and developments in the bottled water market; many of these are focused on various health benefits.
Increase in health awareness among the people has led a shift in demand for safer, more convenient, nutritious, and refreshing beverages that are caffeine-free, calorie-free, or free of other artificial components. This is propelling the global spring water market. Continuous urbanization, increase in spending power, and growth in preference for healthy water products are driving the food and beverage industry. In turn, this is boosting the demand for spring water. Spring water is free of toxins commonly found in drinking water, as it comes from a pure subsurface water source. Furthermore, pure spring water is high in minerals, which are incredibly good for the body. Spring water has a neutral or slightly alkaline pH, which aids in neutralizing acidity in the body and reducing free radical damage.
In terms of container type, the global spring water market has been segregated into bottled and canned. The bottled segment held major share of 79.6% of the global market in 2022. Distribution of bottled spring water has expanded to meet the rising demand. It is now available at nearly every retail shop. Demand for bottled water is also driven by innovation in terms of portability of bottled water packaging. Led by increasingly busy lifestyles, consumers are willing to pay extra for a product that meets their drinking needs. Rise in bottled water purchases among the working population is projected to drive the spring water market.
Based on distribution channel, the global spring water market has been classified into business to business (food service) and business to consumer. The business to consumer segment has been further segregated into hypermarket/supermarkets, departmental stores, convenience stores, and online retail. The hypermarkets/supermarkets sub-segment held major value share of 44.0% in 2022. It is anticipated to maintain a steady growth rate of 7.7% during the forecast period. Supermarket and hypermarket conglomerates such as SPAR, Walmart, 7Eleven, Target, and Aldi have vast grocery store chains with a large customer base around the world. This is projected to drive the sales of spring water in hypermarkets and supermarkets in the next few years. Increase in penetration of smartphones has created new opportunities for the e-commerce platform in the global market. Furthermore, doorstep delivery, discounts, easy accessibility, and quality assurance by companies are boosting the sales of spring water through the online retail sales channel.
Europe held the largest value share of 29.1% of the global spring water market in 2022. High share of the region can be primarily ascribed to the large demand for natural spring water in France and Germany, which contributed 22.7% and 13.1% volume share, respectively, of the market in Europe in 2022. France accounts for almost one-third of the overall spring water market in Europe. North America is also a key region of the global spring water market. Convenience stores and online retail are the fastest growing end-use industries of spring water in Europe and North America. Latin America is a larger market for spring water compared to Middle East & Africa; however, the market in Middle East & Africa is likely to grow at a faster pace compared to that in Latin America.
The global spring water market is consolidated, with a small number of large-scale vendors controlling the majority of the share. Most of the firms are investing significantly in comprehensive research and development activities. Expansion of product portfolios and mergers and acquisitions are the key strategies adopted by the leading players. Orient Beverages Pvt. Ltd. (Bisleri International Pvt. Ltd.), CG Roxane, LLC, Bluetriton Brands, Pepsico, Berrington Water, Ten Spring Water, Coca-Cola (Valpre), Danone (Evian), Himalayas ONTOP, 3 Spring Water, Magnetic Spring, Mountain Valley Spring Water (Primo Water Corp.), Premium Waters, Inc., Nestle S.A., and Tata Consumer Products Limited (Himalayan) are the prominent entities operating in this market.
Request a custom report on Spring Water Market
Each of the players has been profiled in the spring water market report based on parameters such as company overview, financial overview, business strategies, product portfolio, business segments, and recent developments.
|
Attribute |
Detail |
|
Market Size Value in 2022 |
US$ 224.96 Bn |
|
Market Forecast Value in 2032 |
US$ 497.37 Bn |
|
Growth Rate (CAGR) |
8.3% |
|
Forecast Period |
2022–2032 |
|
Historical Data Available for |
2017–2020 |
|
Quantitative Units |
US$ Mn for Value & Metric Tons for Volume |
|
Market Analysis |
It includes cross-segment analysis at the global as well as regional levels. Furthermore, the qualitative analysis includes drivers, restraints, opportunities, key trends, Porter’s Five Forces analysis, value chain analysis, and key trend analysis. |
|
Competition Landscape |
|
|
Format |
Electronic (PDF) + Excel |
|
Market Segmentation |
|
|
Regions Covered |
|
|
Countries Covered |
|
|
Companies Profiled |
|
|
Customization Scope |
Available upon request |
|
Pricing |
Available upon request |
The spring water market is expected to reach US$ 497.37 Bn by 2032
The spring water market is estimated to grow at a CAGR of 8.3% during the forecast period
Increase in demand for hygienic spring bottled water among consumers and growth in geriatric population are some of the vital factors propelling the market
The bottled type segment contributes the largest share of the spring water market
Europe and North America are more attractive regions for vendors in the spring water market
Key players in the spring water market include Orient Beverages Pvt. Ltd. (Bisleri International Pvt. Ltd. ), CG Roxane, LLC, Bluetriton Brands, PepsiCo, Berrington Water, Ten Spring Water, Coca-Cola (Valpre), Danone (Evian), Himalayas ONTOP, 3 Spring Water, Magnetic Spring, Mountain Valley Spring Water (Primo Water Corp.), Premium Waters, Inc., Nestle S.A., and Tata Consumer Products Limited (Himalayan)
1. Executive Summary
1.1. Global Market Outlook
1.2. Demand Side Trends
1.3. Supply Side Trends
1.4. Analysis and Recommendations
2. Market Overview
2.1. Market Coverage / Taxonomy
2.2. Market Definition / Scope / Limitations
3. Key Market Trends
3.1. Key Trends Impacting the Market
3.1.1. Growing demand for healthy water due to its health benefits
3.1.2. Increasing demand for spring water among consumers
3.2. Product Innovation / Development Trends
4. Key Success Factors
4.1. Product Adoption / Usage Analysis
4.2. Product USPs / Features
5. Global Spring Water Market Demand Analysis 2017–2021 and Forecast, 2022–2032
5.1. Historical Market Volume (MT) Analysis, 2017–2021
5.2. Current and Future Market Volume (MT) Projections, 2022–2032
6. Global Spring Water Market - Pricing Analysis
6.1. Regional Pricing Analysis
6.2. Global Average Pricing Analysis Benchmark
7. Global Spring Water Market Demand (in Value or Size in US$ Mn) Analysis 2017–2021 and Forecast, 2022–2032
7.1. Historical Market Value (US$ Mn) Analysis, 2017–2021
7.2. Current and Future Market Value (US$ Mn) Projections, 2022–2032
7.2.1. Y-o-Y Growth Trend Analysis
7.2.2. Absolute $ Opportunity Analysis
8. Market Background
8.1. Macro-Economic Factors
8.1.1. Global GDP Growth Outlook
8.1.2. Global Industry Value Added
8.1.3. Global Urbanization Growth Outlook
8.1.4. Global Food Security Index Outlook
8.1.5. Global Rank – Ease of Doing Business
8.1.6. Global Rank – Trading Across Borders
8.2. COVID-19 Risk Assessment/Impact
8.3. Impact of COVID-19 on Food & Beverage Industry
8.4. Number of Water Purification Plants Across Key Countries
8.5. Bottled Water: Product Oriented Market Buzz
8.6. Industry Value and Supply Chain Analysis
8.6.1. Profit Margin Analysis at each point of sales
8.6.1.1. Spring Water Processors
8.6.1.2. Distributors/Suppliers/Wholesalers
8.6.1.3. Traders/Retailers
8.6.1.4. End-Users
8.7. Market Dynamics
8.7.1. Drivers
8.7.2. Restraints
8.7.3. Opportunity Analysis
8.8. Key Regulations
8.9. Key certifications/Claims
8.10. Forecast Factors - Relevance & Impact
9. Global Spring Water Market Analysis 2017–2021 and Forecast 2022–2032, By Container Type
9.1. Introduction / Key Findings
9.2. Historical Market Size (US$ Mn) and Volume Analysis By Container Type, 2017–2021
9.3. Current and Future Market Size (US$ Mn) and Volume Analysis and Forecast By Container Type, 2022–2032
9.3.1. Bottled
9.3.2. Canned
9.4. Market Attractiveness Analysis By Container Type
10. Global Spring Water Market Analysis 2017–2021 and Forecast 2022–2032, By Distribution Channel
10.1. Introduction / Key Findings
10.2. Historical Market Size (US$ Mn) and Volume Analysis By Distribution Channel, 2017–2021
10.3. Current and Future Market Size (US$ Mn) and Volume Analysis and Forecast By Distribution Channel, 2022–2032
10.3.1. Business To Business
10.3.2. Business To Consumer
10.3.2.1. Hypermarket/Supermarket
10.3.2.2. Specialty Stores
10.3.2.3. Departmental Stores
10.3.2.4. Online Retail
10.4. Market Attractiveness Analysis By Distribution Channel
11. Global Spring Water Market Analysis 2017–2021 and Forecast 2022–2032, By Region
11.1. Introduction
11.2. Historical Market Size (US$ Mn) and Volume Analysis By Region, 2017–2021
11.3. Current Market Size (US$ Mn) and Volume Analysis and Forecast By Region, 2022–2032
11.3.1. North America
11.3.2. Latin America
11.3.3. Europe
11.3.4. East Asia
11.3.5. South Asia
11.3.6. Oceania
11.3.7. Middle East and Africa (MEA)
11.4. Market Attractiveness Analysis By Region
12. North America Spring Water Market Analysis 2017–2021 and Forecast 2022–2032
12.1. Introduction
12.2. Historical Market Size (US$ Mn) and Volume Trend Analysis By Market Taxonomy, 2017–2021
12.3. Market Size (US$ Mn) and Volume Forecast By Market Taxonomy, 2022–2032
12.3.1. By Country
12.3.1.1. U.S.
12.3.1.2. Canada
12.3.2. By Country
12.3.3. By Container Type
12.3.4. By Distribution Channel
12.4. Market Attractiveness Analysis
12.4.1. By Country
12.4.2. By Container Type
12.4.3. By Distribution Channel
12.5. Drivers and Restraints - Impact Analysis
13. Latin America Spring Water Market Analysis 2017–2021 and Forecast 2022–2032
13.1. Introduction
13.2. Historical Market Size (US$ Mn) and Volume Trend Analysis By Market Taxonomy, 2017–2021
13.3. Market Size (US$ Mn) and Volume Forecast By Market Taxonomy, 2022–2032
13.3.1. By Country
13.3.1.1. Brazil
13.3.1.2. Mexico
13.3.1.3. Rest of Latin America
13.3.2. By Container Type
13.3.3. By Distribution Channel
13.4. Market Attractiveness Analysis
13.4.1. By Country
13.4.2. By Container Type
13.4.3. By Distribution Channel
13.5. Drivers and Restraints - Impact Analysis
14. Europe Spring Water Market Analysis 2017–2021 and Forecast 2022–2032
14.1. Introduction
14.2. Historical Market Size (US$ Mn) and Volume Trend Analysis By Market Taxonomy, 2017–2021
14.3. Market Size (US$ Mn) and Volume Forecast By Market Taxonomy, 2022–2032
14.3.1. By Country
14.3.1.1. Germany
14.3.1.2. U.K.
14.3.1.3. France
14.3.1.4. Italy
14.3.1.5. Spain
14.3.1.6. BENELUX
14.3.1.7. Nordic
14.3.1.8. Russia
14.3.1.9. Poland
14.3.1.10. Rest of Europe
14.3.2. By Container Type
14.3.3. By Distribution Channel
14.4. Market Attractiveness Analysis
14.4.1. By Country
14.4.2. By Container Type
14.4.3. By Distribution Channel
14.5. Drivers and Restraints - Impact Analysis
15. South Asia Spring Water Market Analysis 2017–2021 and Forecast 2022–2032
15.1. Introduction
15.2. Historical Market Size (US$ Mn) and Volume Trend Analysis By Market Taxonomy, 2017–2021
15.3. Market Size (US$ Mn) and Volume Forecast By Market Taxonomy, 2022–2032
15.3.1. By Country
15.3.1.1. India
15.3.1.2. Thailand
15.3.1.3. Indonesia
15.3.1.4. Malaysia
15.3.1.5. Rest of South Asia
15.3.2. By Container Type
15.3.3. By Distribution Channel
15.4. Market Attractiveness Analysis
15.4.1. By Country
15.4.2. By Container Type
15.4.3. By Distribution Channel
15.5. Drivers and Restraints - Impact Analysis
16. East Asia Spring Water Market Analysis 2017–2021 and Forecast 2022–2032
16.1. Introduction
16.2. Historical Market Size (US$ Mn) and Volume Trend Analysis By Market Taxonomy, 2017–2021
16.3. Market Size (US$ Mn) and Volume Forecast By Market Taxonomy, 2022–2032
16.3.1. By Country
16.3.1.1. China
16.3.1.2. Japan
16.3.1.3. South Korea
16.3.2. By Container Type
16.3.3. By Distribution Channel
16.4. Market Attractiveness Analysis
16.4.1. By Container Type
16.4.2. By Distribution Channel
16.5. Drivers and Restraints - Impact Analysis
17. Oceania Spring Water Market Analysis 2017–2021 and Forecast 2022–2032
17.1. Introduction
17.2. Historical Market Size (US$ Mn) and Volume Trend Analysis By Market Taxonomy, 2017–2021
17.3. Market Size (US$ Mn) and Volume Forecast By Market Taxonomy, 2022–2032
17.3.1. By Country
17.3.1.1. Australia
17.3.1.2. New Zealand
17.3.2. By Container Type
17.3.3. By Distribution Channel
17.4. Market Attractiveness Analysis
17.4.1. By Country
17.4.2. By Container Type
17.4.3. By Distribution Channel
17.5. Drivers and Restraints - Impact Analysis
18. Middle East and Africa Spring Water Market Analysis 2017–2021 and Forecast 2022–2032
18.1. Introduction
18.2. Historical Market Size (US$ Mn) and Volume Trend Analysis By Market Taxonomy, 2017–2021
18.3. Market Size (US$ Mn) and Volume Forecast By Market Taxonomy, 2022–2032
18.3.1. By Country
18.3.1.1. GCC Countries
18.3.1.2. Turkey
18.3.1.3. South Africa
18.3.1.4. Rest of Middle East and Africa
18.3.2. By Container Type
18.3.3. By Distribution Channel
18.4. Market Attractiveness Analysis
18.4.1. By Country
18.4.2. By Container Type
18.4.3. By Distribution Channel
18.5. Drivers and Restraints - Impact Analysis
19. Market Structure Analysis
19.1. Market Analysis By Tier of Companies
19.2. Market Concentration
19.3. Market Presence Analysis
20. Competition Analysis
20.1. Competition Dashboard
20.2. Competition Benchmarking
20.3. Competition Deep Dive
20.3.1. Orient Beverages Pvt. Ltd. (Bisleri International Pvt. Ltd.)
20.3.1.1. Overview
20.3.1.2. Product Portfolio
20.3.1.3. Sales Footprint
20.3.1.4. Key Developments/Key Takeaways
20.3.1.5. Strategy Overview
20.3.2. Danone (Evian)
20.3.2.1. Overview
20.3.2.2. Product Portfolio
20.3.2.3. Sales Footprint
20.3.2.4. Key Developments/Key Takeaways
20.3.2.5. Strategy Overview
20.3.3. CG Roxane, LLC
20.3.3.1. Overview
20.3.3.2. Product Portfolio
20.3.3.3. Sales Footprint
20.3.3.4. Key Developments/Key Takeaways
20.3.3.5. Strategy Overview
20.3.4. Nestle S.A.
20.3.4.1. Overview
20.3.4.2. Product Portfolio
20.3.4.3. Sales Footprint
20.3.4.4. Key Developments/Key Takeaways
20.3.4.5. Strategy Overview
20.3.5. Bluetriton Brands
20.3.5.1. Overview
20.3.5.2. Product Portfolio
20.3.5.3. Sales Footprint
20.3.5.4. Key Developments/Key Takeaways
20.3.5.5. Strategy Overview
20.3.6. Berrington Water
20.3.6.1. Overview
20.3.6.2. Product Portfolio
20.3.6.3. Sales Footprint
20.3.6.4. Key Developments/Key Takeaways
20.3.6.5. Strategy Overview
20.3.7. Ten Spring Water
20.3.7.1. Overview
20.3.7.2. Product Portfolio
20.3.7.3. Sales Footprint
20.3.7.4. Key Developments/Key Takeaways
20.3.7.5. Strategy Overview
20.3.8. Coca Cola (Valpre)
20.3.8.1. Overview
20.3.8.2. Product Portfolio
20.3.8.3. Sales Footprint
20.3.8.4. Key Developments/Key Takeaways
20.3.8.5. Strategy Overview
20.3.9. Danone (Evian)
20.3.9.1. Overview
20.3.9.2. Product Portfolio
20.3.9.3. Sales Footprint
20.3.9.4. Key Developments/Key Takeaways
20.3.9.5. Strategy Overview
20.3.10. Himalayas ONTOP
20.3.10.1. Overview
20.3.10.2. Product Portfolio
20.3.10.3. Sales Footprint
20.3.10.4. Key Developments/Key Takeaways
20.3.10.5. Strategy Overview
20.3.11. 3 Spring Water
20.3.11.1. Overview
20.3.11.2. Product Portfolio
20.3.11.3. Sales Footprint
20.3.11.4. Key Developments/Key Takeaways
20.3.11.5. Strategy Overview
20.3.12. Magnetic Spring
20.3.12.1. Overview
20.3.12.2. Product Portfolio
20.3.12.3. Sales Footprint
20.3.12.4. Key Developments/Key Takeaways
20.3.12.5. Strategy Overview
20.3.13. Mountain Valley Spring Water (Primo Water Corp.)
20.3.13.1. Overview
20.3.13.2. Product Portfolio
20.3.13.3. Sales Footprint
20.3.13.4. Key Developments/Key Takeaways
20.3.13.5. Strategy Overview
20.3.14. Premium Waters, Inc.
20.3.14.1. Overview
20.3.14.2. Product Portfolio
20.3.14.3. Sales Footprint
20.3.14.4. Key Developments/Key Takeaways
20.3.14.5. Strategy Overview
20.3.15. Tata Consumer Products (Himalayan)
20.3.15.1. Overview
20.3.15.2. Product Portfolio
20.3.15.3. Sales Footprint
20.3.15.4. Key Developments/Key Takeaways
20.3.15.5. Strategy Overview
20.3.16. Others
Note: The list of companies above is tentative and it is subjected to change based on research process and/or customization requirements.
21. Assumptions and Acronyms Used
22. Research Methodology
List of Table
Table 01: Global Spring Water Market Value (US$ Mn) Analysis and Forecast by Container Type Segment, 2022–2032
Table 02: Global Spring Water Market Volume (Tons) Analysis and Forecast by Container Type Segment, 2022–2032
Table 03: Global Spring Water Market Value (US$ Mn) Analysis and Forecast by Distribution Channel Segment, 2022–2032
Table 04: Global Spring Water Market Volume (Tons) Analysis and Forecast by Distribution Channel Segment, 2022–2032
Table 05: Global Spring Water Market Value (US$ Mn) Analysis and Forecast by Business to Consumers, 2017-2032
Table 06: Global Spring Water Market Value (US$ Mn) Analysis and Forecast by Business to Consumers, 2017-2032
Table 07: Global Spring Water Market Value (US$ Mn) Analysis and Forecast by Region, 2022–2032
Table 08: Global Spring Water Market Volume (Tons) Analysis and Forecast by Region, 2022–2032
Table 09: North America Spring Water Market Value (US$ Mn) Analysis and Forecast by Container Type Segment, 2022–2032
Table 10: North America Spring Water Market Volume (Tons) Analysis and Forecast by Container Type Segment, 2022–2032
Table 11: North America Spring Water Market Value (US$ Mn) Analysis and Forecast by Distribution Channel Segment, 2022–2032
Table 12: North America Spring Water Market Volume (Tons) Analysis and Forecast by Distribution Channel Segment, 2022–2032
Table 13: North America Spring Waters Market Value (US$ Mn) Analysis and Forecast by Business to Consumers, 2017-2032
Table 14: North America Spring Waters Market Value (US$ Mn) Analysis and Forecast by Business to Consumers, 2017-2032
Table 15: North America Spring Waters Market Volume (Tons) Analysis and Forecast by Business to Consumers, 2017-2032
Table 16: North America Spring Waters Market Volume (Tons) Analysis and Forecast by Business to Consumers, 2017-2032
Table 17: North America Spring Water Market Value (US$ Mn) Analysis and Forecast by Country, 2022–2032
Table 18: North America Spring Water Market Volume (Tons) Analysis and Forecast by Country, 2022–2032
Table 19: Latin America Spring Water Market Value (US$ Mn) Analysis and Forecast by Container Type Segment, 2022–2032
Table 20: Latin America Spring Water Market Volume (Tons) Analysis and Forecast by Container Type Segment, 2022–2032
Table 21: Latin America Spring Water Market Value (US$ Mn) Analysis and Forecast by Distribution Channel Segment, 2022–2032
Table 22: Latin America Spring Water Market Volume (Tons) Analysis and Forecast by Distribution Channel Segment, 2022–2032
Table 23: Latin America Spring Waters Market Value (US$ Mn) Analysis and Forecast by Business to Consumers, 2017-2032
Table 24: Latin America Spring Waters Market Value (US$ Mn) Analysis and Forecast by Business to Consumers, 2017-2032
Table 25: Latin America Spring Waters Market Volume (Tons) Analysis and Forecast by Business to Consumers, 2017-2032
Table 26: Latin America Spring Waters Market Volume (Tons) Analysis and Forecast by Business to Consumers, 2017-2032
Table 27: Latin America Spring Water Market Value (US$ Mn) Analysis and Forecast by Country, 2022–2032
Table 28: Latin America Spring Water Market Volume (Tons) Analysis and Forecast by Country, 2022–2032
Table 29: Europe Spring Water Market Value (US$ Mn) Analysis and Forecast by Container Type Segment, 2022–2032
Table 30: Europe Spring Water Market Volume (Tons) Analysis and Forecast by Container Type Segment, 2022–2032
Table 31: Europe Spring Water Market Value (US$ Mn) Analysis and Forecast by Distribution Channel Segment, 2022–2032
Table 32: Europe Spring Water Market Volume (Tons) Analysis and Forecast by Distribution Channel Segment, 2022–2032
Table 33: Europe Spring Waters Market Value (US$ Mn) Analysis and Forecast by Business to Consumers, 2017-2032
Table 34: Europe Spring Waters Market Value (US$ Mn) Analysis and Forecast by Business to Consumers, 2017-2032
Table 35: Europe Spring Waters Market Volume (Tons) Analysis and Forecast by Business to Consumers, 2017-2032
Table 36: Europe Spring Waters Market Volume (Tons) Analysis and Forecast by Business to Consumers, 2017-2032
Table 37: Europe Spring Water Market Value (US$ US$ Mn) Analysis and Forecast by Country, 2022–2032
Table 38: Europe Spring Water Market Volume (Tons) Analysis and Forecast by Country, 2022–2032
Table 39: South Asia Spring Water Market Value (US$ Mn) Analysis and Forecast by Container Type Segment, 2022–2032
Table 40: South Asia Spring Water Market Volume (Tons) Analysis and Forecast by Container Type Segment, 2022–2032
Table 41: South Asia Spring Water Market Value (US$ Mn) Analysis and Forecast by Distribution Channel Segment, 2022–2032
Table 42: South Asia Spring Water Market Volume (Tons) Analysis and Forecast by Distribution Channel Segment, 2022–2032
Table 43: South Asia Spring Waters Market Value (US$ Mn) Analysis and Forecast by Business to Consumers, 2017-2032
Table 44: South Asia Spring Waters Market Value (US$ Mn) Analysis and Forecast by Business to Consumers, 2017-2032
Table 45: South Asia Spring Waters Market Volume (Tons) Analysis and Forecast by Business to Consumers, 2017-2032
Table 46: South Asia Spring Waters Market Volume (Tons) Analysis and Forecast by Business to Consumers, 2017-2032
Table 47: South Asia Spring Water Market Value (US$ Mn) Analysis and Forecast by Country, 2022–2032
Table 48: South Asia Spring Water Market Volume (Tons) Analysis and Forecast by Country, 2022–2032
Table 49: East Asia Spring Water Market Value (US$ Mn) Analysis and Forecast by Container Type Segment, 2022–2032
Table 50: East Asia Spring Water Market Volume (Tons) Analysis and Forecast by Container Type Segment, 2022–2032
Table 51: East Asia Spring Water Market Value (US$ Mn) Analysis and Forecast by Distribution Channel Segment, 2022–2032
Table 52: East Asia Spring Water Market Volume (Tons) Analysis and Forecast by Distribution Channel Segment, 2022–2032
Table 53: East Asia Spring Waters Market Value (US$ Mn) Analysis and Forecast by Business to Consumers, 2017-2032
Table 54: East Asia Spring Waters Market Value (US$ Mn) Analysis and Forecast by Business to Consumers, 2017-2032
Table 55: East Asia Spring Waters Market Volume (Tons) Analysis and Forecast by Business to Consumers, 2017-2032
Table 56: East Asia Spring Waters Market Volume (Tons) Analysis and Forecast by Business to Consumers, 2017-2032
Table 57: East Asia Spring Water Market Value (US$ Mn) Analysis and Forecast by Country, 2022–2032
Table 58: East Asia Spring Water Market Volume (Tons) Analysis and Forecast by Country, 2022–2032
Table 59: Oceania Spring Water Market Value (US$ Mn) Analysis and Forecast by Container Type Segment, 2022–2032
Table 60: Oceania Spring Water Market Volume (Tons) Analysis and Forecast by Container Type Segment, 2022–2032
Table 61: Oceania Spring Water Market Value (US$ Mn) Analysis and Forecast by Distribution Channel Segment, 2022–2032
Table 62: Oceania Spring Water Market Volume (Tons) Analysis and Forecast by Distribution Channel Segment, 2022–2032
Table 63: Oceania Spring Waters Market Value (US$ Mn) Analysis and Forecast by Business to Consumers, 2017-2032
Table 64: Oceania Spring Waters Market Value (US$ Mn) Analysis and Forecast by Business to Consumers, 2017-2032
Table 65: Oceania Spring Waters Market Volume (Tons) Analysis and Forecast by Business to Consumers, 2017-2032
Table 66: Oceania Spring Waters Market Volume (Tons) Analysis and Forecast by Business to Consumers, 2017-2032
Table 67: Oceania Spring Water Market Value (US$ Mn) Analysis and Forecast by Country, 2022–2032
Table 68: Oceania Spring Water Market Volume (Tons) Analysis and Forecast by Country, 2022–2032
Table 69: Middle East & Africa Spring Water Market Value (US$ Mn) Analysis and Forecast by Container Type Segment, 2022–2032
Table 70: Middle East & Africa Spring Water Market Volume (Tons) Analysis and Forecast by Container Type Segment, 2022–2032
Table 71: Middle East & Africa Spring Water Market Value (US$ Mn) Analysis and Forecast by Distribution Channel Segment, 2022–2032
Table 72: Middle East & Africa Spring Water Market Volume (Tons) Analysis and Forecast by Distribution Channel Segment, 2022–2032
Table 73: Middle East & Africa Spring Waters Market Value (US$ Mn) Analysis and Forecast by Business to Consumers, 2017-2032
Table 74: Middle East & Africa Spring Waters Market Value (US$ Mn) Analysis and Forecast by Business to Consumers, 2017-2032
Table 75: Middle East & Africa Spring Waters Market Volume (Tons) Analysis and Forecast by Business to Consumers, 2017-2032
Table 76: Middle East & Africa Spring Waters Market Volume (Tons) Analysis and Forecast by Business to Consumers, 2017-2032
Table 77: Middle East & Africa Spring Water Market Value (US$ Mn) Analysis and Forecast by Country, 2022–2032
Table 78: Middle East & Africa Spring Water Market Volume (Tons) Analysis and Forecast by Country, 2022–2032
List of Figure
Figure 01: Global Spring Water Market Value (US$ Mn) Forecast, 2022–2032
Figure 02: Global Spring Water Market Volume (Tons) Forecast, 2022–2032
Figure 03: Global Spring Water Market Value Share Analysis by Container Type, 2022 E
Figure 04: Global Spring Water Market Y-o-Y Growth Rate by Container Type, 2022-2032
Figure 05: Global Spring Water Market Value (US$ Mn) Analysis & Forecast by Container Type, 2022–2032
Figure 06: Global Spring Water Market Volume (Tons) Analysis & Forecast by Container Type, 2022–2032
Figure 07: Global Spring Water Market Value Share Analysis by Distribution Channel, 2022 E
Figure 08: Global Spring Water Market Y-o-Y Growth Rate by Distribution Channel, 2022-2032
Figure 09: Global Spring Water Market Value (US$ Mn) Analysis & Forecast by Distribution Channel, 2022–2032
Figure 10: Global Spring Water Market Volume (Tons) Analysis & Forecast by Distribution Channel, 2022–2032
Figure 11: Global Spring Water Market Value Share Analysis by Region, 2022 E
Figure 12: Global Spring Water Market Y-o-Y Growth Rate by Region, 2022-2032
Figure 13: Global Spring Water Market Value (US$ Mn) Analysis & Forecast by Region, 2022–2032
Figure 14: Global Spring Water Market Volume (Tons) Analysis & Forecast by Region, 2022–2032
Figure 15: Global Spring Water Market Attractiveness Analysis by Region, 2022-2032
Figure 16: Global Spring Water Market Attractiveness Analysis by Container Type, 2022-2032
Figure 17: Global Spring Water Market Attractiveness Analysis by Distribution Channel, 2022-2032
Figure 18: North America Spring Water Market Value (US$ Mn) Analysis & Forecast by Container Type, 2022–2032
Figure 19: North America Spring Water Market Volume (Tons) Analysis & Forecast by Container Type, 2022–2032
Figure 20: North America Spring Water Market Value (US$ Mn) Analysis & Forecast by Distribution Channel, 2022–2032
Figure 21: North America Spring Water Market Volume (Tons) Analysis & Forecast by Distribution Channel, 2022–2032
Figure 22: North America Spring Water Market Value (US$ Mn) Analysis & Forecast by Country, 2022–2032
Figure 23: North America Spring Water Market Volume (Tons) Analysis & Forecast by Country, 2022–2032
Figure 24: North America Spring Water Market Attractiveness Analysis by Country, 2022-2032
Figure 25: North America Spring Water Market Attractiveness Analysis by Container Type, 2022-2032
Figure 26: North America Spring Water Market Attractiveness Analysis by Distribution Channel, 2022-2032
Figure 27: Latin America Spring Water Market Value (US$ Mn) Analysis & Forecast by Container Type, 2022–2032
Figure 28: Latin America Spring Water Market Volume (Tons) Analysis & Forecast by Container Type, 2022–2032
Figure 29: Latin America Spring Water Market Value (US$ Mn) Analysis & Forecast by Distribution Channel, 2022–2032
Figure 30: Latin America Spring Water Market Volume (Tons) Analysis & Forecast by Distribution Channel, 2022–2032
Figure 31: Latin America Spring Water Market Value (US$ Mn) Analysis & Forecast by Country, 2022–2032
Figure 32: Latin America Spring Water Market Volume (TONS) Analysis & Forecast by Country, 2022–2032
Figure 33: Latin America Spring Water Market Attractiveness Analysis by Country, 2022-2032
Figure 34: Latin America Spring Water Market Attractiveness Analysis by Container Type, 2022-2032
Figure 35: Latin America Spring Water Market Attractiveness Analysis by Distribution Channel, 2022-2032
Figure 36: Europe Spring Water Market Value (US$ Mn) Analysis & Forecast by Container Type, 2022–2032
Figure 37: Europe Spring Water Market Volume (Tons) Analysis & Forecast by Container Type, 2022–2032
Figure 38: Europe Spring Water Market Value (US$ Mn) Analysis & Forecast by Distribution Channel, 2022–2032
Figure 39: Europe Spring Water Market Volume (Tons) Analysis & Forecast by Distribution Channel, 2022–2032
Figure 40: Europe Spring Water Market Value (US$ Mn) Analysis & Forecast by Country, 2022–2032
Figure 41: Europe Spring Water Market Volume (Tons) Analysis & Forecast by Country, 2022–2032
Figure 42: Europe Spring Water Market Attractiveness Analysis by Country, 2022-2032
Figure 43: Europe Spring Water Market Attractiveness Analysis by Container Type, 2022-2032
Figure 44: Europe Spring Water Market Attractiveness Analysis by Distribution Channel, 2022-2032
Figure 45: South Asia Spring Water Market Value (US$ Mn) Analysis & Forecast by Container Type, 2022–2032
Figure 46: South Asia Spring Water Market Volume (Tons) Analysis & Forecast by Container Type, 2022–2032
Figure 47: South Asia Spring Water Market Value (US$ Mn) Analysis & Forecast by Distribution Channel, 2022–2032
Figure 48: South Asia Spring Water Market Volume (Tons) Analysis & Forecast by Distribution Channel, 2022–2032
Figure 49: South Asia Spring Water Market Value (US$ Mn) Analysis & Forecast by Country, 2022–2032
Figure 50: South Asia Spring Water Market Volume (Tons) Analysis & Forecast by Country, 2022–2032
Figure 51: South Asia Spring Water Market Attractiveness Analysis by Country, 2022-2032
Figure 52: South Asia Spring Water Market Attractiveness Analysis by Container Type, 2022-2032
Figure 53: South Asia Spring Water Market Attractiveness Analysis by Distribution Channel, 2022-2032
Figure 54: East Asia Spring Water Market Value (US$ Mn) Analysis & Forecast by Container Type, 2022–2032
Figure 55: East Asia Spring Water Market Volume (Tons) Analysis & Forecast by Container Type, 2022–2032
Figure 56: East Asia Spring Water Market Value (US$ Mn) Analysis & Forecast by Distribution Channel, 2022–2032
Figure 57: East Asia Spring Water Market Volume (Tons) Analysis & Forecast by Distribution Channel, 2022–2032
Figure 58: East Asia Spring Water Market Value (US$ Mn) Analysis & Forecast by Country, 2022–2032
Figure 59: East Asia Spring Water Market Volume (Tons) Analysis & Forecast by Country, 2022–2032
Figure 60: East Asia Spring Water Market Attractiveness Analysis by Country, 2022-2032
Figure 61: East Asia Spring Water Market Attractiveness Analysis by Container Type, 2022-2032
Figure 62: Oceania Spring Water Market Value (US$ Mn) Analysis & Forecast by Container Type, 2022–2032
Figure 63: Oceania Spring Water Market Volume (Tons) Analysis & Forecast by Container Type, 2022–2032
Figure 64: Oceania Spring Water Market Value (US$ Mn) Analysis & Forecast by Distribution Channel, 2022–2032
Figure 65: Oceania Spring Water Market Volume (Tons) Analysis & Forecast by Distribution Channel, 2022–2032
Figure 66: Oceania Spring Water Market Value (US$ Mn) Analysis & Forecast by Country, 2022–2032
Figure 67: Oceania Spring Water Market Volume (Tons) Analysis & Forecast by Country, 2022–2032
Figure 68: Oceania Spring Water Market Attractiveness Analysis by Country, 2022-2032
Figure 69: Oceania Spring Water Market Attractiveness Analysis by Container Type, 2022-2032
Figure 70: Oceania Spring Water Market Attractiveness Analysis by Distribution Channel, 2022-2032
Figure 71: Middle East & Africa Spring Water Market Value (US$ Mn) Analysis & Forecast by Container Type, 2022–2032
Figure 72: Middle East & Africa Spring Water Market Volume (Tons) Analysis & Forecast by Container Type, 2022–2032
Figure 73: Middle East & Africa Spring Water Market Value (US$ Mn) Analysis & Forecast by Distribution Channel, 2022–2032
Figure 74: Middle East & Africa Spring Water Market Volume (Tons) Analysis & Forecast by Distribution Channel, 2022–2032
Figure 75: Middle East & Africa Spring Water Market Value (US$ Mn) Analysis & Forecast by Country, 2022–2032
Figure 76: Middle East & Africa Spring Water Market Volume (Tons) Analysis & Forecast by Country, 2022–2032
Figure 77: Middle East & Africa Spring Water Market Attractiveness Analysis by Country, 2022-2032
Figure 78: Middle East & Africa Spring Water Market Attractiveness Analysis by Container Type, 2022-2032
Figure 79: Middle East & Africa Spring Water Market Attractiveness Analysis by Distribution Channel, 2022-2032
Copyright © Transparency Market Research, Inc. All Rights reserved
Trust Online


Spring Water Market